. 2021 Jan 4;21(1):10.
doi: 10.1167/jov.21.1.10.

Reduced surround suppression in monocular motion perception

Affiliations

Reduced surround suppression in monocular motion perception

Sandra Arranz-Paraíso et al. J Vis. .

Abstract

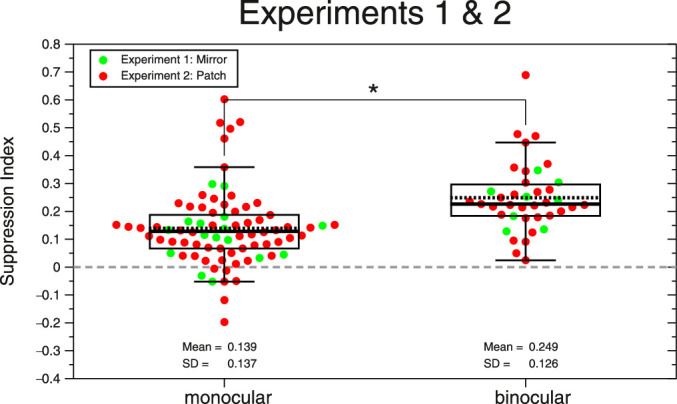
Motion discrimination of large stimuli is impaired at high contrast and short durations. This psychophysical result has been linked with the center-surround suppression found in neurons of area MT. Recent physiology results have shown that most frontoparallel MT cells respond more strongly to binocular than to monocular stimulation. Here we measured the surround suppression strength under binocular and monocular viewing. Thirty-nine participants took part in two experiments: (a) where the nonstimulated eye viewed a blank field of the same luminance (n = 8) and (b) where it was occluded with a patch (n = 31). In both experiments, we measured duration thresholds for small (1 deg diameter) and large (7 deg) drifting gratings of 1 cpd with 85% contrast. For each subject, a Motion Suppression Index (MSI) was computed by subtracting the duration thresholds in logarithmic units of the large minus the small stimulus. Results were similar in both experiments. Combining the MSI of both experiments, we found that the strength of suppression for binocular condition (MSIbinocular = 0.249 ± 0.126 log10 (ms)) is 1.79 times higher than under monocular viewing (MSImonocular = 0.139 ± 0.137 log10 (ms)). This increase is too high to be explained by the higher perceived contrast of binocular stimuli and offers a new way of testing whether MT neurons account for surround suppression. Potentially, differences in surround suppression reported in clinical populations may reflect altered binocular processing.


Figures

Figure 1.
Figure 1.
Examples of the stimuli used in the experiments. (A) Vertical grating of 1 c/deg windowed by a two-dimensional isotropic Butterworth function of 1 deg diameter. (B) Vertical grating of 1 c/deg with Butterworth window of 7 deg diameter. The Michelson contrast of these examples is 0.85.
Figure 2.
Figure 2.
Beeswarm plots and boxplots of the duration thresholds from Experiment 1 (n = 8) for small and large stimuli and for binocular and monocular conditions (L, R, and L + R = average of both monocular conditions). The black line inside the boxplot shows the median, and the dotted line shows the mean. The bottom line of the box corresponds to the 25th percentile (Q1) and the upper line to the 75th percentile (Q3). The upper whisker corresponds to the largest value that is less than or equal to Q3 + 1.5 × interquartile range (IQR), and the lower whisker corresponds to the lowest value that is greater than or equal to Q1 – 1.5 × IQR, where IQR = Q3–Q1 is the interquartile range. The asterisk means significant differences after Bonferroni correction (p < 0.05/4).
Figure 3.
Figure 3.
Beeswarm plots and boxplots of the duration thresholds from Experiment 2 (n = 31) for small and large stimuli and for binocular and monocular conditions (L, R, and L + R = average of both monocular conditions). Colored dots show logarithmic duration thresholds from individual subjects. The black line inside the boxplot shows the median, and the dotted line shows the mean. The bottom line of the box corresponds to the 25th percentile (Q1) and the upper line to the 75th percentile (Q3). The upper whisker corresponds to the largest value that is less than or equal to Q3 + 1.5 × IQR, and the lower whisker corresponds to the lowest value that is greater than or equal to Q1 – 1.5 × IQR, where IQR = Q3–Q1 is the interquartile range. The asterisk means significant differences after Bonferroni correction (p < 0.05/4).
Figure 4.
Figure 4.
Beeswarm plots and boxplots of the MSI from Experiments 1 and 2 and two viewing conditions: binocular (n = 39) and monocular (note that the plot has 78 dots). Each dot shows the suppression index of each participant. Green dots correspond to the MSI from Experiment 1. Red dots are the MSI from Experiment 2. The black line inside the boxplot shows the median, and the dotted line shows the mean. The bottom line of the box corresponds to the 25th percentile (Q1) and the upper line to the 75th percentile (Q3). The upper whisker corresponds to the largest value that is less than or equal to Q3 + 1.5 × IQR, and the lower whisker corresponds to the lowest value that is greater than or equal to Q1 – 1.5 × IQR, where IQR = Q3–Q1 is the interquartile range. The asterisk means significant differences (p < 0.05).
Figure 5.
Figure 5.
Scatterplots of the MSI. Green dots, MSI from Experiment 1. Red dots, MSI from Experiment 2. (A) Right-eye monocular MSI versus left-eye monocular MSI. (B) Average monocular MSI (left and right MSI) versus binocular MSI. Two Pearson correlations and p values are shown per panel. One is calculated using all data points (n = 39) and the other after removing the influential observations (dots with Cook's distance higher than three times the mean of all Cook's distances) (n = 36). The dots removed from the correlation are inside the black circles. The dashed line represents the identity line. Note that in panel B, almost all dots are shifted below the identity line.
Figure 6.
Figure 6.
The black line shows a hypothetical linking function relating MT activity to log duration thresholds. Stronger activity results in lower thresholds, but this relationship becomes steeper as MT activity increases toward maximum. The colored lines mark the four stimulus conditions. For our hypothetical MT, large stimuli elicit only 63% of the activity of small stimuli, giving a physiological surround suppression index of log10(Signalsmall/Signallarge) = log10(0.72/0.45) = 0.2 and log10(0.55/0.35) = 0.2 for both binocular and monocular stimuli, respectively. However, the nonlinear linking function results in greater psychophysical surround suppression for binocular: log10(Tlarge/Tsmall) = 1.529 – 1.156 = 0.37 for binocular versus 1.612 – 1.425 = 0.19 for monocular. This demonstrates how psychophysical surround suppression can depend on viewing condition (monocular vs. binocular) even if the physiological surround suppression does not. Note, though, that a constant physiological suppression index cannot explain why binocular thresholds are higher than monocular for large stimuli, as we observe.

Similar articles

Cited by

References

    1. Agarwal A. B., Christensen A. J., Feng C. Y., Wen D., Johnson L. A., & von Bartheld C. S. (2017). Expression of schizophrenia biomarkers in extraocular muscles from patients with strabismus: an explanation for the link between exotropia and schizophrenia? PeerJ , 5, e4214. - PMC - PubMed
    1. Alais D., Van Der Smagt M. J., Verstraten F. A., & Van De Grind W. A (1996). Monocular mechanisms determine plaid motion coherence. Visual Neuroscience , 13(4), 615–626. - PubMed
    1. Allman J., Miezin F., & McGuinness E. (1985a). Stimulus specific responses from beyond the classical receptive field: Neurophysiological mechanisms for local-global comparisons in visual neurons. Annual Review of Neuroscience , 8(1), 407–430. - PubMed
    1. Allman J., Miezin F., & McGuinness E. (1985b). Direction- and velocity-specific responses from beyond the classical receptive field in the middle temporal visual area (MT). Perception , 14(2), 105–126. - PubMed
    1. Arranz-Paraíso S., Read J., & Serrano-Pedraza I. (2019). When perception from two eyes is slower than from one eye: Reduced surround suppression in monocular motion perception. Perception, 48(SI), 102–102, 10.1177/0301006618824879. - DOI - PMC - PubMed

Publication types

LinkOut - more resources