

Non-B DNA: a major contributor to small- and large-scale variation in nucleotide substitution frequencies across the genome
- PMID: 33450015
- PMCID: PMC7897504
- DOI: 10.1093/nar/gkaa1269
Non-B DNA: a major contributor to small- and large-scale variation in nucleotide substitution frequencies across the genome
Abstract
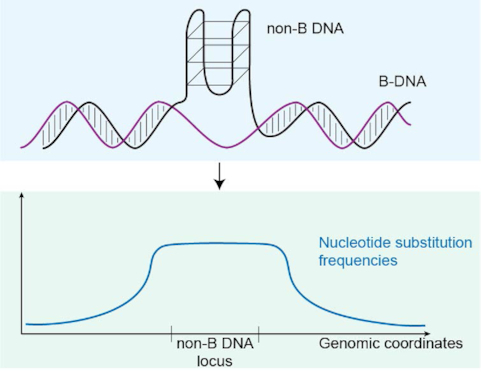
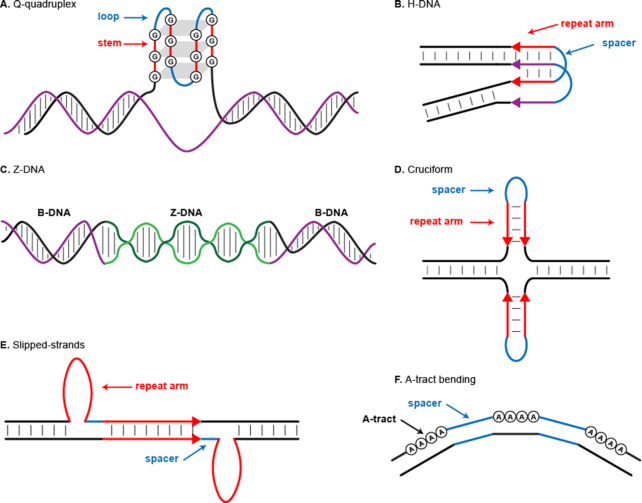
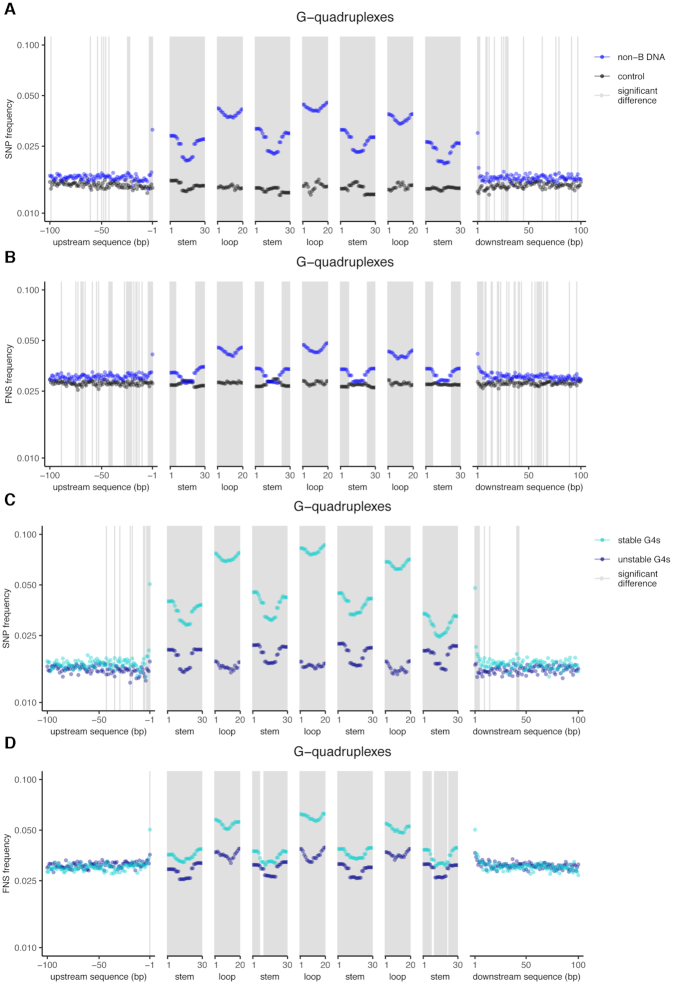
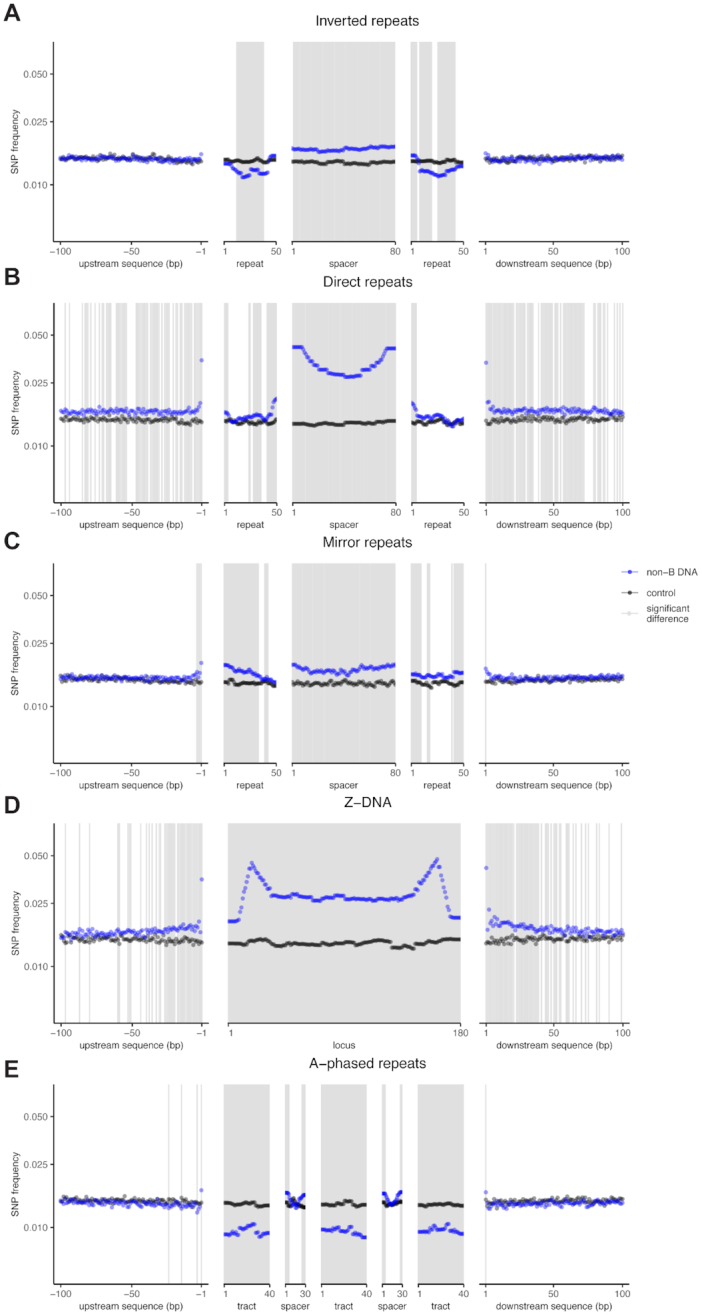
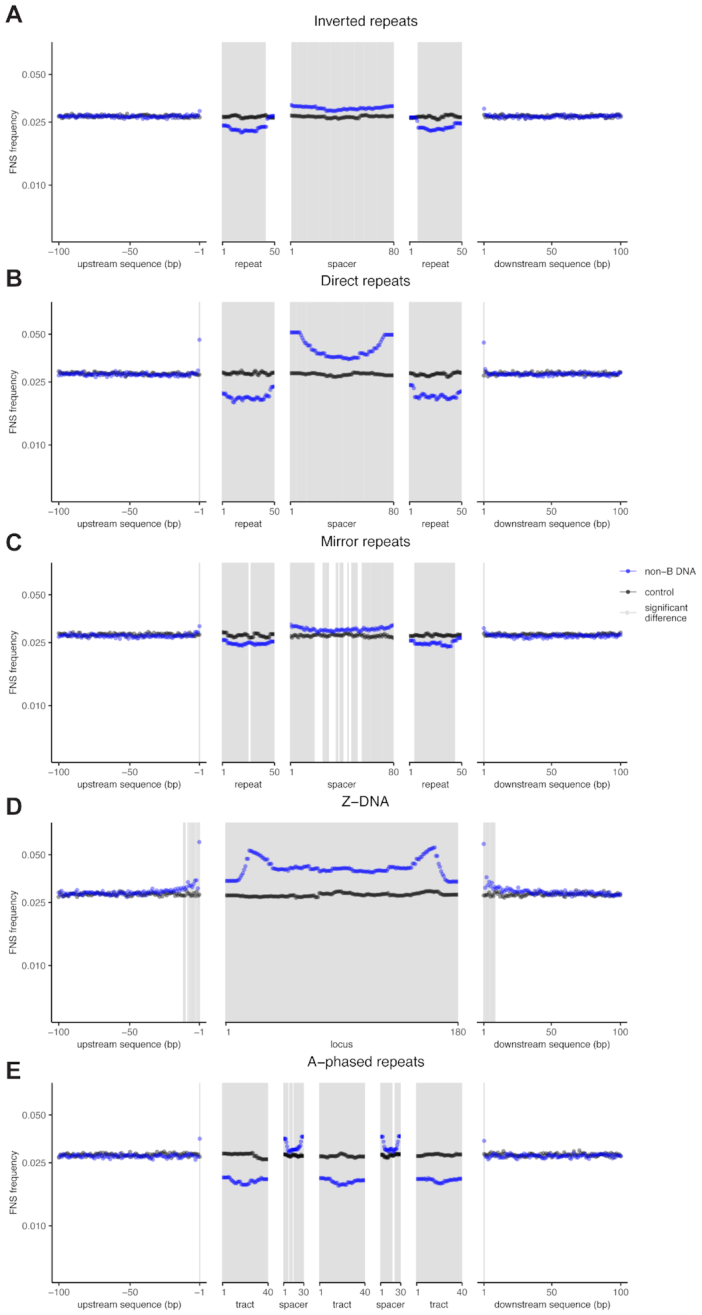
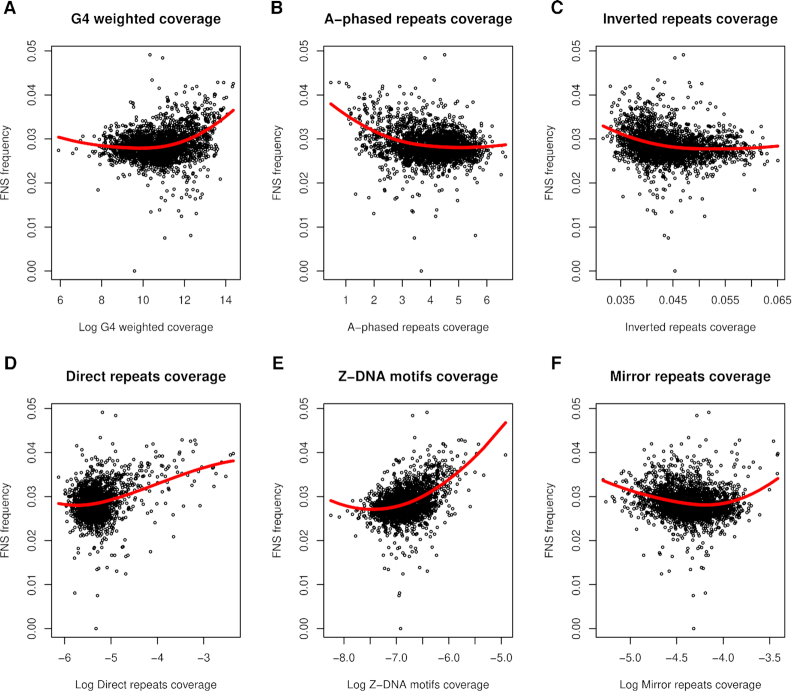
Approximately 13% of the human genome can fold into non-canonical (non-B) DNA structures (e.g. G-quadruplexes, Z-DNA, etc.), which have been implicated in vital cellular processes. Non-B DNA also hinders replication, increasing errors and facilitating mutagenesis, yet its contribution to genome-wide variation in mutation rates remains unexplored. Here, we conducted a comprehensive analysis of nucleotide substitution frequencies at non-B DNA loci within noncoding, non-repetitive genome regions, their ±2 kb flanking regions, and 1-Megabase windows, using human-orangutan divergence and human single-nucleotide polymorphisms. Functional data analysis at single-base resolution demonstrated that substitution frequencies are usually elevated at non-B DNA, with patterns specific to each non-B DNA type. Mirror, direct and inverted repeats have higher substitution frequencies in spacers than in repeat arms, whereas G-quadruplexes, particularly stable ones, have higher substitution frequencies in loops than in stems. Several non-B DNA types also affect substitution frequencies in their flanking regions. Finally, non-B DNA explains more variation than any other predictor in multiple regression models for diversity or divergence at 1-Megabase scale. Thus, non-B DNA substantially contributes to variation in substitution frequencies at small and large scales. Our results highlight the role of non-B DNA in germline mutagenesis with implications to evolution and genetic diseases.
© The Author(s) 2021. Published by Oxford University Press on behalf of Nucleic Acids Research.
Figures
Similar articles
-
Non-canonical DNA in human and other ape telomere-to-telomere genomes.Nucleic Acids Res. 2025 Apr 10;53(7):gkaf298. doi: 10.1093/nar/gkaf298. Nucleic Acids Res. 2025. PMID: 40226919 Free PMC article.
-
Potential non-B DNA regions in the human genome are associated with higher rates of nucleotide mutation and expression variation.Nucleic Acids Res. 2014 Nov 10;42(20):12367-79. doi: 10.1093/nar/gku921. Epub 2014 Oct 21. Nucleic Acids Res. 2014. PMID: 25336616 Free PMC article.
-
Segmenting the human genome based on states of neutral genetic divergence.Proc Natl Acad Sci U S A. 2013 Sep 3;110(36):14699-704. doi: 10.1073/pnas.1221792110. Epub 2013 Aug 19. Proc Natl Acad Sci U S A. 2013. PMID: 23959903 Free PMC article.
-
Repetitive DNA loci and their modulation by the non-canonical nucleic acid structures R-loops and G-quadruplexes.Nucleus. 2017 Mar 4;8(2):162-181. doi: 10.1080/19491034.2017.1292193. Nucleus. 2017. PMID: 28406751 Free PMC article. Review.
-
Substitutions Are Boring: Some Arguments about Parallel Mutations and High Mutation Rates.Trends Genet. 2019 Apr;35(4):253-264. doi: 10.1016/j.tig.2019.01.002. Epub 2019 Feb 20. Trends Genet. 2019. PMID: 30797597 Free PMC article. Review.
Cited by
-
S1-END-seq reveals DNA secondary structures in human cells.Mol Cell. 2022 Oct 6;82(19):3538-3552.e5. doi: 10.1016/j.molcel.2022.08.007. Epub 2022 Sep 7. Mol Cell. 2022. PMID: 36075220 Free PMC article.
-
Alternative splicing modulation by G-quadruplexes.Nat Commun. 2022 May 3;13(1):2404. doi: 10.1038/s41467-022-30071-7. Nat Commun. 2022. PMID: 35504902 Free PMC article.
-
Creation and resolution of non-B-DNA structural impediments during replication.Crit Rev Biochem Mol Biol. 2022 Aug;57(4):412-442. doi: 10.1080/10409238.2022.2121803. Epub 2022 Sep 28. Crit Rev Biochem Mol Biol. 2022. PMID: 36170051 Free PMC article.
-
Variation in G-quadruplex sequence and topology differentially impacts human DNA polymerase fidelity.DNA Repair (Amst). 2022 Nov;119:103402. doi: 10.1016/j.dnarep.2022.103402. Epub 2022 Sep 9. DNA Repair (Amst). 2022. PMID: 36116264 Free PMC article.
-
Influence network model uncovers relations between biological processes and mutational signatures.Genome Med. 2023 Mar 6;15(1):15. doi: 10.1186/s13073-023-01162-x. Genome Med. 2023. PMID: 36879282 Free PMC article.
References
-
- Hodgkinson A., Eyre-Walker A.. Variation in the mutation rate across mammalian genomes. Nat. Rev. Genet. 2011; 12:756–766. - PubMed
-
- Gojobori T., Li W.H., Graur D.. Patterns of nucleotide substitution in pseudogenes and functional genes. J. Mol. Evol. 1982; 18:360–369. - PubMed
-
- Bulmer M. Neighboring base effects on substitution rates in pseudogenes. Mol. Biol. Evol. 1986; 3:322–329. - PubMed
Publication types
MeSH terms
Substances
Grants and funding
LinkOut - more resources
Full Text Sources
Other Literature Sources
