. 2021 May 4;38(5):1761-1776.
doi: 10.1093/molbev/msaa312.

The Molecular Determinants of Thermoadaptation: Methanococcales as a Case Study

Affiliations

The Molecular Determinants of Thermoadaptation: Methanococcales as a Case Study

Michel Lecocq et al. Mol Biol Evol. .

Abstract

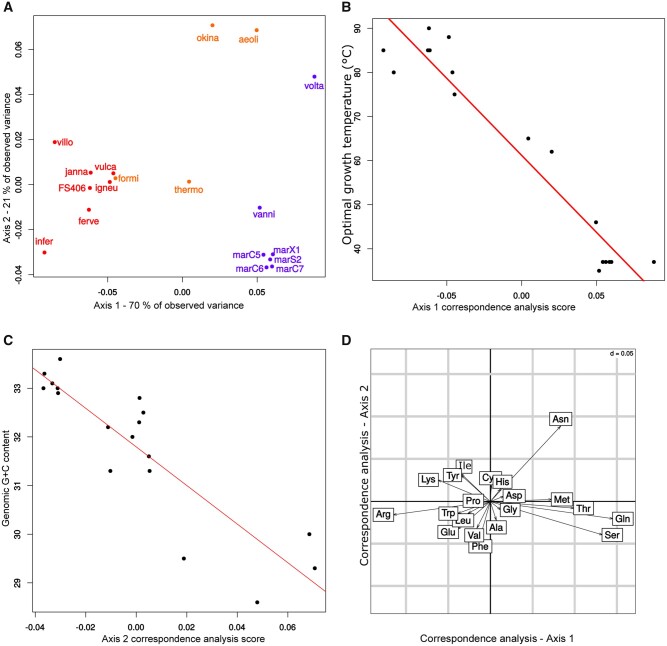
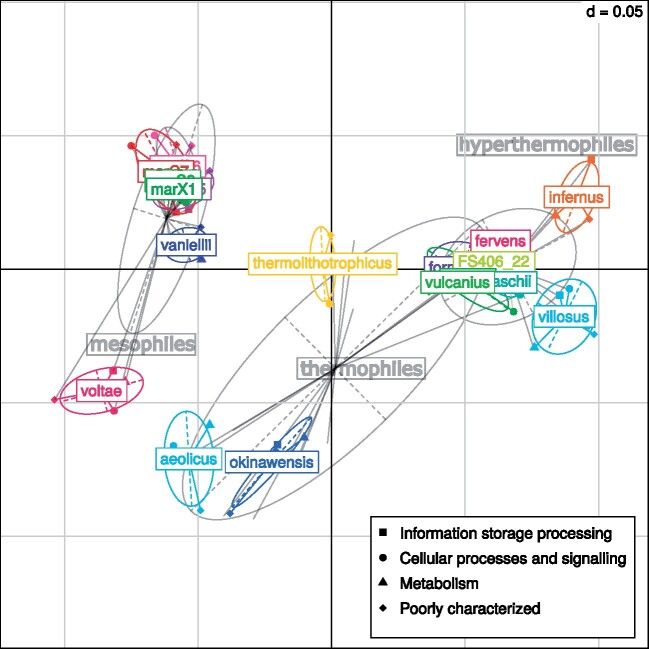
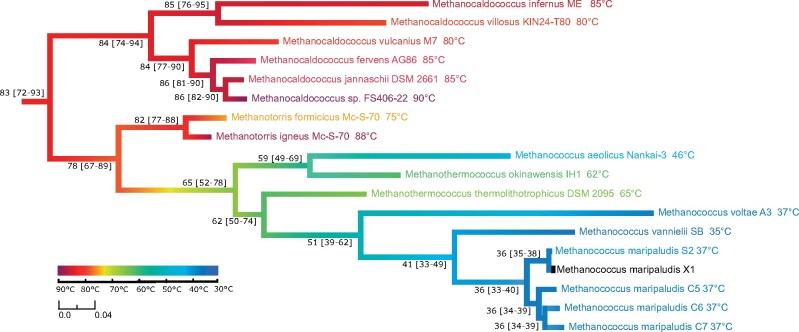
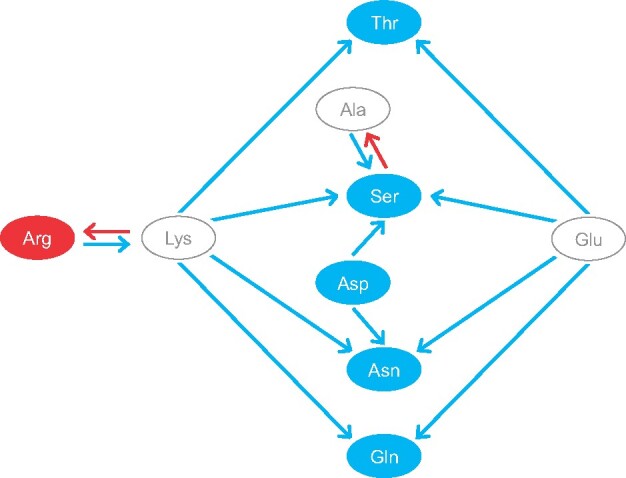
Previous reports have shown that environmental temperature impacts proteome evolution in Bacteria and Archaea. However, it is unknown whether thermoadaptation mainly occurs via the sequential accumulation of substitutions, massive horizontal gene transfers, or both. Measuring the real contribution of amino acid substitution to thermoadaptation is challenging, because of confounding environmental and genetic factors (e.g., pH, salinity, genomic G + C content) that also affect proteome evolution. Here, using Methanococcales, a major archaeal lineage, as a study model, we show that optimal growth temperature is the major factor affecting variations in amino acid frequencies of proteomes. By combining phylogenomic and ancestral sequence reconstruction approaches, we disclose a sequential substitutional scheme in which lysine plays a central role by fine tuning the pool of arginine, serine, threonine, glutamine, and asparagine, whose frequencies are strongly correlated with optimal growth temperature. Finally, we show that colonization to new thermal niches is not associated with high amounts of horizontal gene transfers. Altogether, although the acquisition of a few key proteins through horizontal gene transfer may have favored thermoadaptation in Methanococcales, our findings support sequential amino acid substitutions as the main factor driving thermoadaptation.

Keywords: Methanococci; ancestral sequence reconstruction; evolutionary rates; extremophiles; horizontal gene transfer; prokaryotes; protein.


Figures

Fig. 1.
Fig. 1.
Correspondence analyses of amino acid compositions of 18 methanococcales proteomes. (A) First factorial map of the correspondence analysis on the amino acid frequencies of 18 methanococcales proteomes. Dots represent the scores of each strain on the first two axes of the analysis. Red dots indicate hyperthermophilic strains with OGT ≥ 80 °C, namely: infer: Methanocaldococcus infernus ME (85 °C), villo: Methanocaldococcus villosus KIN24-T80, vulca: Methanocaldococcus vulcanius M7 (80 °C), ferve: Methanocaldococcus fervens AG86 (85 °C), janna: Methanocaldococcus jannaschii DSM 2261 (85 °C), FS406: Methanocaldococcus sp. FS406-22 (90 °C), igneu: Methanotorris igneus Kol 5 (88 °C). Orange dots indicate strains with 80 °C > OGT > 45 °C, namely: formi: Methanotorris formicicus Mc-S-70, okina: Methanothermococcus okinawensis IH1 (62 °C), thermo: Methanothermococcus thermolithotrophicus DSM 2095, aeoli: Methanococcus aeolicus Nankai-3 (46 °C). Blue dots indicate strains with OGT ≤ 45 °C, namely: vanni: Methanococcus vannielii SB (35 °C), volta: Methanococcus voltae A3 (37 °C), marC5/C6/C7/S2/X1: Methanococcus maripaludis strains C5 (37 °C), C6 (37 °C), C7 (37 °C), S2 (37 °C), and X1. (B) Correlation between OGT and scores on the first axis of the correspondence analysis. Each dot corresponds to a methanococcales proteome. The values on the first axis of the correspondence analysis are strongly correlated with OGT (r2 = −0.96, P value <0.001) but not with genomic G + C content (r2 = −0.06, P value = 0.8). (C) Correlation between genomic G + C content and scores on the second axis of the correspondence analysis. Each dot corresponds to a methanococcales proteome. The values on the second axis of the correspondence analysis are strongly correlated with G + C content (r = −0.77, P value <0.001) but not to OGT (r = 0.08, P value = 0.7). (D) Amino acid position on the first two factorial axes of the correspondence analysis on the amino acid frequencies of Methanococcales proteomes. Amino acids associated with high OGT are on the left, amino acids associated with moderate OGT are on the right.
Fig. 2.
Fig. 2.
Within-group correspondence analysis of proteins from 18 Methanococcales proteomes. Functional classes of the Methanococcales proteins were defined according to the arCOG database. Each mark represents the score of a given functional class in a given Methanococcales strain, on the first factorial map of the analysis. Colored ellipses and labels correspond to strains, light gray ellipses and labels correspond to mesophiles (OGT ≤ 45 °C), thermophiles (45 °C < OGT < 80 °C), and hyperthermophiles (80 °C ≤ OGT). Width and height of ellipses are proportional to scores variances of the group on the first and second axes.
Fig. 3.
Fig. 3.
Evolution of OGT in Methanococcales. Rooted maximum likelihood phylogeny of Methanococcales inferred with 538 single copy core protein families shared between Methanococcales and other Methanomada (127,077 amino acid positions). The tree is rooted in the branch separating Methanococcales from other Methanomada classes. The whole tree is shown as supplementary figure S7, Supplementary Material online. Branches were colored according to OGT estimated at each node of the phylogeny with the ANCOV method. Estimated ancestral OGT and confidence interval (95%) are on the left of each node. OGT of present-day strains are indicated at each leave. Scale bars represent the OGT (°C) color scheme and the average number of substitutions per site.
Fig. 4.
Fig. 4.
Substitutional patterns associated with thermoadaptation in Methanococcales. Red and blue circles highlight amino acids whose frequencies are positively and negatively correlated to OGT, respectively. Arrows indicate substitutions associated with OGT decrease (blue) and OGT increase (red).
Fig. 5.
Fig. 5.
Quantification of HGT in Methanococcales. Internal branches are named according to their reference number on the tree (black number) or according to the strain name for terminal branches. The number of HGTs detected with ALE is indicated above each branch (blue). On the right part, branches are ordered according to the number of inferred HGTs. For each bar, the corresponding OGT variation according to figure 3 is indicated between brackets, colors correspond to mesophiles (OGT ≤ 45 °C): blue; thermophiles (45 °C < OGT < 80 °C): orange; hyperthermophiles (80 °C ≤ OGT): red.

References

    1. Albers SV, Driessen AJ.. 2007. Membrane adaptations of (hyper)thermophiles to high temperatures. In: Gerday C, Glansdorff N, editors. Physiology and biochemistry of extremophiles Washington, D.C.: ASM press. p. 104–116.
    1. Albers S-V, Vossenberg JL, Driessen AJ, Konings WN.. 2001. Bioenergetics and solute uptake under extreme conditions. Extremophiles 5(5):285–294. - PubMed
    1. Ashkenazy H, Penn O, Doron-Faigenboim A, Cohen O, Cannarozzi G, Zomer O, Pupko T.. 2012. FastML: a web server for probabilistic reconstruction of ancestral sequences. Nucleic Acids Res. 40(W1):W580–W584. - PMC - PubMed
    1. Berezovsky IN, Shakhnovich EI.. 2005. Physics and evolution of thermophilic adaptation. Proc Natl Acad Sci U S A. 102(36):12742–12747. - PMC - PubMed
    1. Blaby IK, Lyons BJ, Wroclawska-Hughes E, Phillips GCF, Pyle TP, Chamberlin SG, Benner SA, Lyons TJ, de Crécy-Lagard V, de Crécy E.. 2012. Experimental evolution of a facultative thermophile from a mesophilic ancestor. Appl Environ Microbiol. 78(1):144–155. - PMC - PubMed

Publication types

LinkOut - more resources