. 2021 Mar;599(6):1833-1854.
doi: 10.1113/JP281014. Epub 2021 Jan 31.

Biased auditory nerve central synaptopathy is associated with age-related hearing loss

Affiliations

Biased auditory nerve central synaptopathy is associated with age-related hearing loss

Meijian Wang et al. J Physiol. 2021 Mar.

Abstract

Key points: Sound information is transmitted by different subtypes of spiral ganglion neurons (SGN) from the ear to the brain. Selective damage of SGN peripheral synapses (cochlear synaptopathy) is widely recognized as one of the primary mechanisms of hearing loss, whereas the mechanisms at the SGN central synapses remain unclear. We report that different subtypes of SGN central synapses converge at different ratios onto individual target cochlear nucleus neurons with distinct physiological properties, and show biased morphological and physiological changes during age-related hearing loss (ARHL). The results reveal a new dimension in cochlear nucleus neural circuitry that systematically reassembles and processes auditory information from different SGN subtypes, which is altered during ageing and probably contributes to the development of ARHL. In addition to known cochlear synaptopathy, the present study shows that SGN central synapses are also pathologically changed during ageing, which collectively helps us better understand the structure and function of SGNs during ARHL.

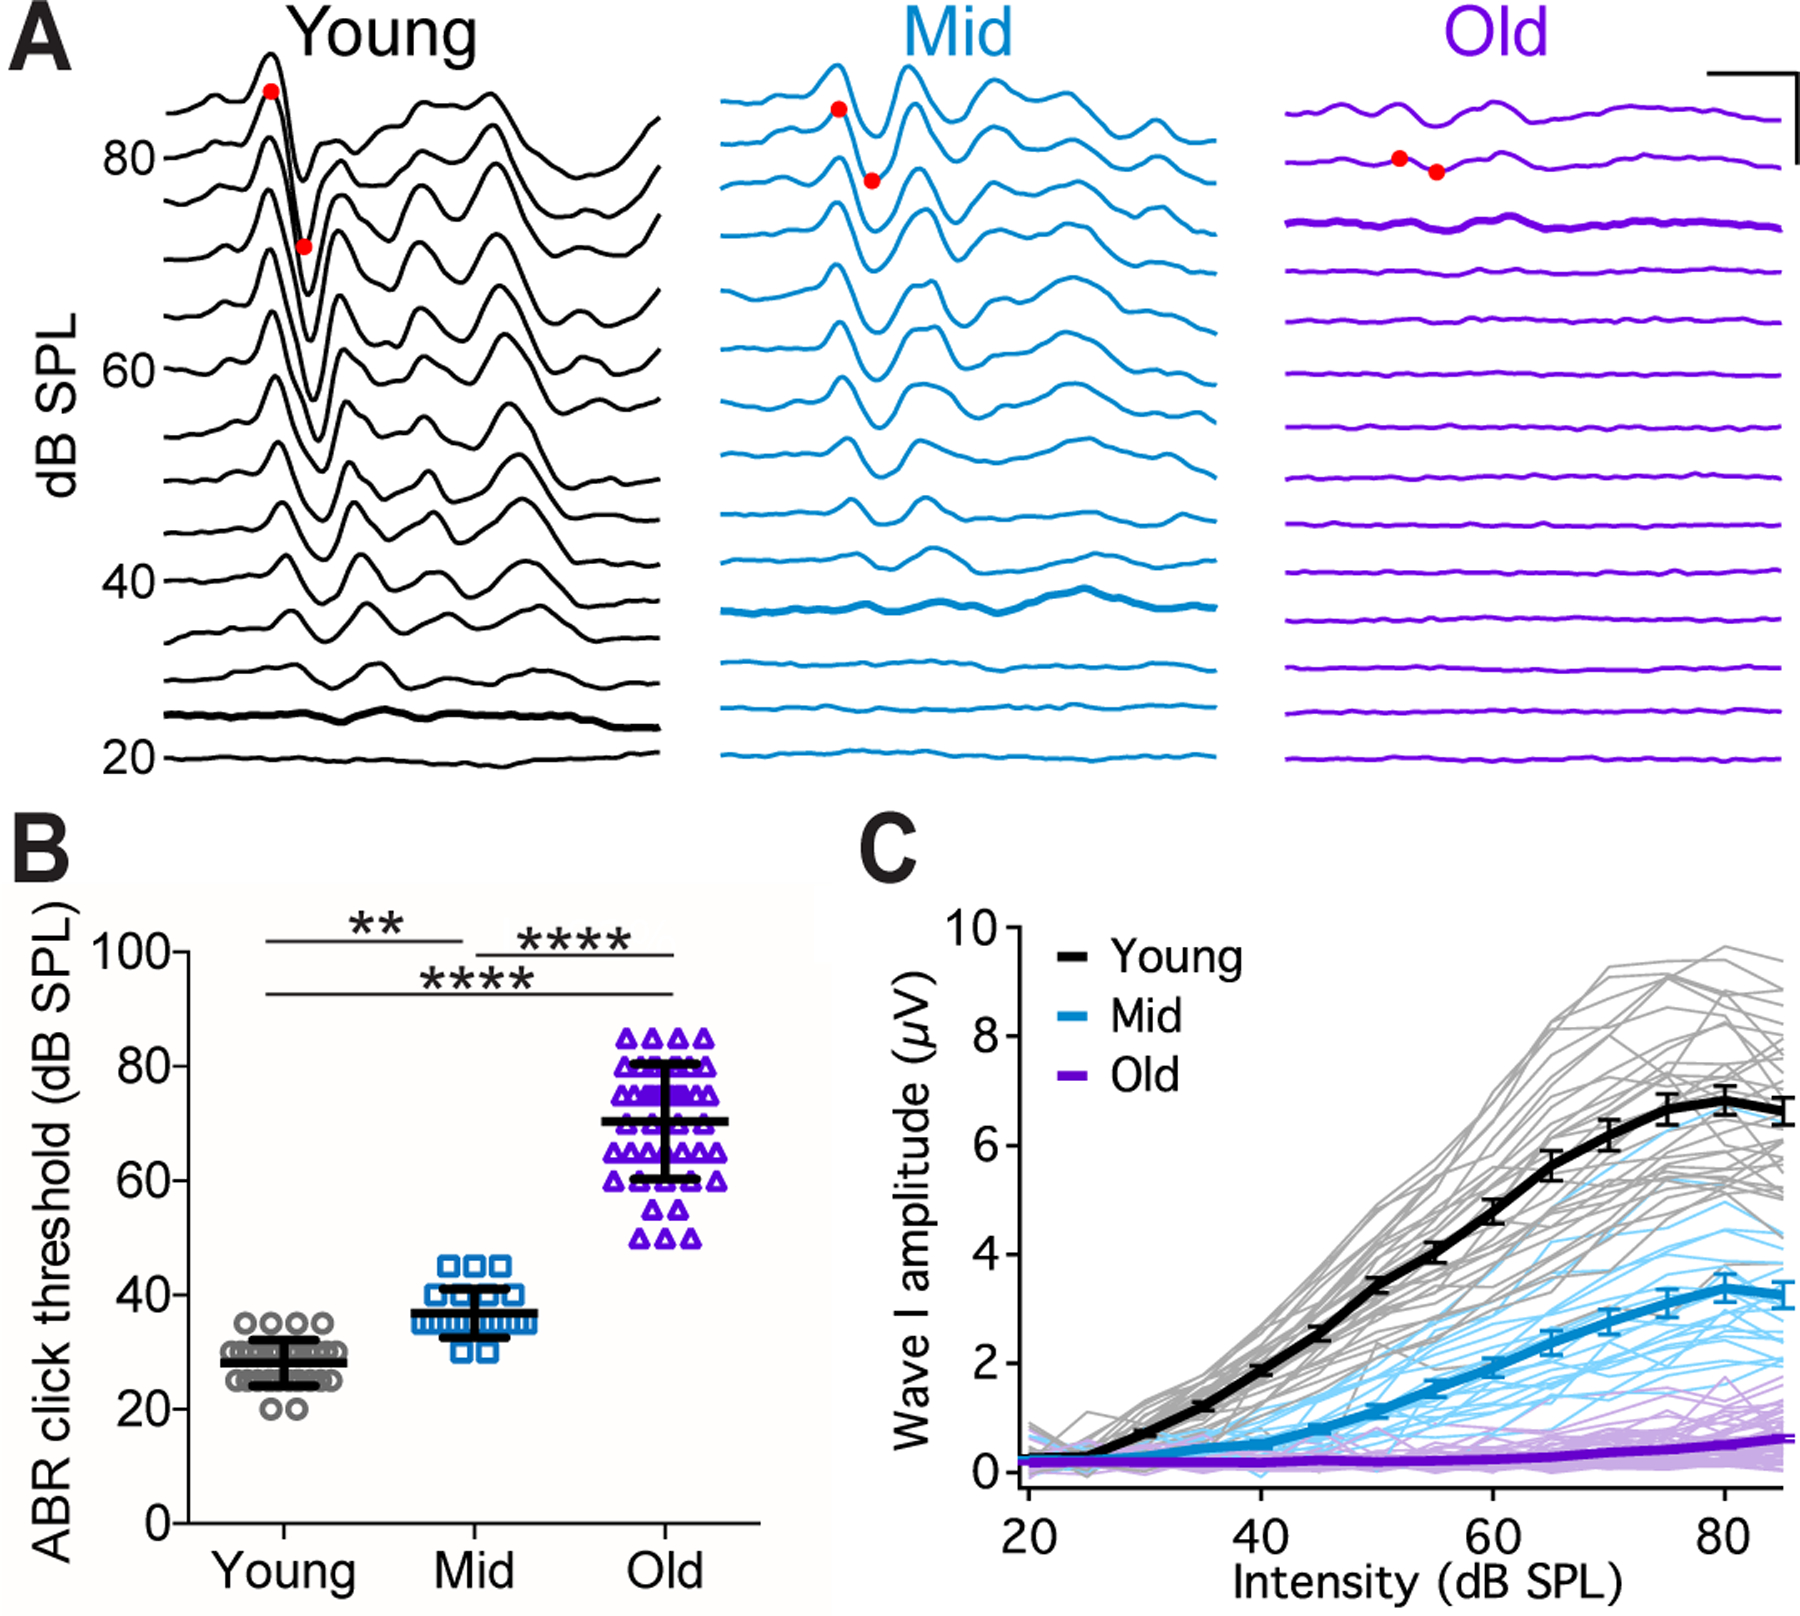
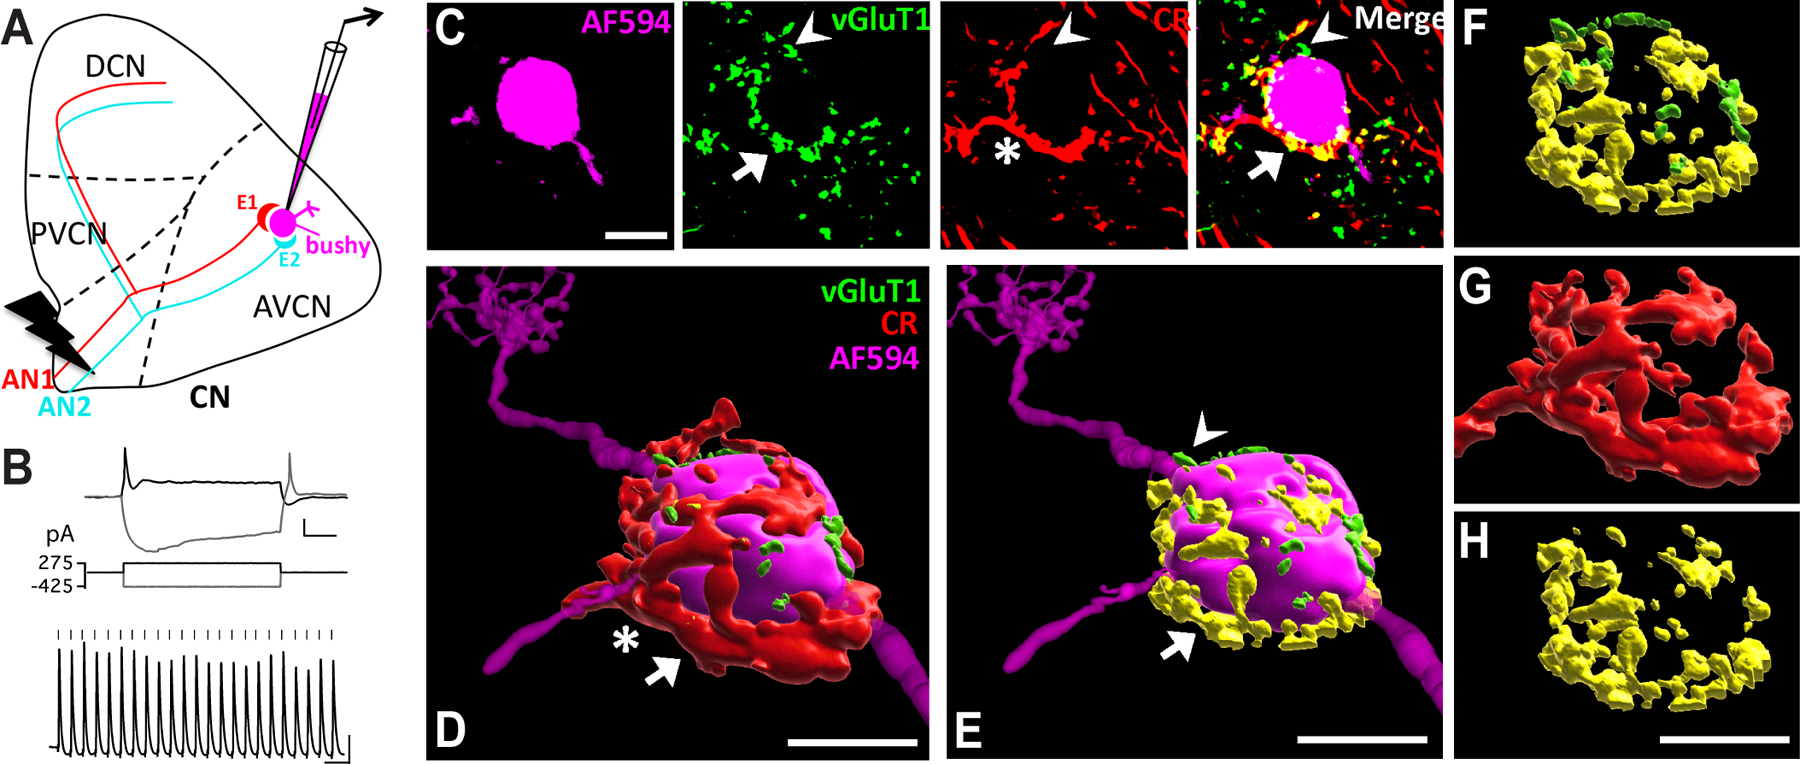
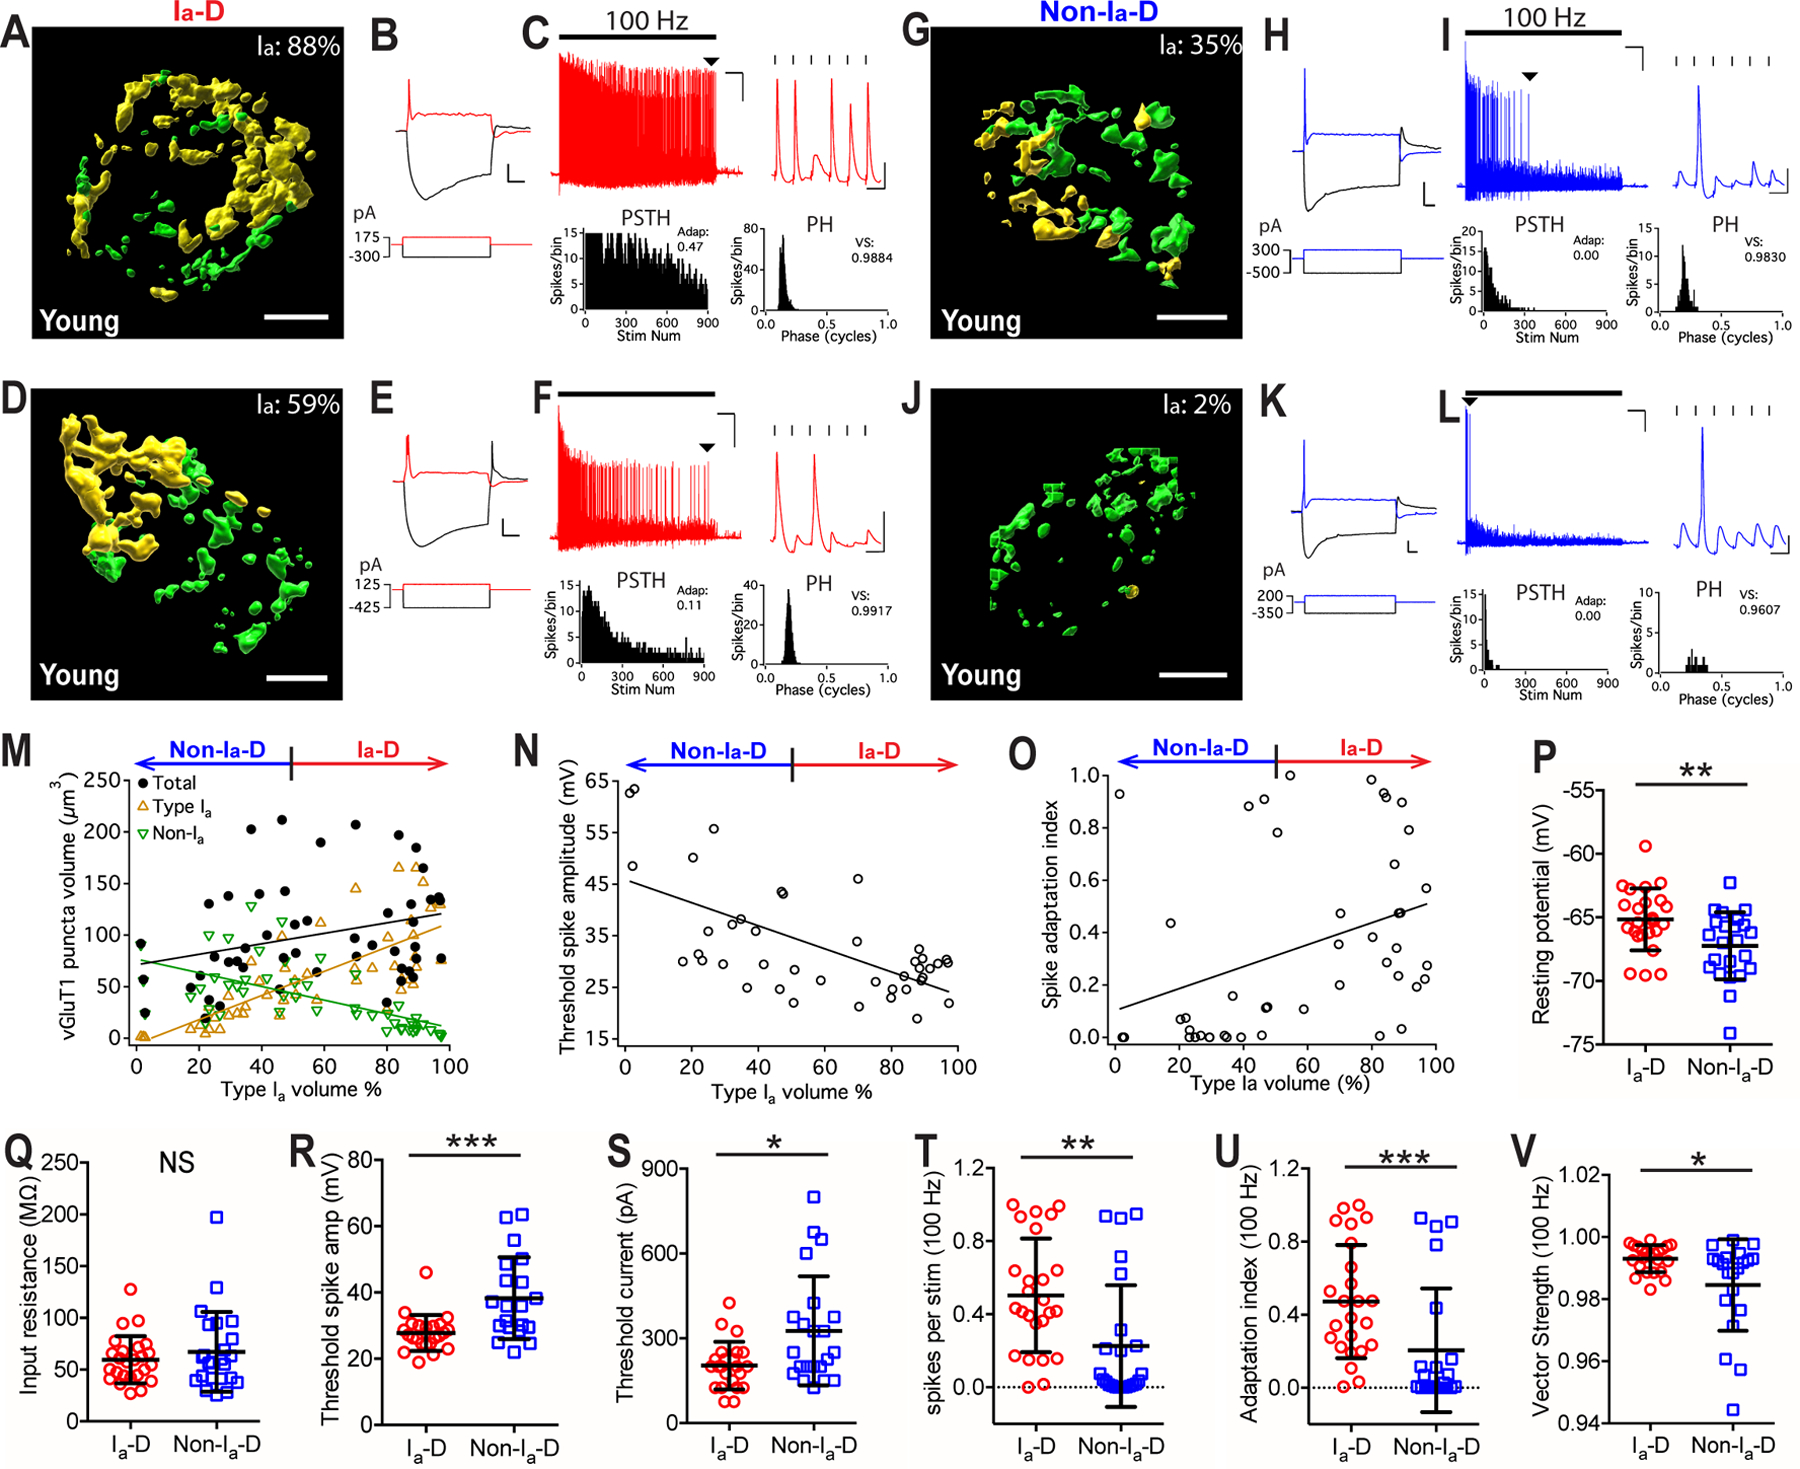
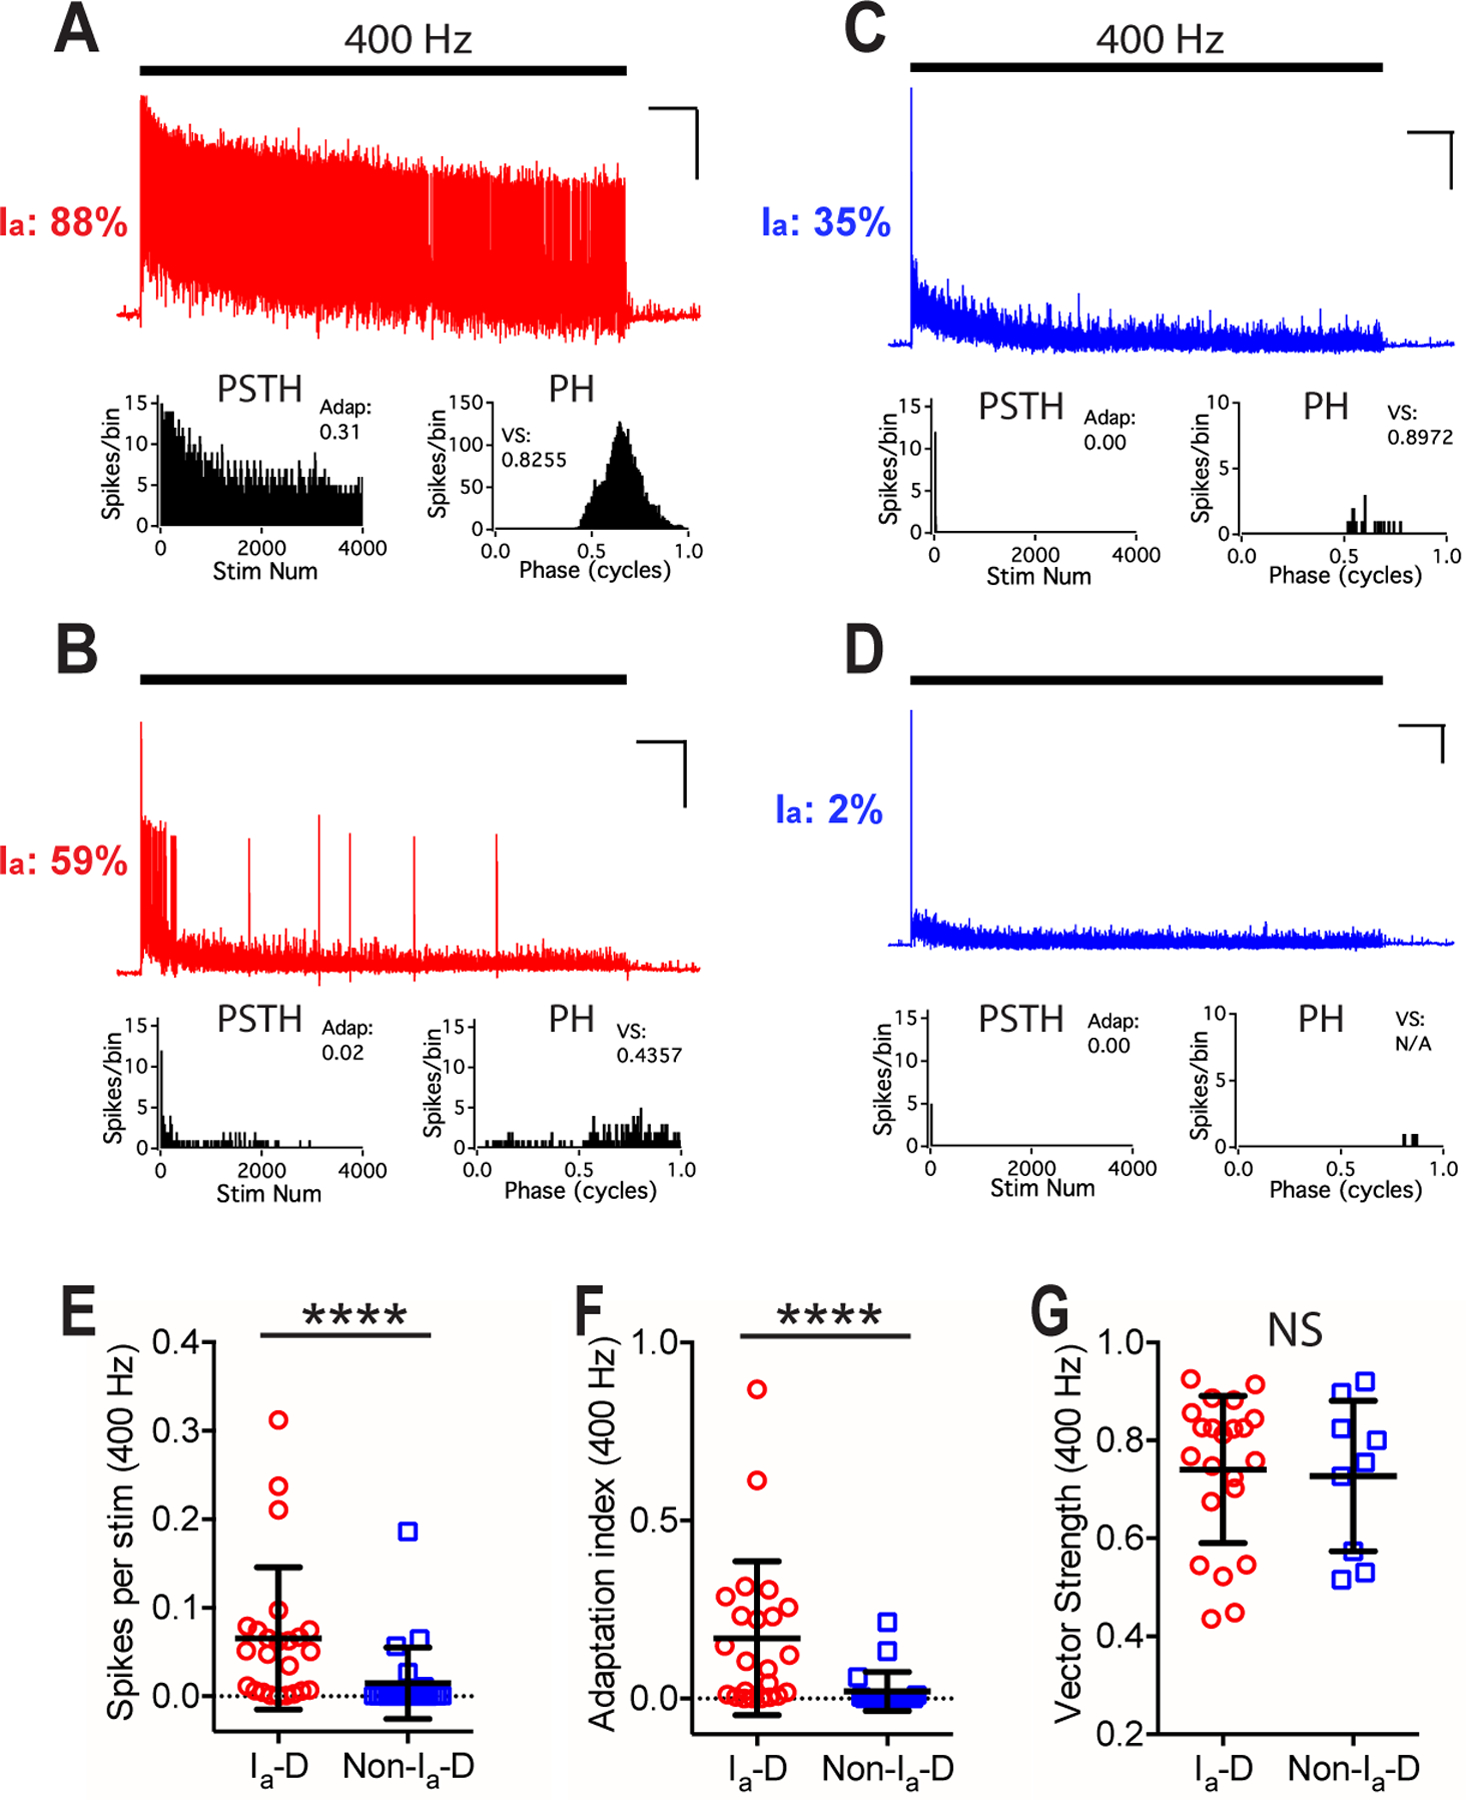
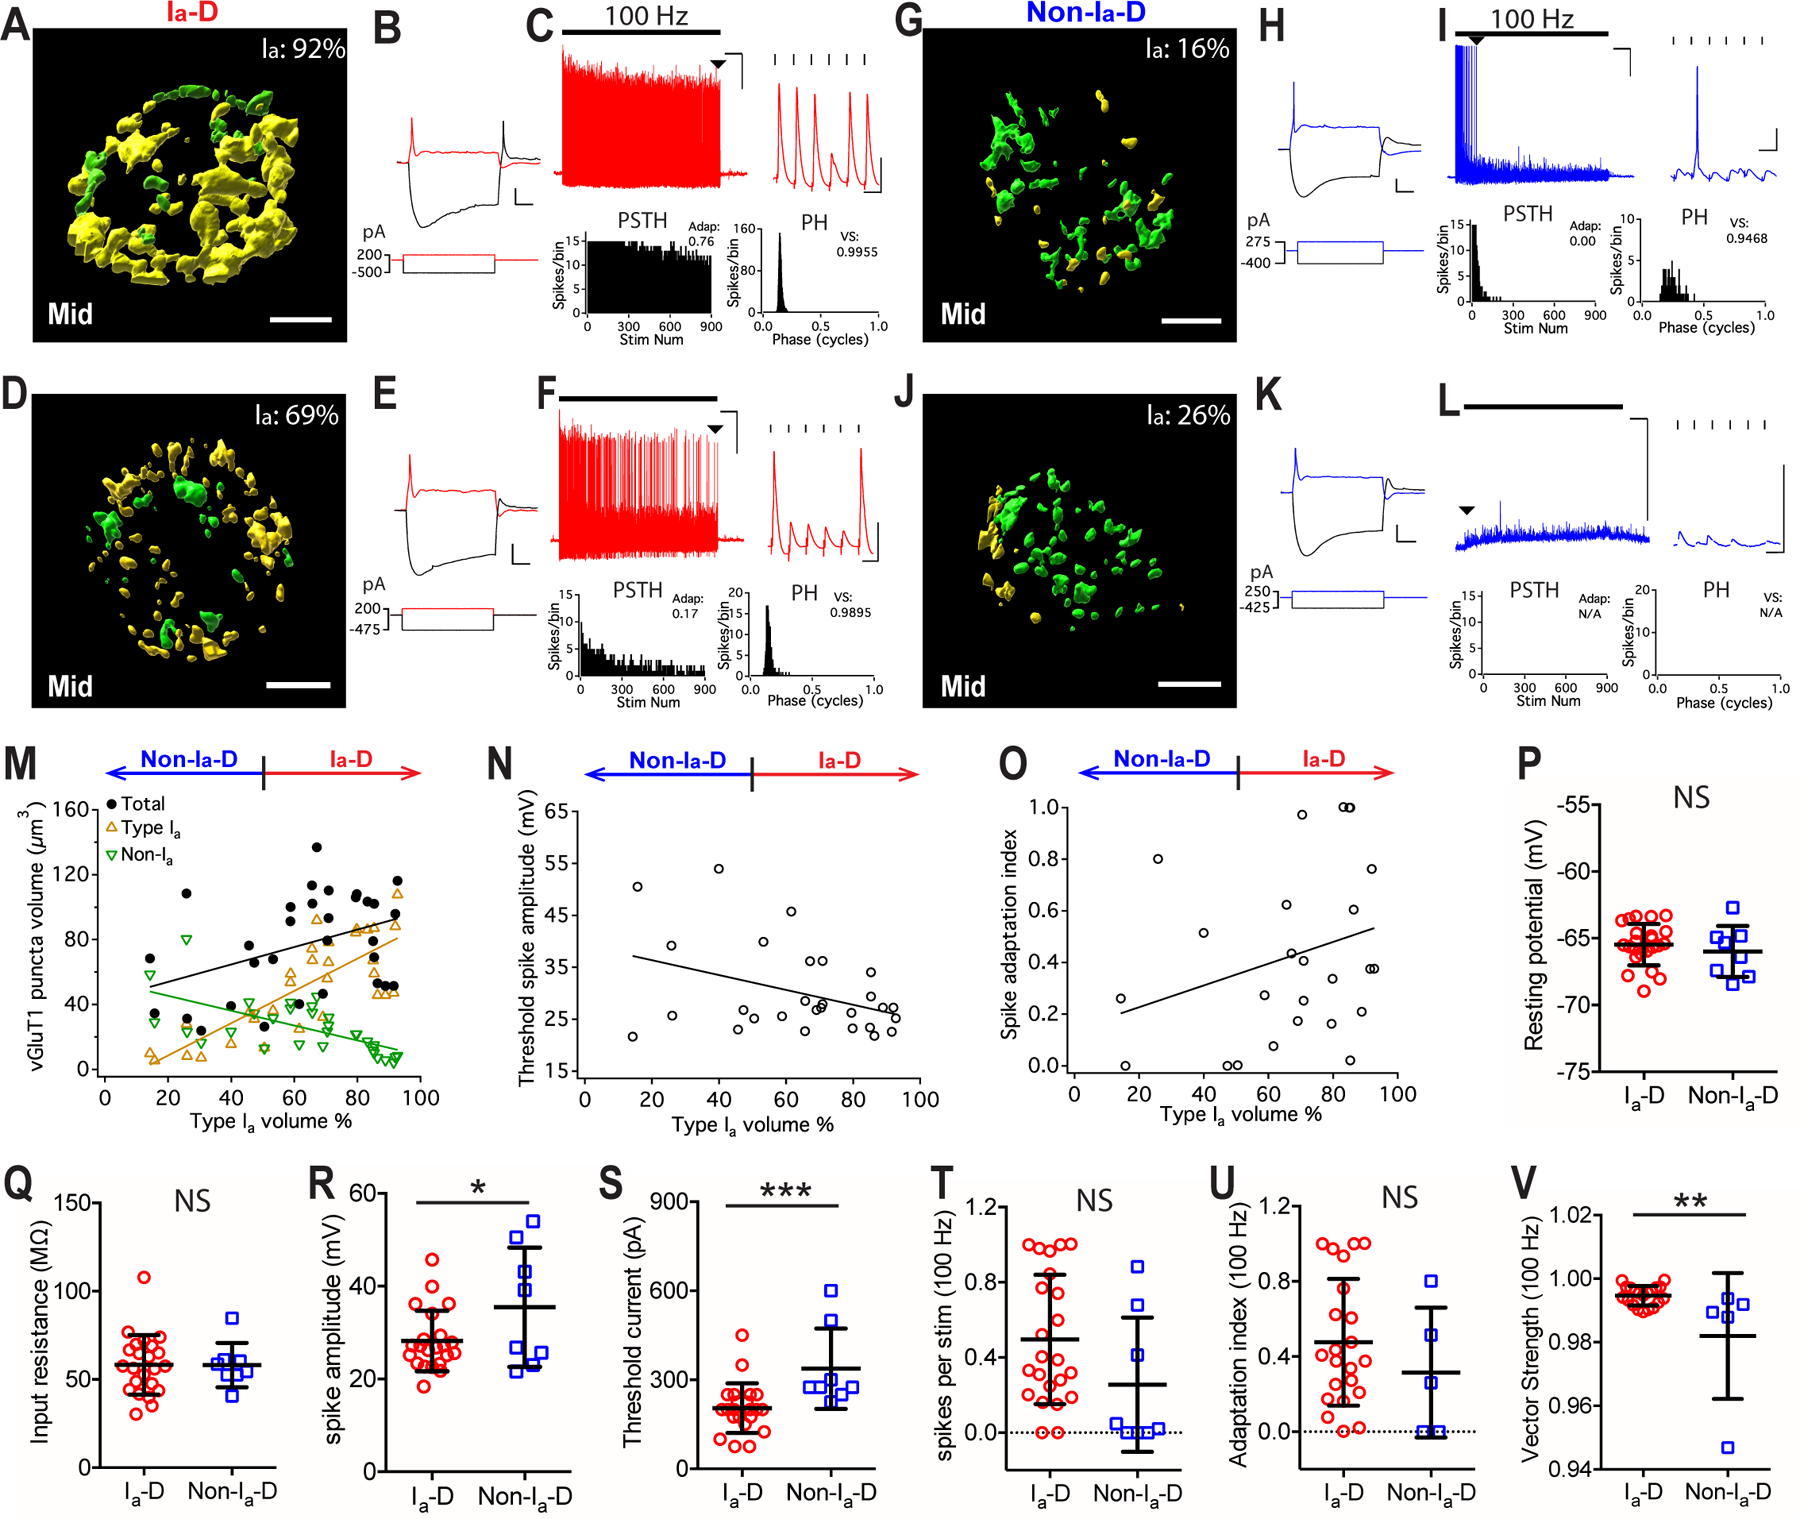
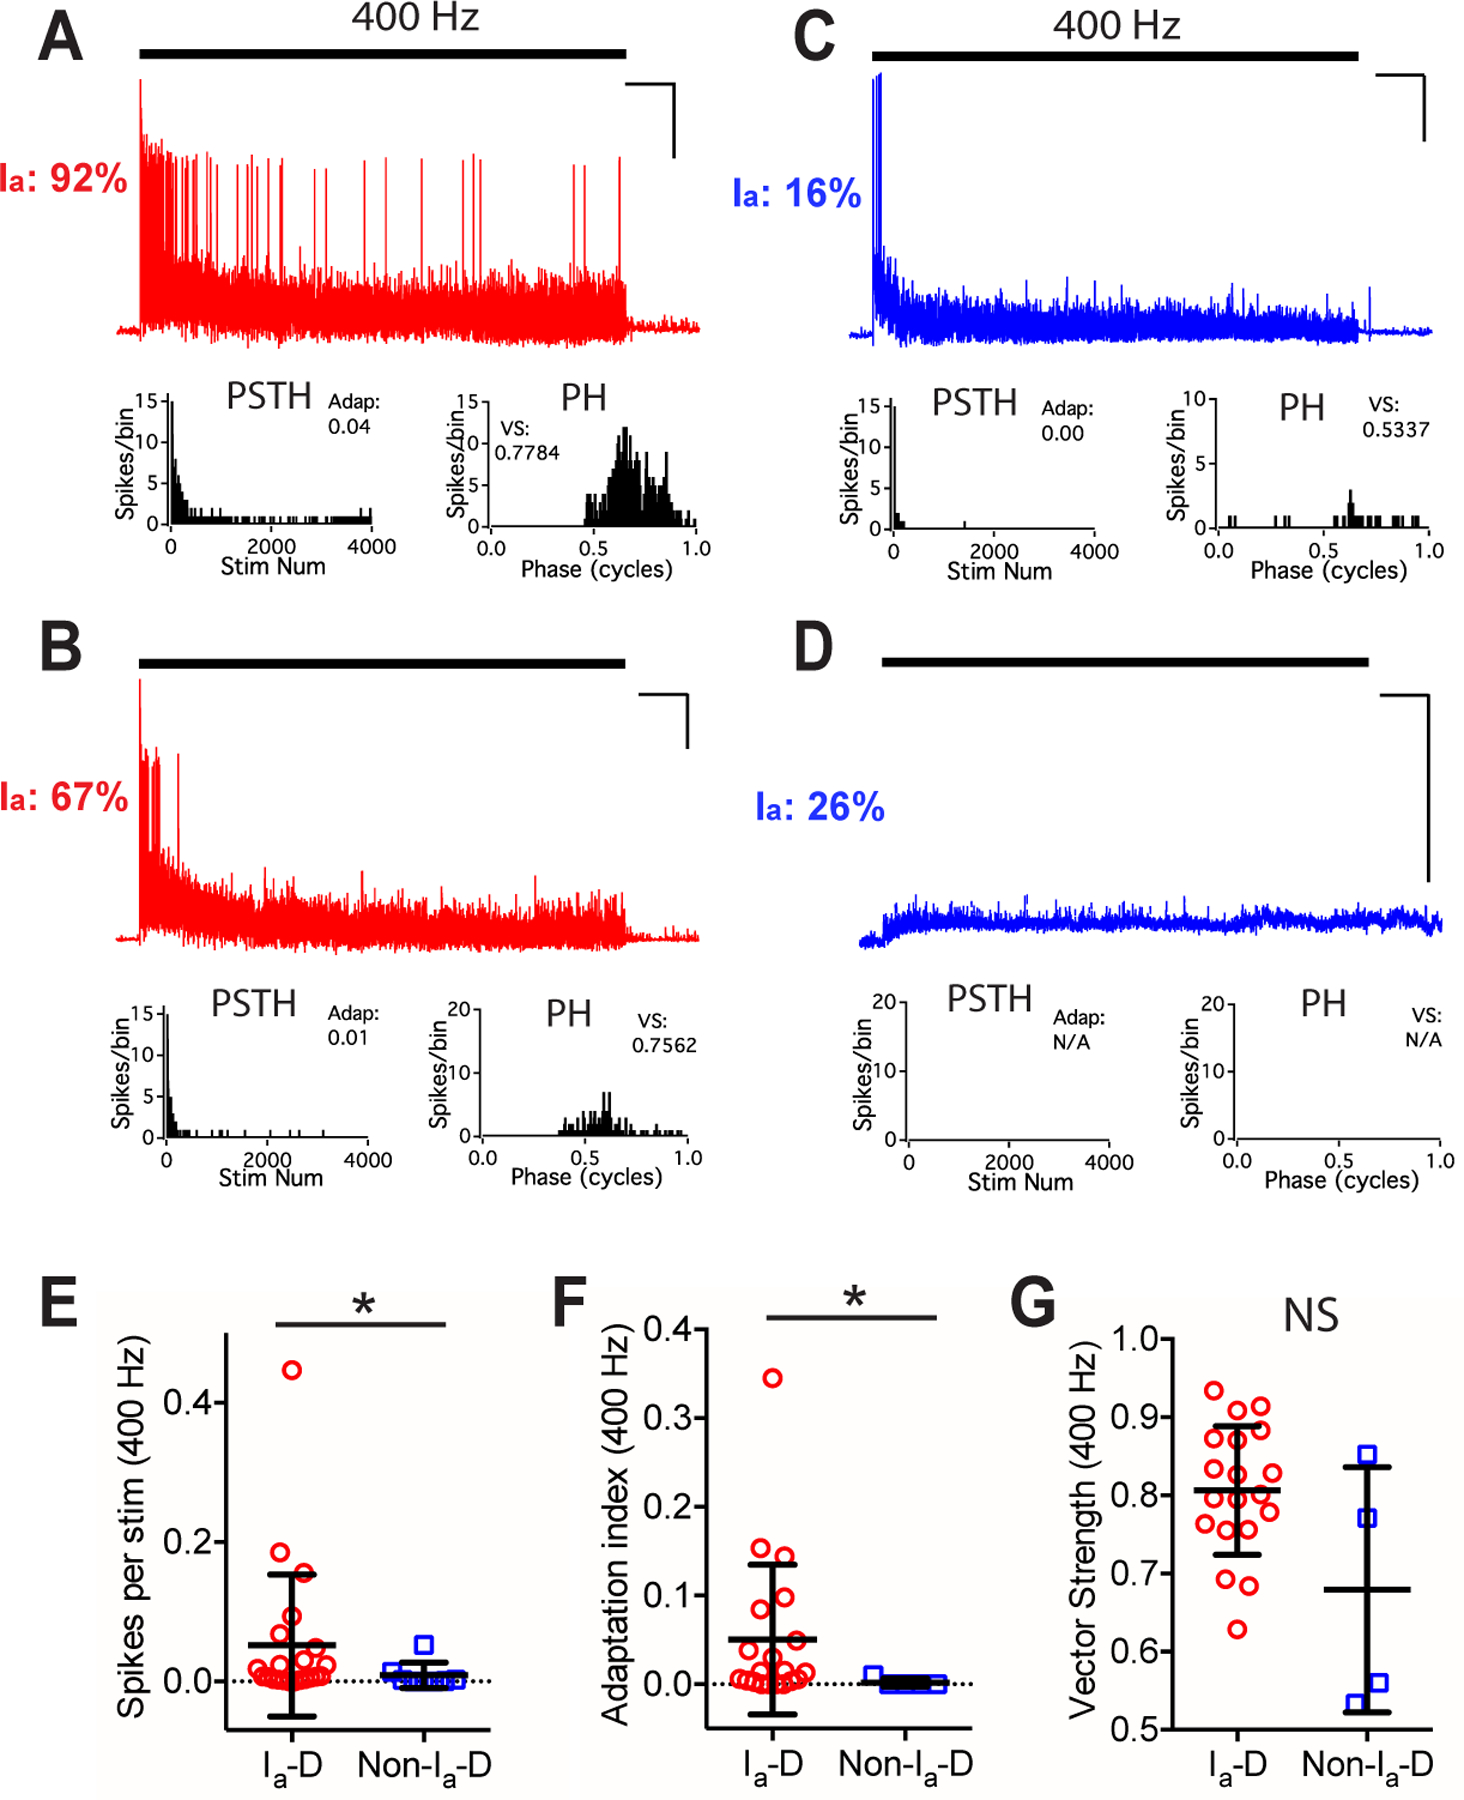
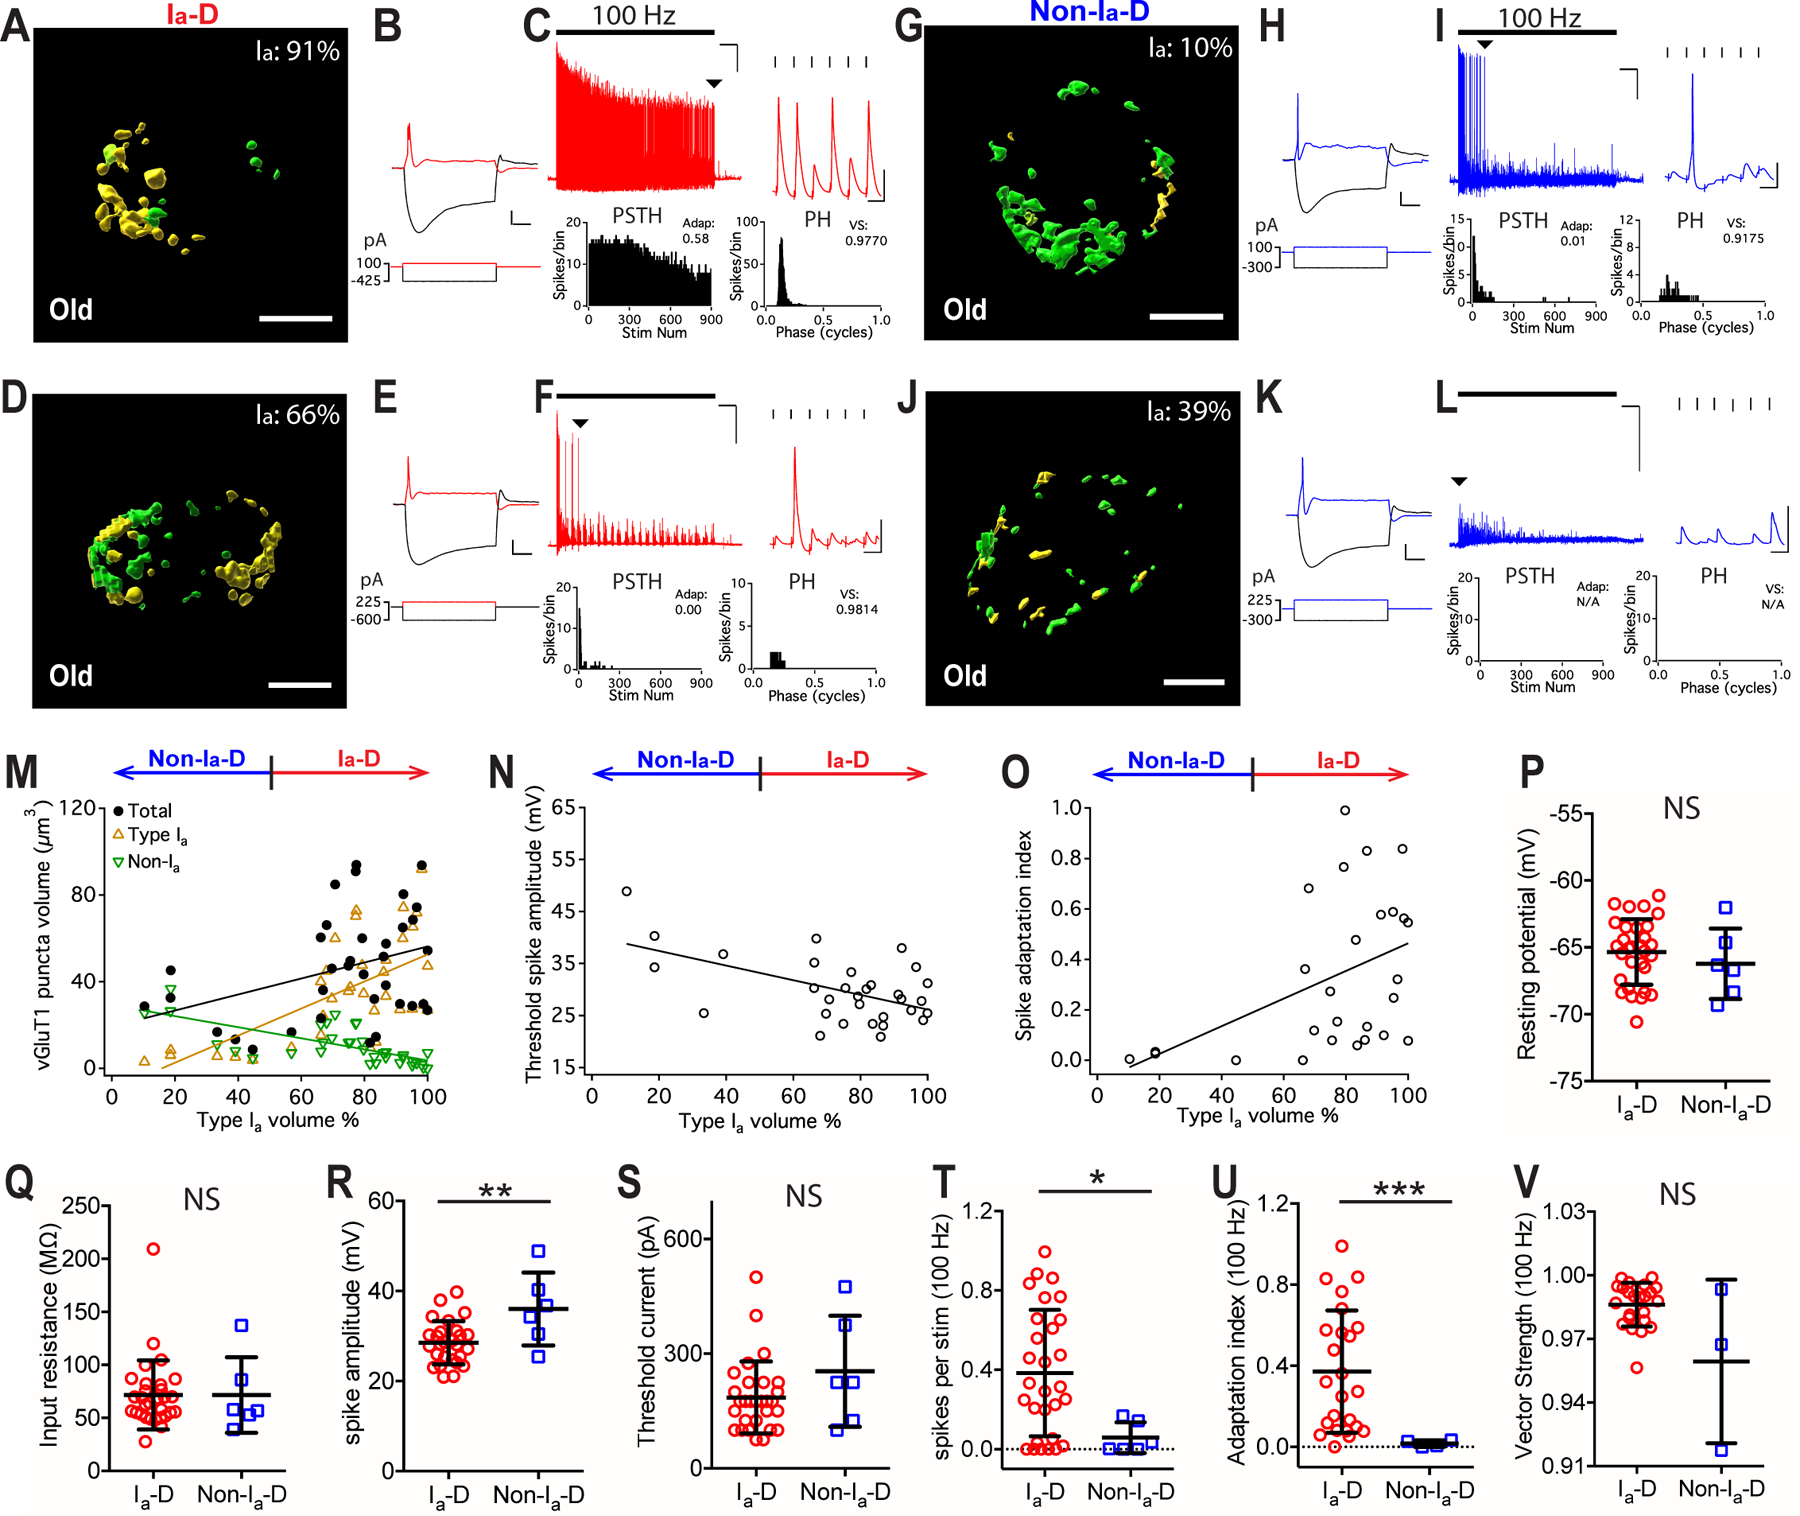
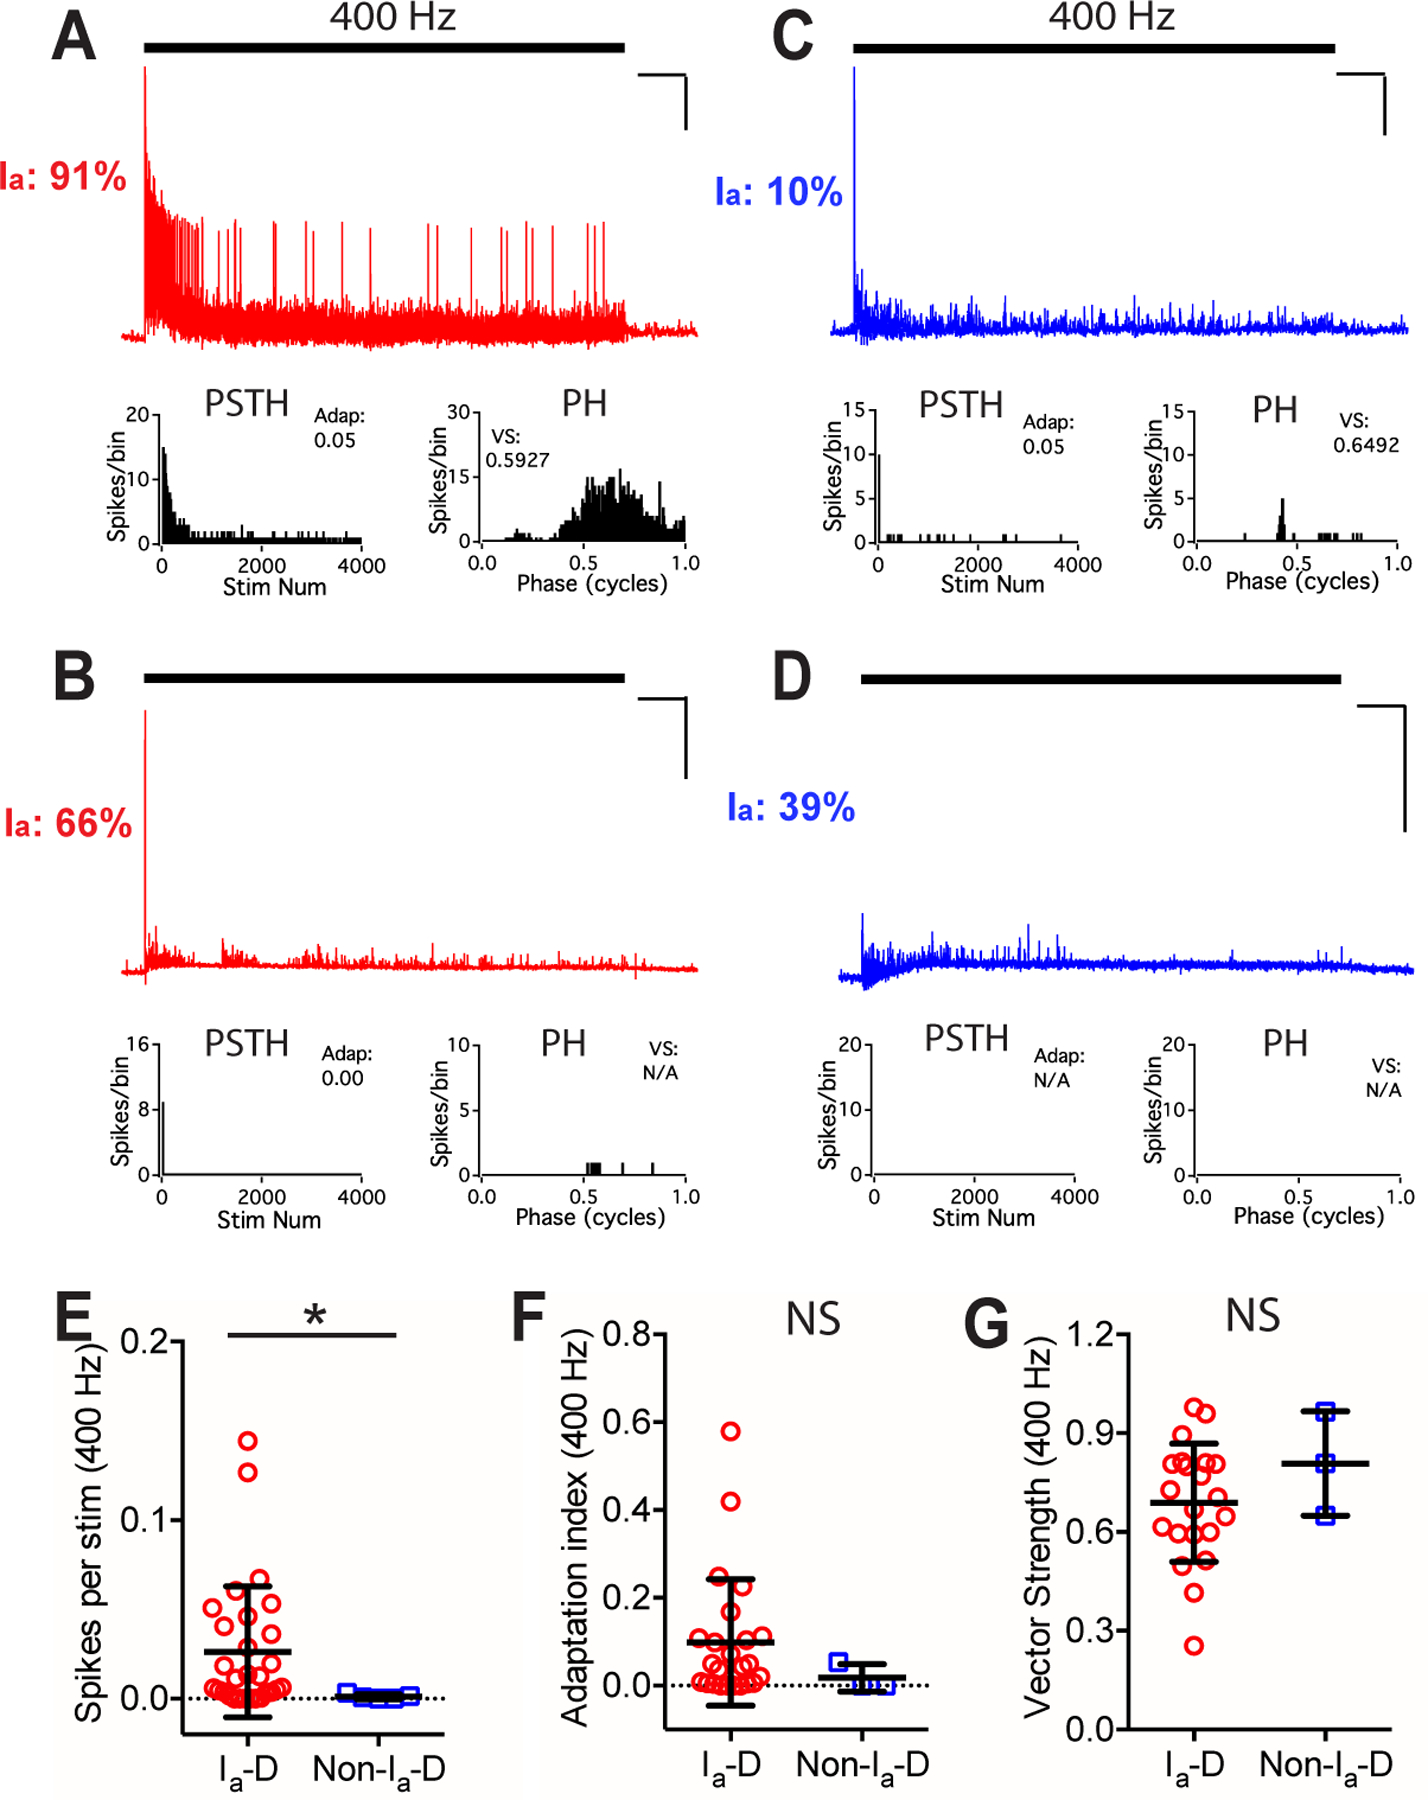
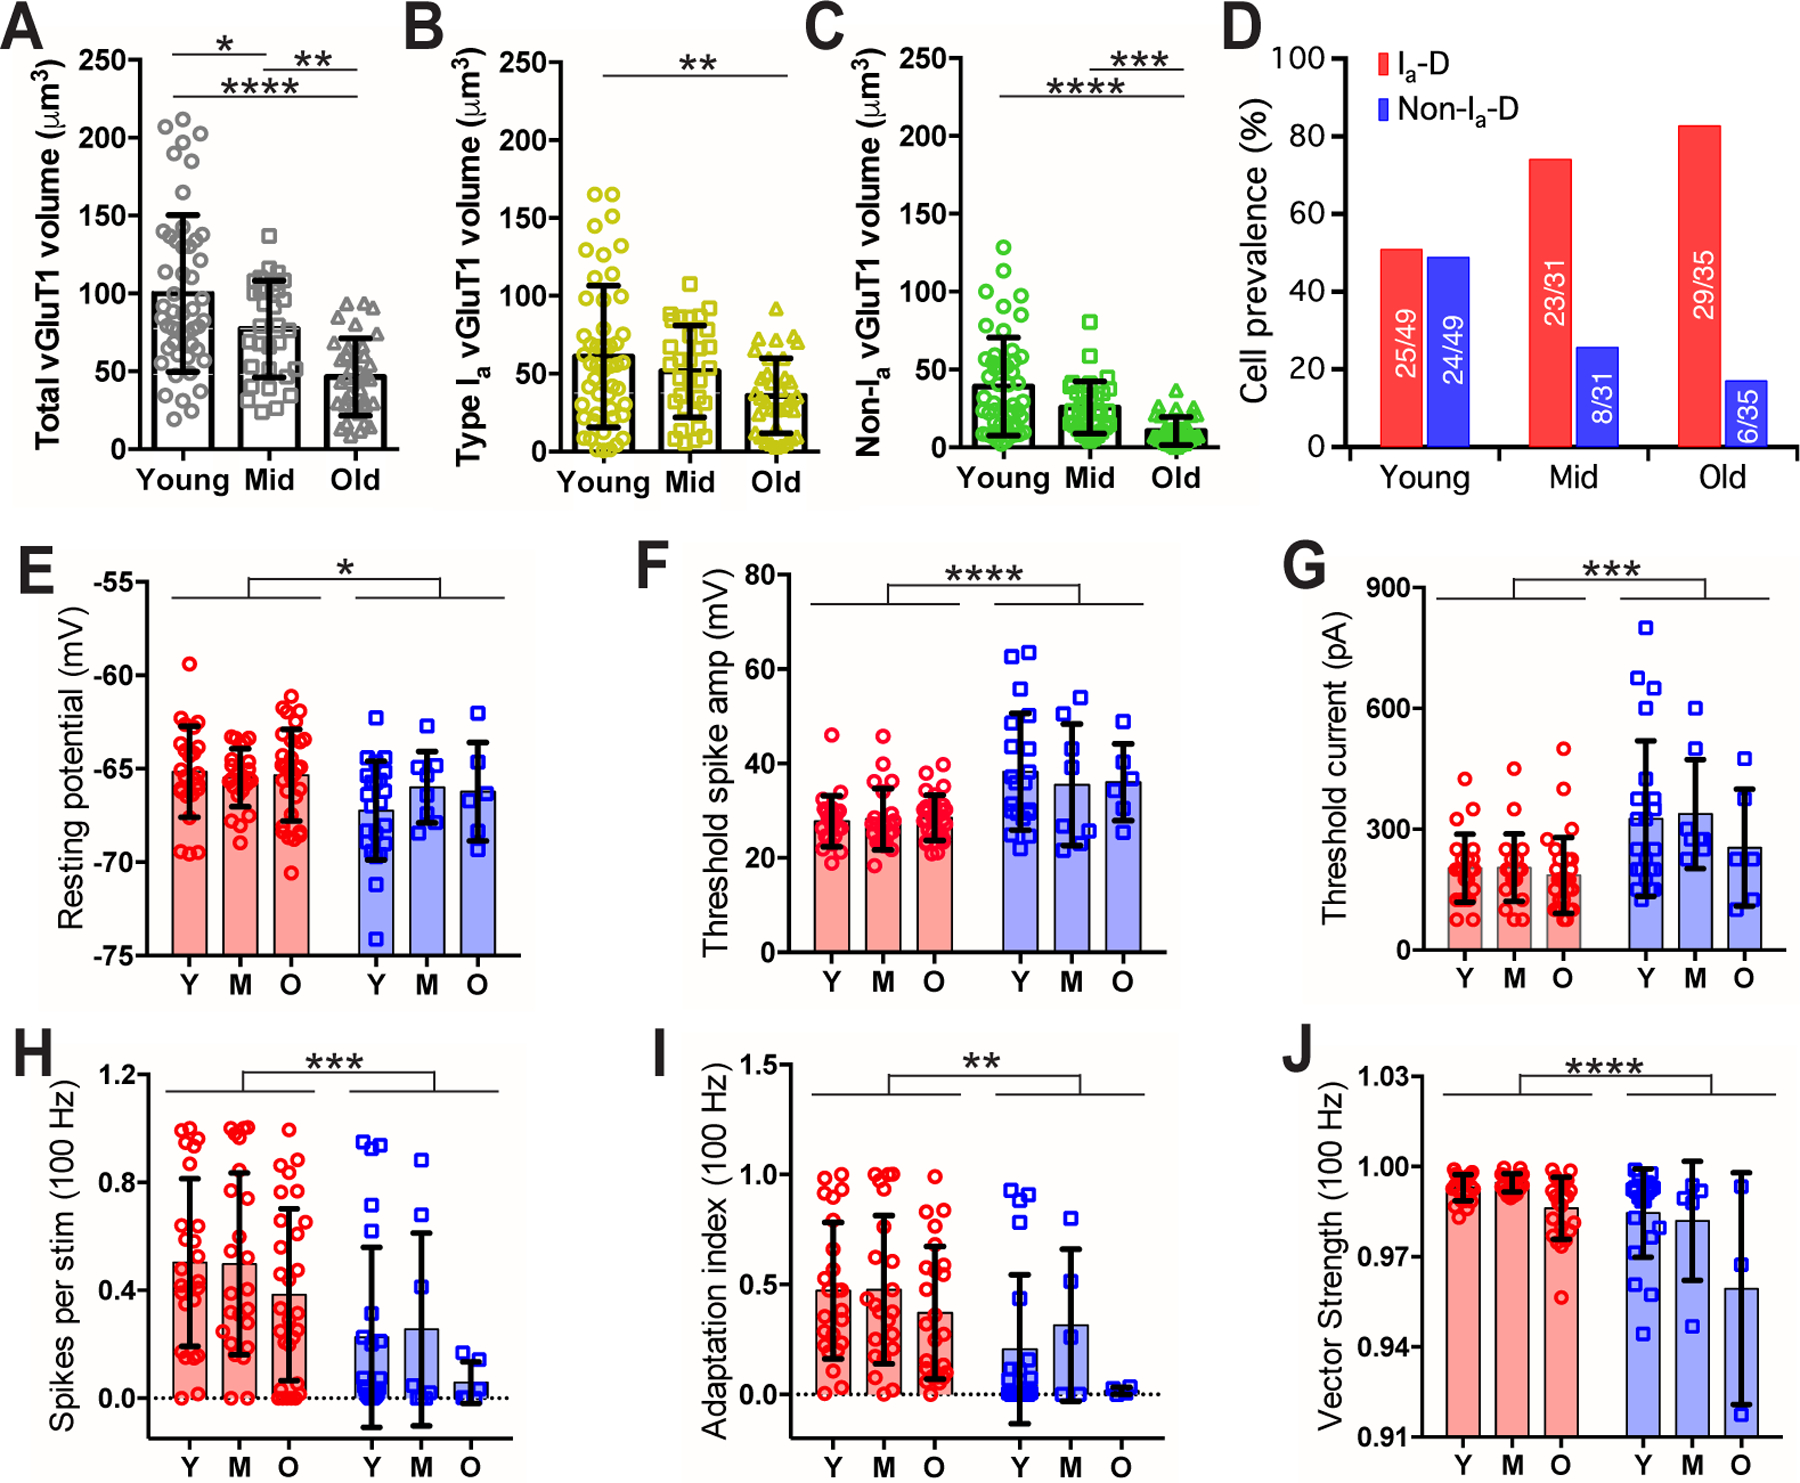
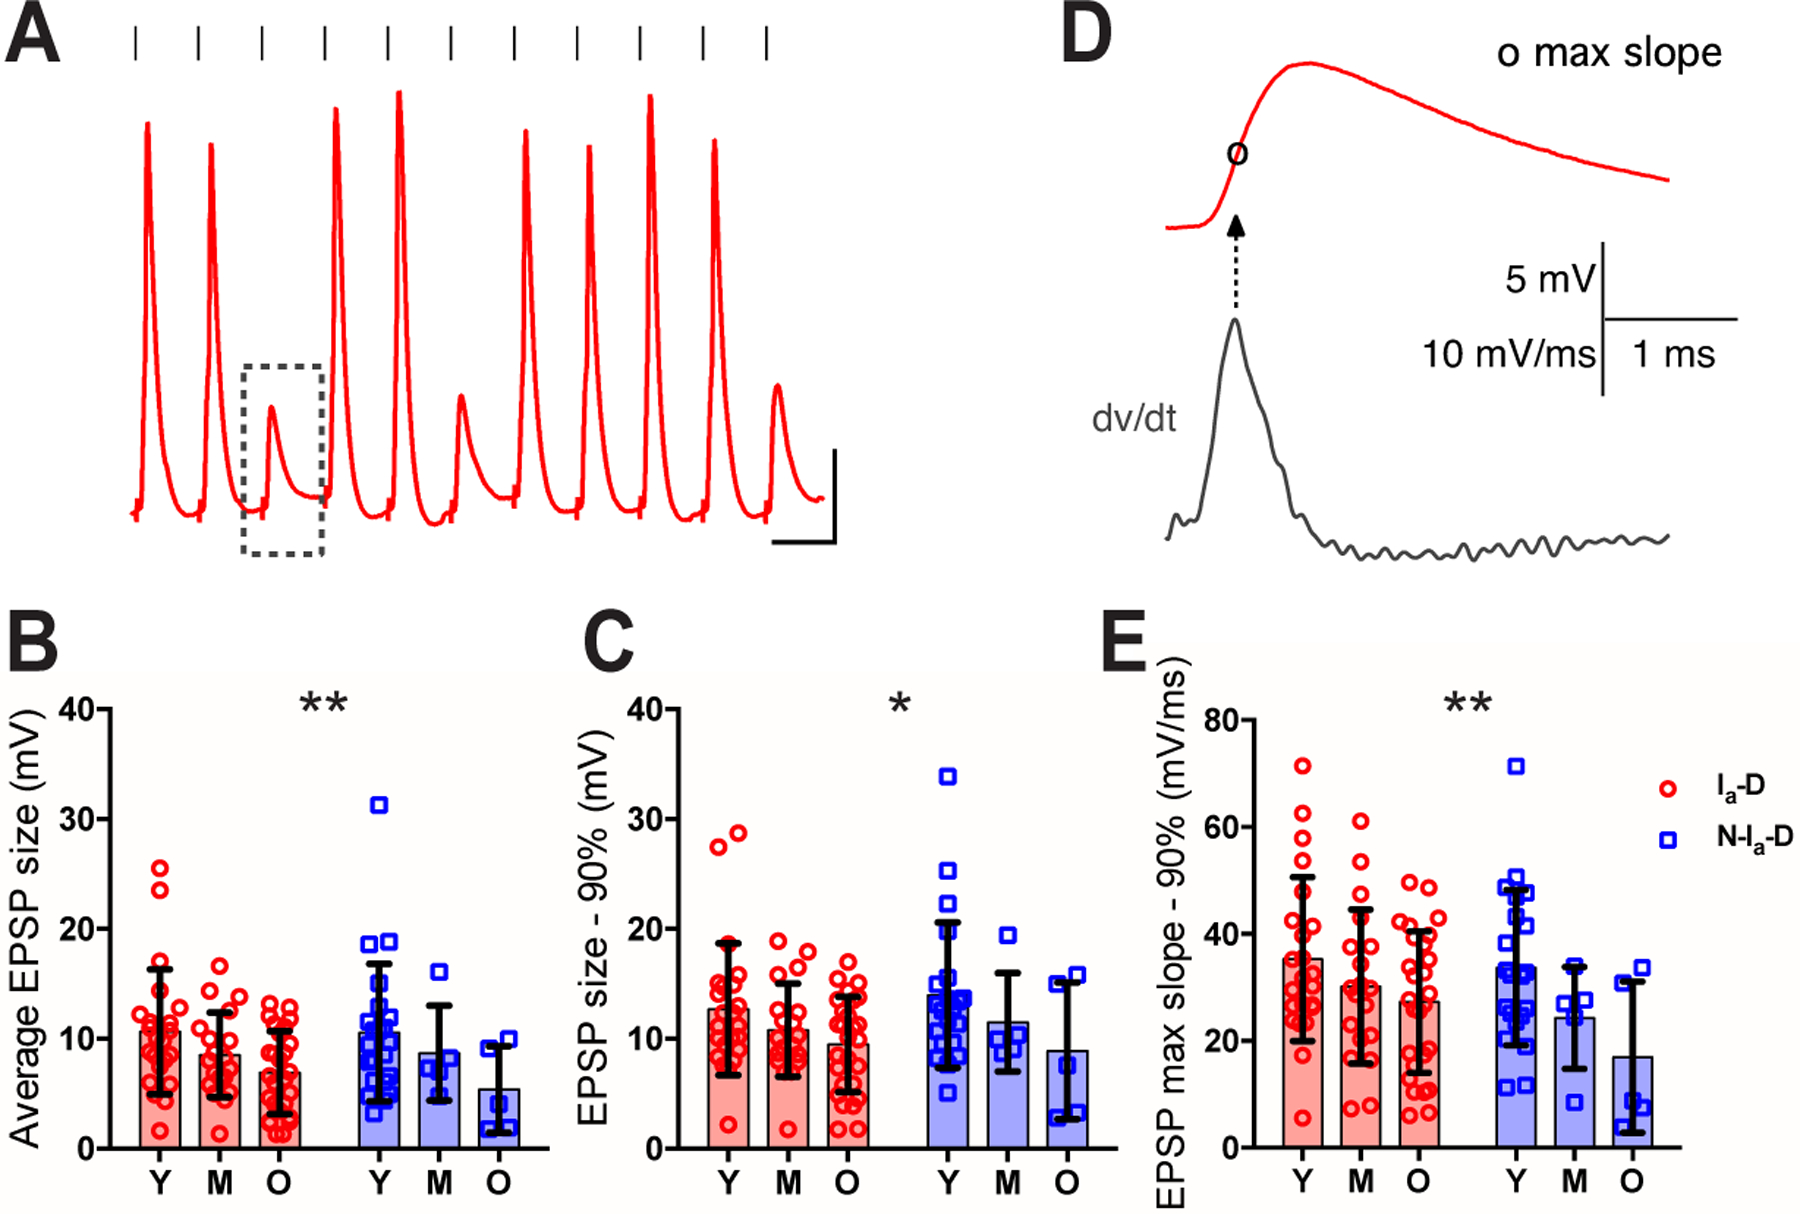
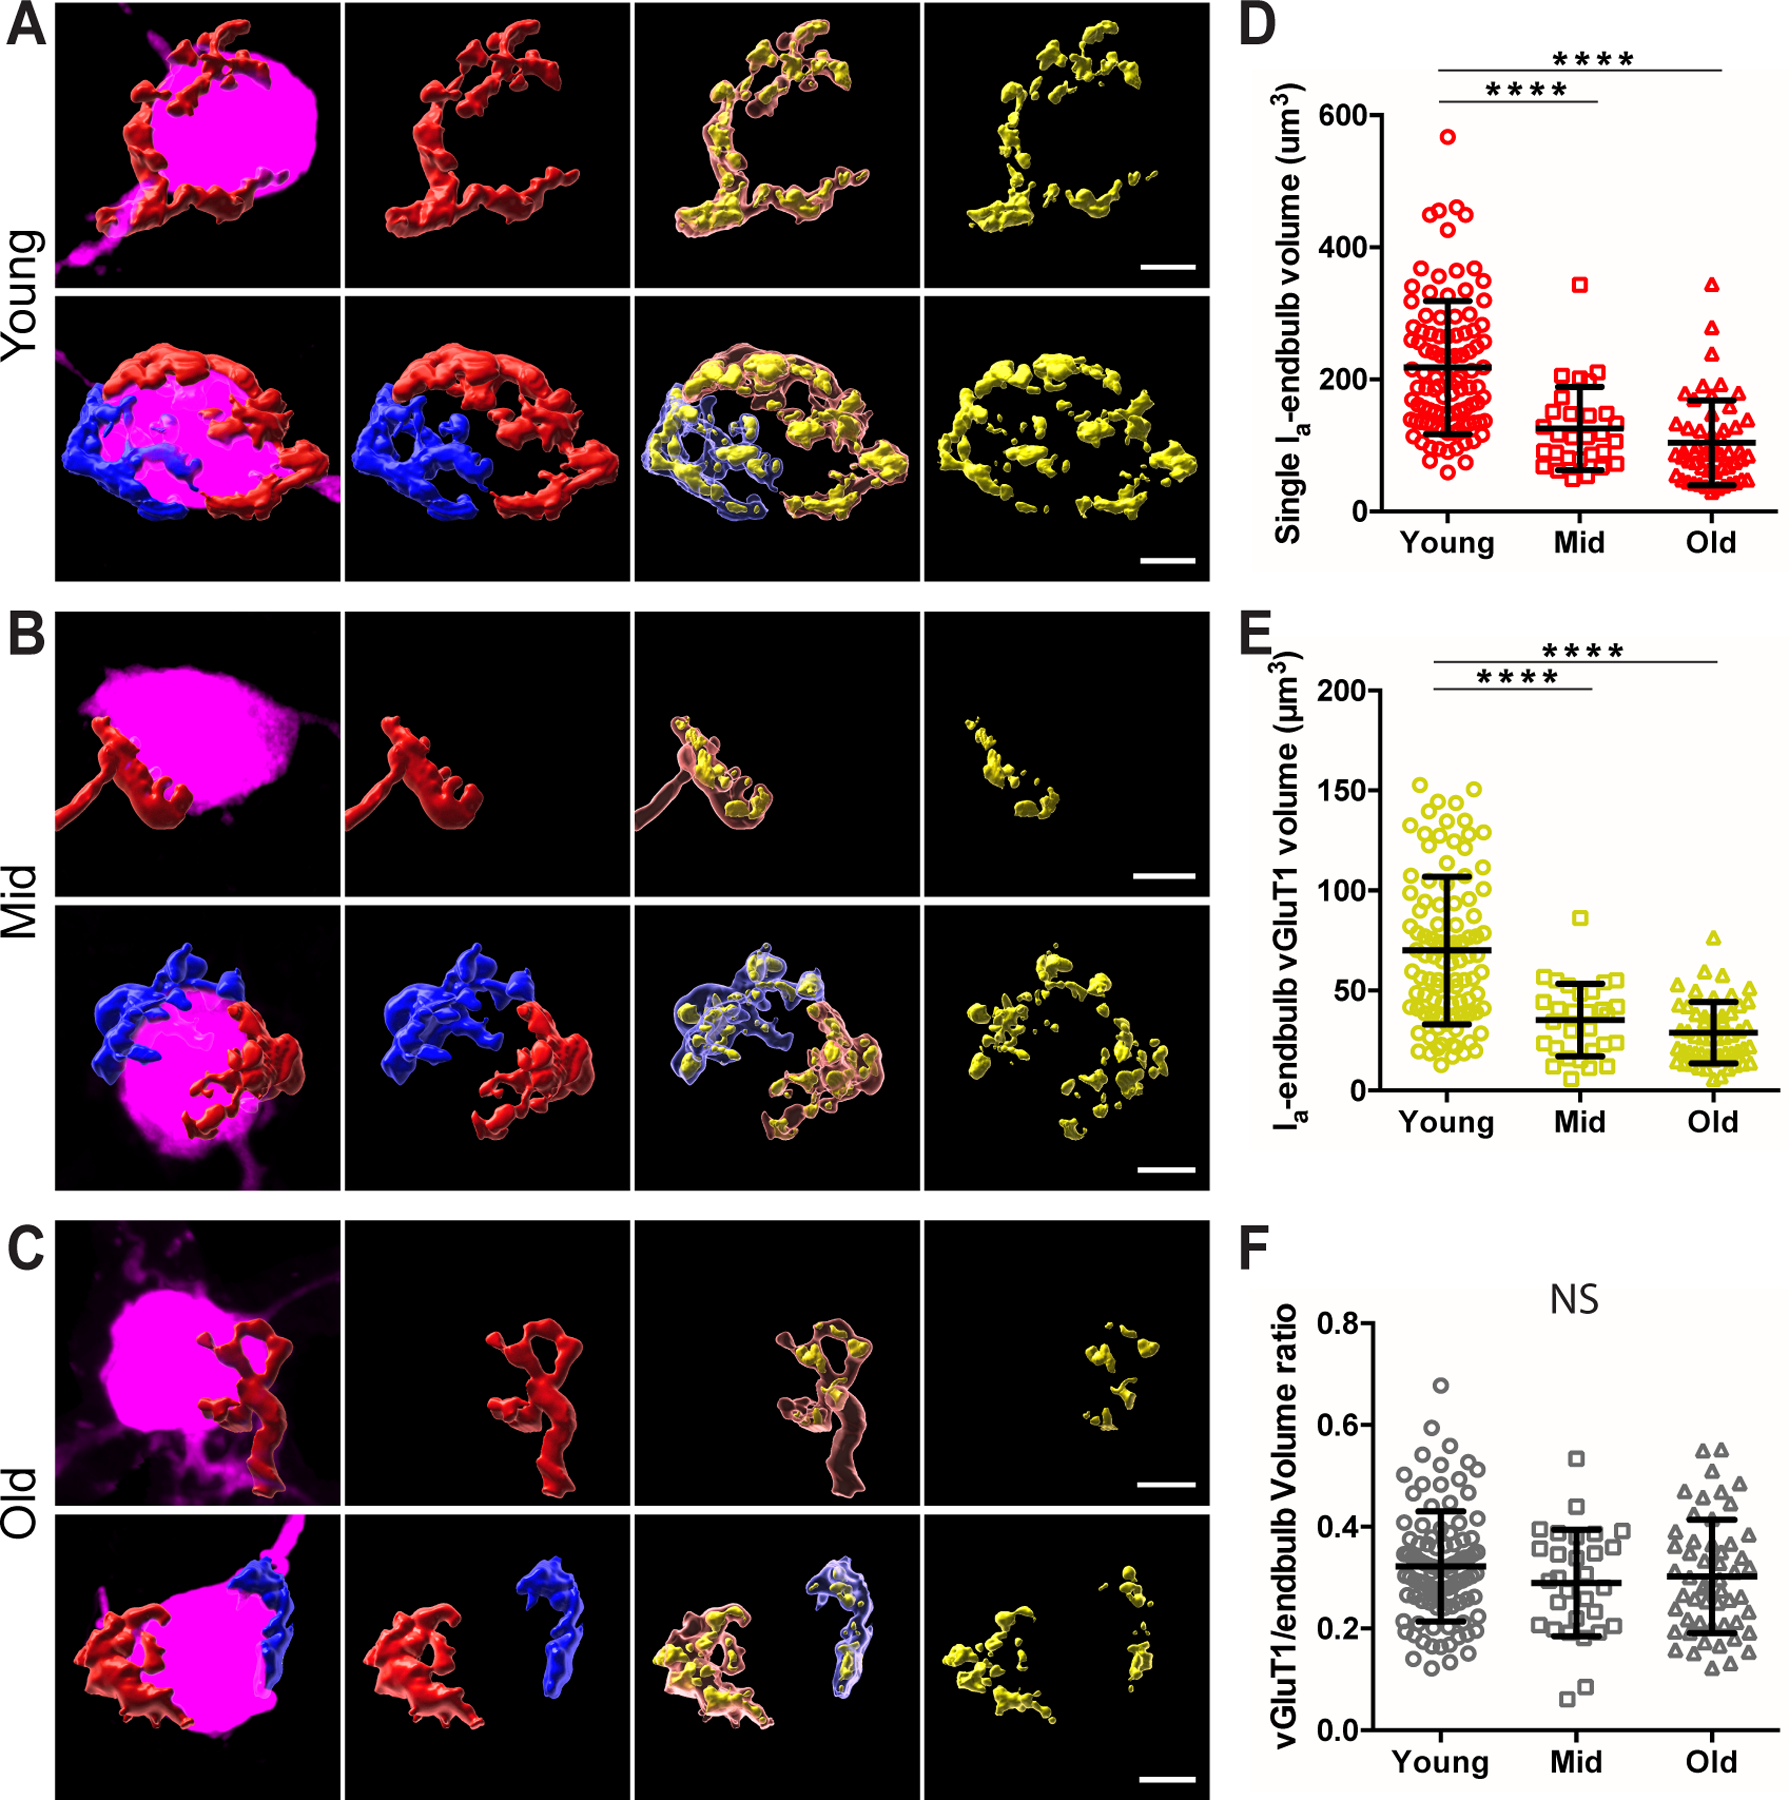
Abstract: Sound information is transmitted from the cochlea to the brain by different subtypes of spiral ganglion neurons (SGN), which show varying degrees of vulnerability under pathological conditions. Selective cochlear synaptopathy, the preferential damage of certain subtypes of SGN peripheral synapses, has been recognized as one of the main mechanisms of hearing loss. The organization and function of the auditory nerve (AN) central synapses from different subtypes of SGNs remain unclear, including how different AN synapses reassemble onto individual neurons in the cochlear nucleus, as well as how they differentially change during hearing loss. Combining immunohistochemistry with electrophysiology, we investigated the convergence pattern and subtype-specific synaptopathy of AN synapses at the endbulb of Held, as well as the response properties of their postsynaptic bushy neurons in CBA/CaJ mice of either sex under normal hearing and age-related hearing loss (ARHL). We found that calretinin-expressing (type Ia ) and non-calretinin-expressing (type Ib /Ic ) endbulbs converged along a continuum of different ratios onto individual bushy neurons with varying physiological properties. Endbulbs degenerated during ageing in parallel with ARHL. Furthermore, the degeneration was more severe in non-calretinin-expressing synapses, which correlated with a gradual decrease in bushy neuron subpopulation predominantly innervated by these inputs. These synaptic and cellular changes were profound in middle-aged mice when their hearing thresholds were still relatively normal and prior to severe ARHL. Our findings suggest that biased AN central synaptopathy and the correlated shift in cochlear nucleus neuronal composition play significant roles in weakened auditory input and altered central auditory processing during ARHL.

Keywords: age-related hearing loss; ageing; bushy neuron; cochlear nucleus; end bulb of Held; spiral ganglion neuron; synaptic physiology; synaptopathy.


Conflict of interest statement

Competing Interests:

The authors declare no competing financial interests.

Figures

Figure 1.
Figure 1.. CBA/CaJ mice show age-related hearing loss (ARHL)
(A) Example ABR waveforms from mice at different ages to clicks at different intensities. Red dots mark the positive and negative peaks of ABR wave I at 80 dB SPL. Thick traces: ABR threshold trace. Scale: 2 ms, 5 μV. (B) ABR click thresholds in 32 young, 22 middle-aged, and 43 old mice. Dunn’s multiple comparisons test: **p < 0.001; ****p < 0.0001. ABR threshold was beyond 85 dB SPL in 12 old mice and not determined. (C) Growth curves of ABR wave I amplitude in all mice. Thin lines: individual mice; thick lines: average of each age group, with error bars represent SEM.
Figure 2.
Figure 2.. Different subtypes of AN synapses converge onto individual CN neurons.
(A) Diagram of the CN and experimental setup. It depicts two endbulb of Held synapses (E1 and E2) from different AN fibers (AN1 and AN2) that innervate the target bushy neuron, which is recorded and filled with fluorescent dye (magenta). AN is activated by electric stimulation. CN: cochlear nucleus; AVCN: anteroventral CN; PVCN: posteroventral CN; DCN: dorsal CN. (B) Example responses of a bushy neuron to current step injections (top) and trains of AN stimulation at 100 Hz (bottom). Ticks mark the stimulus onset. Scale: 10 mV and 20 ms. (C) Single frame confocal images of the bushy neuron in (B) filled with Alexa Fluor 594 dye (magenta), with immunostained VGluT1 (green) and calretinin (CR; red). The bushy neuron receives a large type Ia endbulb of Held synapse (asterisk), which contains VGluT1-labeled puncta (arrow). Double-labeled puncta are shown in yellow in the merged panel (arrow). VGluT1-labeled puncta that do not overlap with CR staining are shown in green in the merged panel (arrowhead), which are from AN synapses that do not express calretinin (non-type Ia synapse). Scale: 10 μm. (D) 3D reconstruction of the bushy neuron and AN synapses in (C). Red: CR-stained type Ia endbulb of Held synapse. Scale: 10 μm, also applies to E-H. See also Supplemental Video 1. (E) same as in (D) except showing only the VGluT1-labeled puncta. Yellow (arrow): VGluT1-labeled puncta inside the calretinin-expressing type Ia synapses; green (arrowhead): puncta from non-calretinin-expressing (non-type Ia) synapses. (F) View of all VGluT1-labeled puncta from (E) without revealing the postsynaptic bushy neuron. Note that this bushy neuron received mostly type Ia synaptic inputs from the AN in terms of VGluT1-labeled puncta volume. (G) Morphology of the single type Ia endbulb of Held synapse from (D). (H) Type Ia VGluT1-labeled puncta inside the single endbulb in (G).
Figure 3.
Figure 3.. The proportion of type Ia synaptic inputs correlates with physiological properties of postsynaptic neurons in young mice.
(A-C) An example bushy neuron that received mostly type Ia synaptic inputs (Ia-dominant, or Ia-D) from the AN. (A) Reconstructed VGluT1-labeled puncta surrounding the soma of the target bushy cell (not shown) from type Ia (yellow) and non-type Ia (green) synapses. Ia%: volume proportion of the VGluT1-labeled puncta from type Ia synapses over total. Scale: 5 μm. (B) Responses of the bushy cell to current step injections. Red traces: threshold current injection (bottom) and response (top). Scale: 10 mV and 20 ms. (C) The neuron fired sustained spikes to a train of auditory nerve stimulation (black bar) at 100 Hz; scale: 10 mV and 1 s. Arrowhead: last spikes of the train expanded in the inset on the right; scale: 10 mV and 10 ms. PSTH: post-stimulus time histogram. Stim Num: stimulus number. Adap: spike adaptation index. PH: period histogram. VS: vector strength. (D-F) Another example bushy neuron with Ia-D but lower proportion of type Ia inputs. (G-I, J-L) Two example bushy neurons that received mostly non-type Ia synaptic inputs (Non-type Ia-dominant, or Non-Ia-D), and fired only transient or onset spikes to AN stimulus trains. (M) Bushy neurons with different proportion of type Ia inputs (x-axis) show correlated distribution in the total volume of VGluT1-labeled puncta (black), volume of type Ia only puncta (yellow), and volume of non-type Ia only puncta (green). Linear regression lines: black, r2 = 0.09, p = 0.039; yellow, r2 = 0.57, p < 0.0001; green, r2 = 0.38, p < 0.0001. (N) The proportion of type Ia inputs (x-axis) in bushy neurons negatively correlates with their threshold spike amplitude, as shown by example responses in B, E, H and K. Linear regression line: r2 = 0.40, p < 0.0001. (O) Bushy neurons with different proportion of type Ia inputs (x-axis) show different firing patterns to 100 Hz stimulus trains, as quantified by spike adaptation index. Linear regression line: r2 = 0.13, p = 0.015. (P-V) Comparisons between bushy neurons with Ia-D and Non-Ia-D inputs in resting potential (P), input resistance (Q), threshold spike amplitude (R), threshold current injection level that triggered the first spike (S), firing rate throughout the 100 Hz train (T), spike adaptation index (U), and vector strength of the spikes (V). Unpaired t-test or Mann-Whitney test: NS, p > 0.05; *p < 0.05; **p < 0.01; ***p < 0.001.
Figure 4.
Figure 4.. Bushy neurons with different convergence of AN synaptic inputs show different firing patterns to trains of AN stimulation at 400 Hz in young mice.
(A) The same example bushy neuron in Fig. 3A fired sustained spikes to trains of AN stimulation at 400 Hz. Scale: 10 mV and 1 s. (B-D) Responses of bushy neurons in Fig. 3D, G, and J to AN stimulation at 400 Hz. Vector strength of the cell in D was not calculated due to insufficient number of spikes. (E-G) Comparisons between bushy neurons with Ia-D inputs and Non-Ia-D inputs to 400 Hz AN stimulus trains in firing rate (E), spike adaptation index (F), and vector strength (G). Unpaired t-test or Mann Whitney test: NS, p > 0.05; ****p < 0.0001.
Figure 5.
Figure 5.. Convergence of different AN synapses and the response properties of postsynaptic bushy neurons in middle-aged mice
(A-C) Example bushy neuron with Ia-D inputs (Ia: 92%). (A) Reconstructed VGluT1-labeled puncta from type Ia (yellow) and non-type Ia (green) synapses. Scale: 5 μm. (B) Responses of the bushy cell to current step injections. Scale: 10 mV and 20 ms. (C) The neuron fired sustained spikes to a train of auditory nerve stimulation at 100 Hz; scale: 10 mV and 1 s. Arrowhead: last spikes of the train expanded in the inset on the right; scale: 10 mV and 10 ms. (D-F) Example bushy neuron with Ia-D but lower proportion of type Ia inputs (Ia: 69%). (G-I, J-L) Two example bushy neurons that received Non-Ia-D inputs, and fired only transient spikes or failed to fire any spike to AN stimulus trains. (M) Bushy neurons with different proportion of type Ia inputs show correlated distribution in the total volume of VGluT1-labeled puncta (black), volume of type Ia only puncta (yellow), and volume of non-type Ia only puncta (green). Linear regression lines: black, r2 = 0.16, p = 0.025; yellow, r2 = 0.62, p < 0.0001; green, r2 = 0.40, p = 0.0001. (N) The proportion of type Ia inputs in bushy neurons negatively correlates with their threshold spike amplitude. Linear regression line: r2 = 0.15, p = 0.043. (O) Spike adaptation index from 100 Hz trains in bushy neurons with different proportion of type Ia inputs. Linear regression line: r2 = 0.08, p = 0.160. (P-V) Comparisons between bushy neurons from middle-aged mice with Ia-D and Non-Ia-D inputs in resting potential (P), input resistance (Q), threshold spike amplitude (R), threshold current level (S), firing rate throughout the 100 Hz train (T), spike adaptation index (U), and vector strength of the spikes (V). Unpaired t-test or Mann-Whitney test: NS, p > 0.05; *p < 0.05; **p < 0.01; ***p < 0.001.
Figure 6.
Figure 6.. Bushy neurons in middle-aged mice show different firing properties to trains of AN stimulation at 400 Hz.
(A-D) Responses of four example bushy neurons to trains of AN stimulation at 400 Hz. Scale: 10 mV and 1 s. No spike was evoked in the cell in D. (E-G) Comparisons between bushy neurons with Ia-D and Non-Ia-D inputs to 400 Hz AN stimulus trains in firing rate (E), spike adaptation index (F), and vector strength (G). Mann Whitney test: NS, p > 0.05; *p < 0.05.
Figure 7.
Figure 7.. Convergence of different AN synapses and the response properties of postsynaptic bushy neurons in old mice
(A-C) Example bushy neuron with Ia-D inputs (Ia: 91%). (A) Reconstructed VGluT1-labeled puncta from type Ia (yellow) and non-type Ia (green) synapses. Scale: 5 μm. (B) Responses of the bushy cell to current step injections. Scale: 10 mV and 20 ms. (C) The neuron fired sustained spikes to a train of auditory nerve stimulation at 100 Hz; scale: 10 mV and 1 s. Arrowhead: last spikes of the train expanded in the inset on the right; scale: 10 mV and 10 ms. (D-F) Example bushy neuron with Ia-D but lower proportion of type Ia inputs (Ia: 66%). (G-I, J-L) Two example bushy neurons that received Non-Ia-D inputs (Ia: 10% and 39%). (M) Bushy neurons with different proportion of type Ia inputs show correlated distribution in the total volume of VGluT1-labeled puncta (black), volume of type Ia only puncta (yellow), and volume of non-type Ia only puncta (green). Linear regression lines: black, r2 = 0.13, p = 0.033; yellow, r2 = 0.40, p < 0.0001; green, r2 = 0.49, p < 0.0001. (N) Proportion of type Ia inputs (x-axis) in bushy neurons negatively correlates with their threshold spike amplitude. Linear regression line: r2 = 0.30, p = 0.001. (O) Spike adaptation index from 100 Hz trains in bushy neurons with different proportion of type Ia inputs (x-axis). Linear regression line: r2 = 0.20, p = 0.019. (P-V) Comparisons between bushy neurons from old mice with Ia-D and Non-Ia-D inputs in resting potential (P), input resistance (Q), threshold spike amplitude (R), threshold current level (S), firing rate throughout the 100 Hz trains (T), spike adaptation index (U), and vector strength of the spikes (V). Unpaired t-test or Mann-Whitney test: NS, p > 0.05; *p < 0.05; ***p < 0.001.
Figure 8.
Figure 8.. Bushy neurons in old mice show different firing properties to trains of AN stimulation at 400 Hz.
(A-D) Responses of four example bushy neurons to trains of AN stimulation at 400 Hz. Scale: 10 mV and 1 s. No spike was evoked in the cell in D. (E-G) Comparisons between bushy neurons with Ia-D and Non-Ia-D inputs to 400 Hz AN stimulus trains in firing rate (E), spike adaptation index (F), and vector strength (G). Mann Whitney test: NS, p > 0.05; *p < 0.05.
Figure 9.
Figure 9.. AN central synaptopathy is more severe in non-type Ia synapses and associated with altered composition of bushy neuron population during ARHL
(A-C) Comparisons of the total volume (A), type Ia only volume (B) and non-type Ia only volume (C) of VGluT1-labeled puncta onto bushy neurons from three age groups of mice. Tukey’s or Dunn’s multiple comparison tests: *p < 0.05; **p < 0.01; ***p < 0.001; ****p < 0.0001. (D) Prevalence of bushy neurons that receive Ia-D and Non-Ia-D synaptic inputs among three age groups. Numbers mark the cell count of each type over total. (E-J) Comparisons of bushy neurons among three age groups in resting potential (E), threshold spike amplitude (F), threshold current injection that triggered the first spike (G), firing rate to 100 Hz stimulation (H), spike adaptation index (I), and vector strength of the spikes throughout the 100 Hz trains (J). Two-way ANOVA revealed significant cell type effect (Ia-D vs. Non-Ia-D) in all panels (E-J): **p < 0.01; ***p < 0.001; ****p < 0.0001. Age effect was only significant in vector strength (J): p < 0.001.
Figure 10.
Figure 10.. Evoked EPSPs decrease in amplitude with age during ARHL.
(A) Example response of a bushy neuron to show AN stimulation evoked spikes and EPSPs. Dashed rectangle: an example EPSP that failed to trigger any spike. Scale: 10 mV and 10 ms. (B-C) Comparisons of bushy neurons among three age groups in average amplitude of EPSPs that failed to trigger spikes (B), and EPSP amplitude at 90th percentile (C). (D) Maximum rising slope of the example EPSP from (A), calculated as the peak of the first derivative (dv/dt) during the rising phase. (E) Comparison of EPSP maximum slope at 90th percentile. Two-way ANOVA revealed significant age effect (Ia-D vs. Non-Ia-D) in B, C and E: *p < 0.05; **p < 0.01.
Figure 11.
Figure 11.. Synaptopathy of individual type Ia endbulb of Held synapses during ARHL.
(A) Representative morphology of individual type Ia endbulb of Held synapses in young mice. Panels from left to right: filled neurons (magenta) with reconstructed individual type Ia endbulbs, type Ia endbulbs alone, type Ia endbulbs (semi-transparent) with enclosed VGluT1-labled puncta (yellow), and VGluT1-labeled puncta alone. Top panels: example bushy neuron with only one type Ia endbulb of Held synapse. Bottom panels: example neuron with two type Ia endbulb of Held synapses, which are shown in red and blue respectively. (B) Representative morphology of individual type Ia endbulb of Held synapses in middle-aged mice. (C) Representative morphology of individual type Ia endbulb of Held synapses in old mice. Scales in A-C: 5 μm. (D-F) Comparisons of individual type Ia endbulb volume (D), enclosed VGluT1-puncta volume (E), and VGluT1/endbulb volume ratio (F) among three age groups. Dunn’s multiple comparison test: NS, p > 0.05; ****p < 0.0001.

Comment in

Similar articles

Cited by

References

    1. Anderson S, Parbery-Clark A, White-Schwoch T & Kraus N. (2012). Aging affects neural precision of speech encoding. J Neurosci 32, 14156–14164. - PMC - PubMed
    1. Atcherson SR, Nagaraj NK, Kennett SE & Levisee M. (2015). Overview of Central Auditory Processing Deficits in Older Adults. Semin Hear 36, 150–161. - PMC - PubMed
    1. Buunen TJ & Rhode WS. (1978). Responses of fibers in the cat’s auditory nerve to the cubic difference tone. The Journal of the Acoustical Society of America 64, 772–781. - PubMed
    1. Cant NB & Benson CG. (2003). Parallel auditory pathways: projection patterns of the different neuronal populations in the dorsal and ventral cochlear nuclei. Brain research bulletin 60, 457–474. - PubMed
    1. Cant NB & Morest DK. (1979). Organization of the neurons in the anterior division of the anteroventral cochlear nucleus of the cat. Light-microscopic observations. Neuroscience 4, 1909–1923. - PubMed

Publication types