Light Chain Mutation Effects on the Dynamics of Thrombin
- PMID: 33450154
- PMCID: PMC8990444
- DOI: 10.1021/acs.jcim.0c01303
Light Chain Mutation Effects on the Dynamics of Thrombin
Abstract
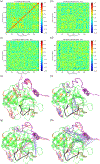
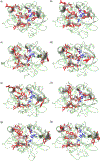
Thrombin plays an important role in the process of hemostasis and blood coagulation. Studies in thrombin can help us find ways to treat cancer because thrombin is able to reduce the characteristic hypercoagulability of cancer. Thrombin is composed of two chains, the light chain and the heavy chain. The function of the heavy chain has been largely explored, while the function of the light chain was obscured until several disease-associated mutations in the light chain come to light. In this study, we want to explore the dynamic and conformation effects of mutations on the light chain further to determine possible associations between mutation, conformational changes, and disease. The study, which is a follow-up for our studies on apo thrombin and the mutant, ΔK9, mainly focuses on the mutants E8K and R4A. E8K is a disease-associated mutation, and R4A is used to study the role of Arg4, which is suggested experimentally to play a critical role for thrombin's catalytic activities. We performed five all-atom one microsecond-scale molecular dynamics (MD) simulations for both E8K and R4A, and quantified the changes in the conformational ensemble of the mutants. From the root-mean-square fluctuations (RMSF) for the α-carbons, we find that the atomic fluctuations change in the mutants in the 60s loop and γ loop. The correlation coefficients for the α-carbons indicate that the correlation relation for atom-pairs in the protein is also impacted. The clustering analysis and the principal component analysis (PCA) consistently tell us that the catalytic pocket and the regulatory loops are destabilized by the mutations. We also find that there are two binding modes for Na+ by clustering the vector difference between the Na+ ions and the 220s loop. After further analysis, we find that there is a relation between the Na+ binding and the rigidification of the γ loop, which may shed light on the mysterious role of the γ loop in thrombin.
Figures


Similar articles
-
Simulations suggest double sodium binding induces unexpected conformational changes in thrombin.J Mol Model. 2022 Apr 13;28(5):120. doi: 10.1007/s00894-022-05076-0. J Mol Model. 2022. PMID: 35419655 Free PMC article.
-
Probing light chain mutation effects on thrombin via molecular dynamics simulations and machine learning.J Biomol Struct Dyn. 2019 Mar;37(4):982-999. doi: 10.1080/07391102.2018.1445032. Epub 2018 Mar 2. J Biomol Struct Dyn. 2019. PMID: 29471734 Free PMC article.
-
Mechanistic insights into thrombin's switch between "slow" and "fast" forms.Phys Chem Chem Phys. 2017 Sep 20;19(36):24522-24533. doi: 10.1039/c7cp03671j. Phys Chem Chem Phys. 2017. PMID: 28849814 Free PMC article.
-
Thrombin - A Molecular Dynamics Perspective.Mini Rev Med Chem. 2024;24(11):1112-1124. doi: 10.2174/1389557523666230821102655. Mini Rev Med Chem. 2024. PMID: 37605420 Review.
-
[Sodium ions as the effector of catalytic action of alpha-thrombin].Ukr Biokhim Zh (1999). 2007 Jan-Feb;79(1):5-21. Ukr Biokhim Zh (1999). 2007. PMID: 18030731 Review. Russian.
Cited by
-
Exosite Binding in Thrombin: A Global Structural/Dynamic Overview of Complexes with Aptamers and Other Ligands.Int J Mol Sci. 2021 Oct 6;22(19):10803. doi: 10.3390/ijms221910803. Int J Mol Sci. 2021. PMID: 34639143 Free PMC article. Review.
-
The Light Chain Allosterically Enhances the Protease Activity of Murine Urokinase-Type Plasminogen Activator.Biochemistry. 2024 Jun 4;63(11):1434-1444. doi: 10.1021/acs.biochem.4c00071. Epub 2024 May 23. Biochemistry. 2024. PMID: 38780522 Free PMC article.
-
Unraveling the Role of Hydrogen Bonds in Thrombin via Two Machine Learning Methods.J Chem Inf Model. 2023 Jun 26;63(12):3705-3718. doi: 10.1021/acs.jcim.3c00153. Epub 2023 Jun 7. J Chem Inf Model. 2023. PMID: 37285464 Free PMC article.
-
Computational Dissection of the Role of Trp305 in the Regulation of the Death-Associated Protein Kinase-Calmodulin Interaction.Biomolecules. 2022 Sep 29;12(10):1395. doi: 10.3390/biom12101395. Biomolecules. 2022. PMID: 36291604 Free PMC article.
-
Simulations suggest double sodium binding induces unexpected conformational changes in thrombin.J Mol Model. 2022 Apr 13;28(5):120. doi: 10.1007/s00894-022-05076-0. J Mol Model. 2022. PMID: 35419655 Free PMC article.
References
-
- Nierodzik ML; Karpatkin S. Thrombin Induces Tumor Growth, Metastasis, and Angiogenesis: Evidence for a Thrombin-Regulated Dormant Tumor Phenotype. Cancer Cell 2006, 10 (5), 355–362. - PubMed
-
- Crawley JTB; Zanardelli S; Chion CKNK; Lane DA The Central Role of Thrombin in Hemostasis. J. Thromb. Haemostasis 2007, 5, 95–101. - PubMed
Publication types
MeSH terms
Substances
Grants and funding
LinkOut - more resources
Full Text Sources
Other Literature Sources

