. 2021 Apr 1;28(4):748-763.e7.
doi: 10.1016/j.stem.2020.12.009. Epub 2021 Jan 14.

Histone crotonylation promotes mesoendodermal commitment of human embryonic stem cells

Affiliations

Histone crotonylation promotes mesoendodermal commitment of human embryonic stem cells

Yi Fang et al. Cell Stem Cell. .

Abstract

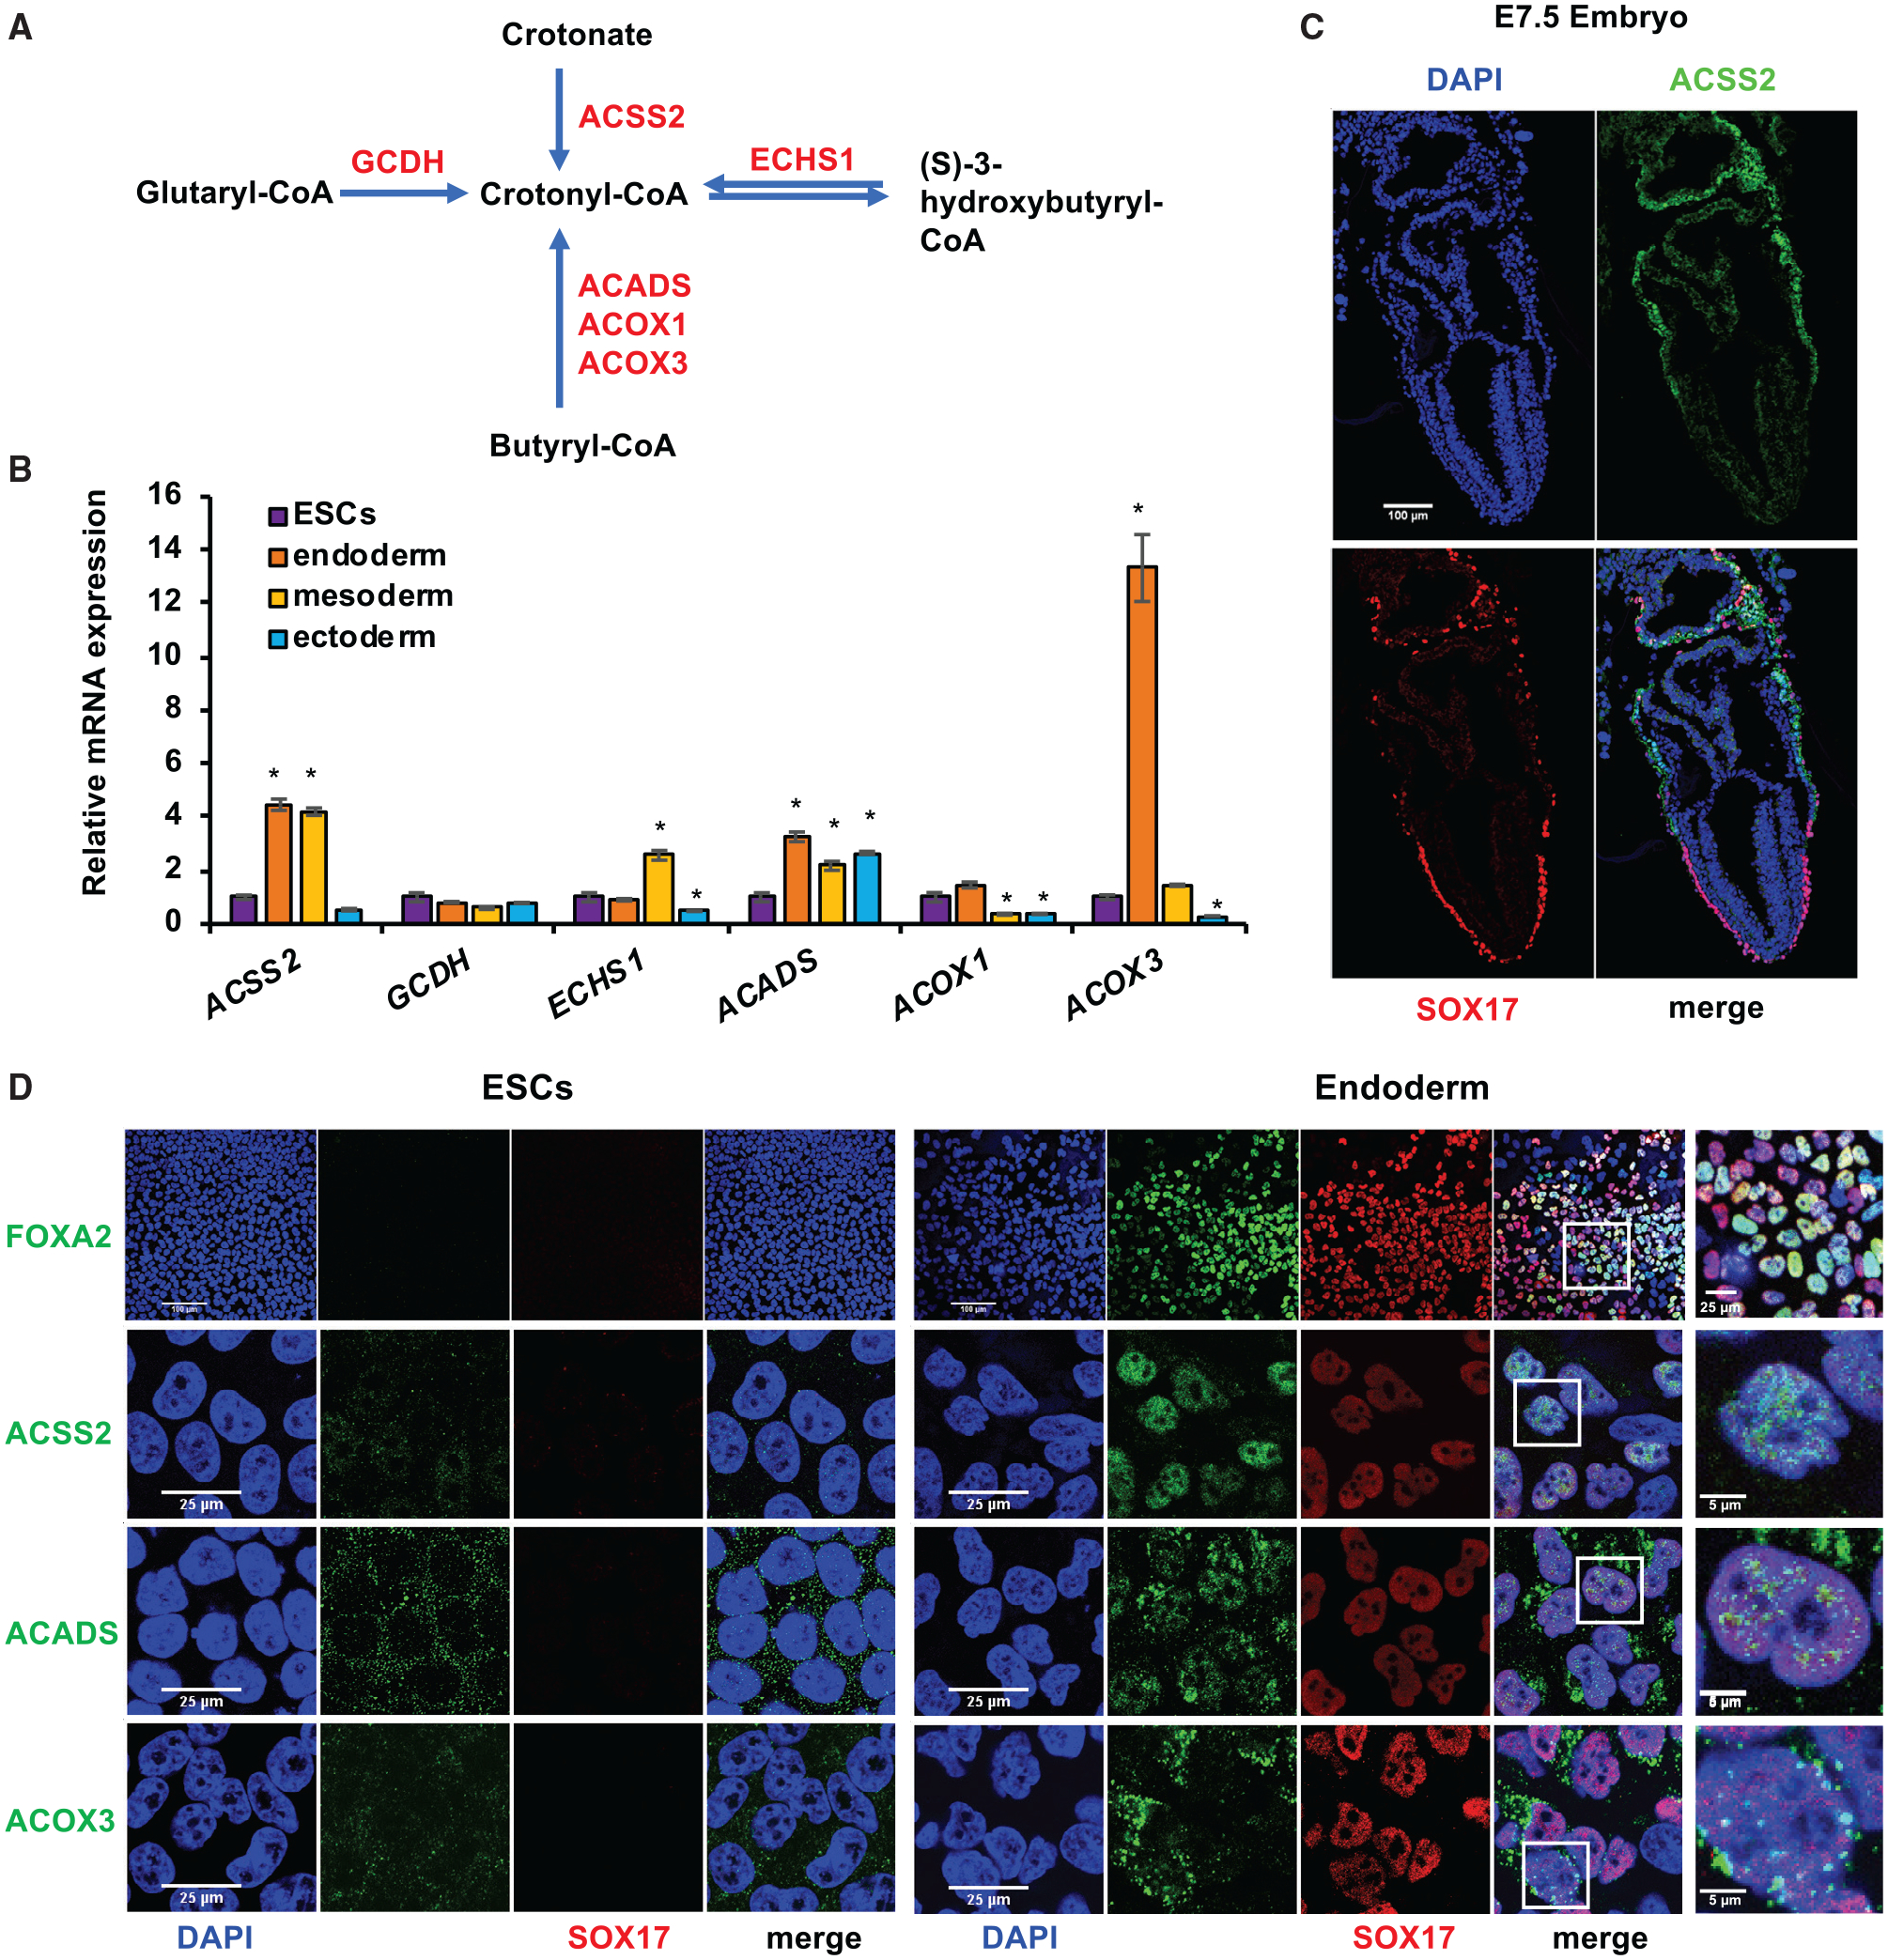
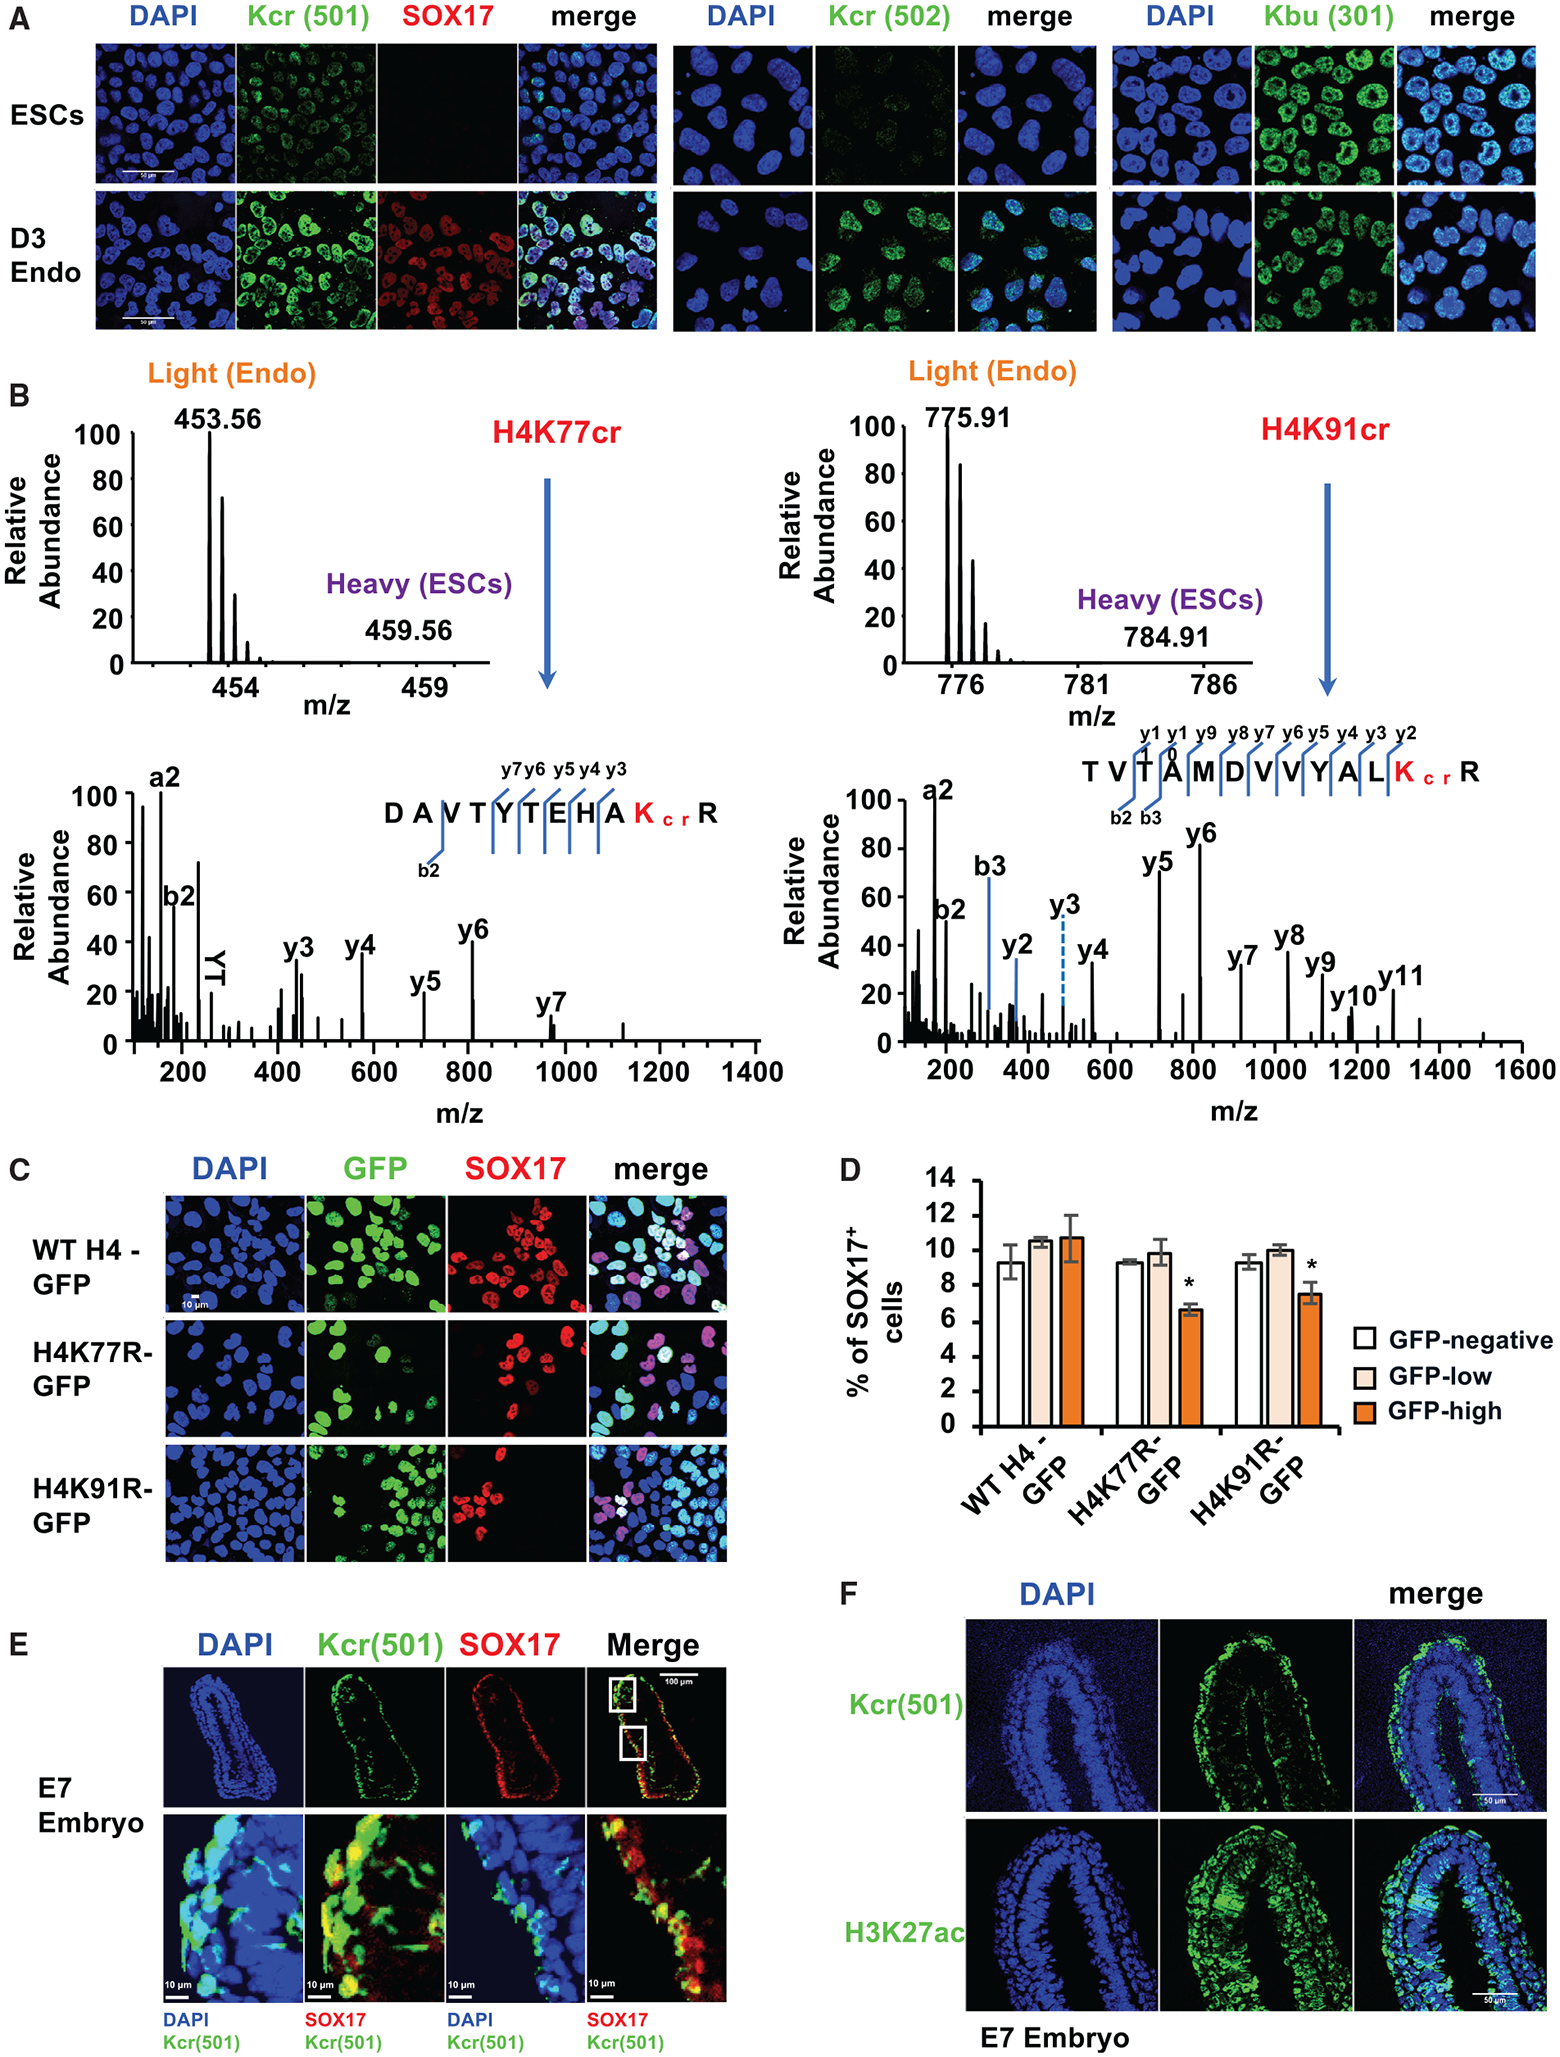
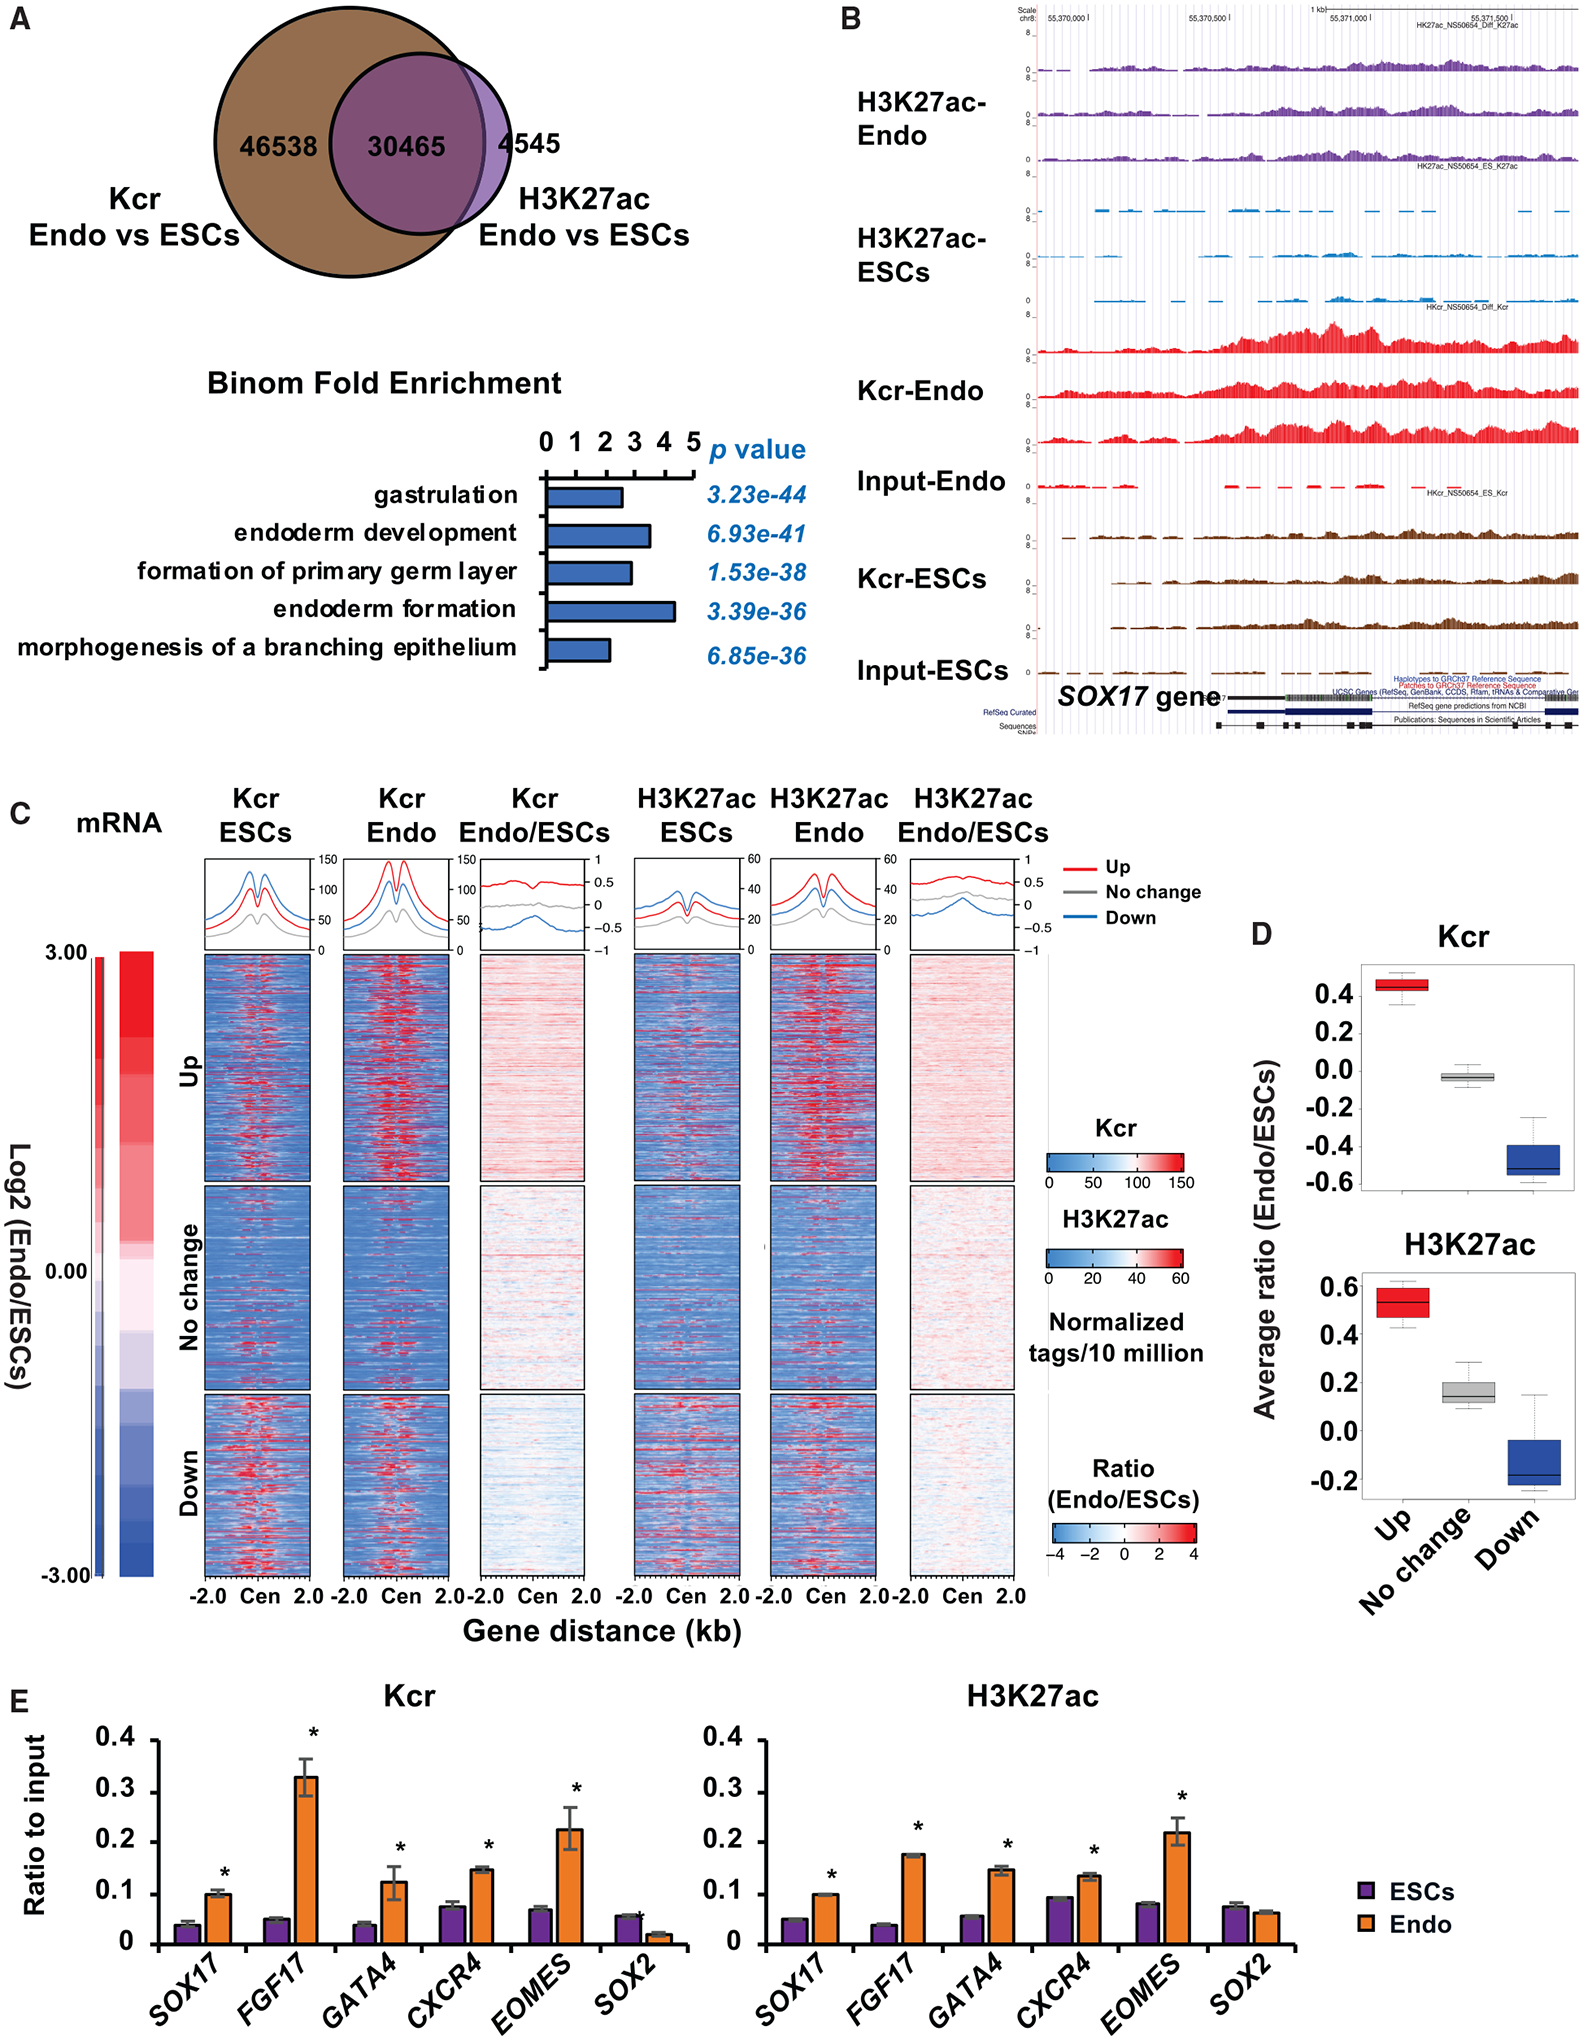
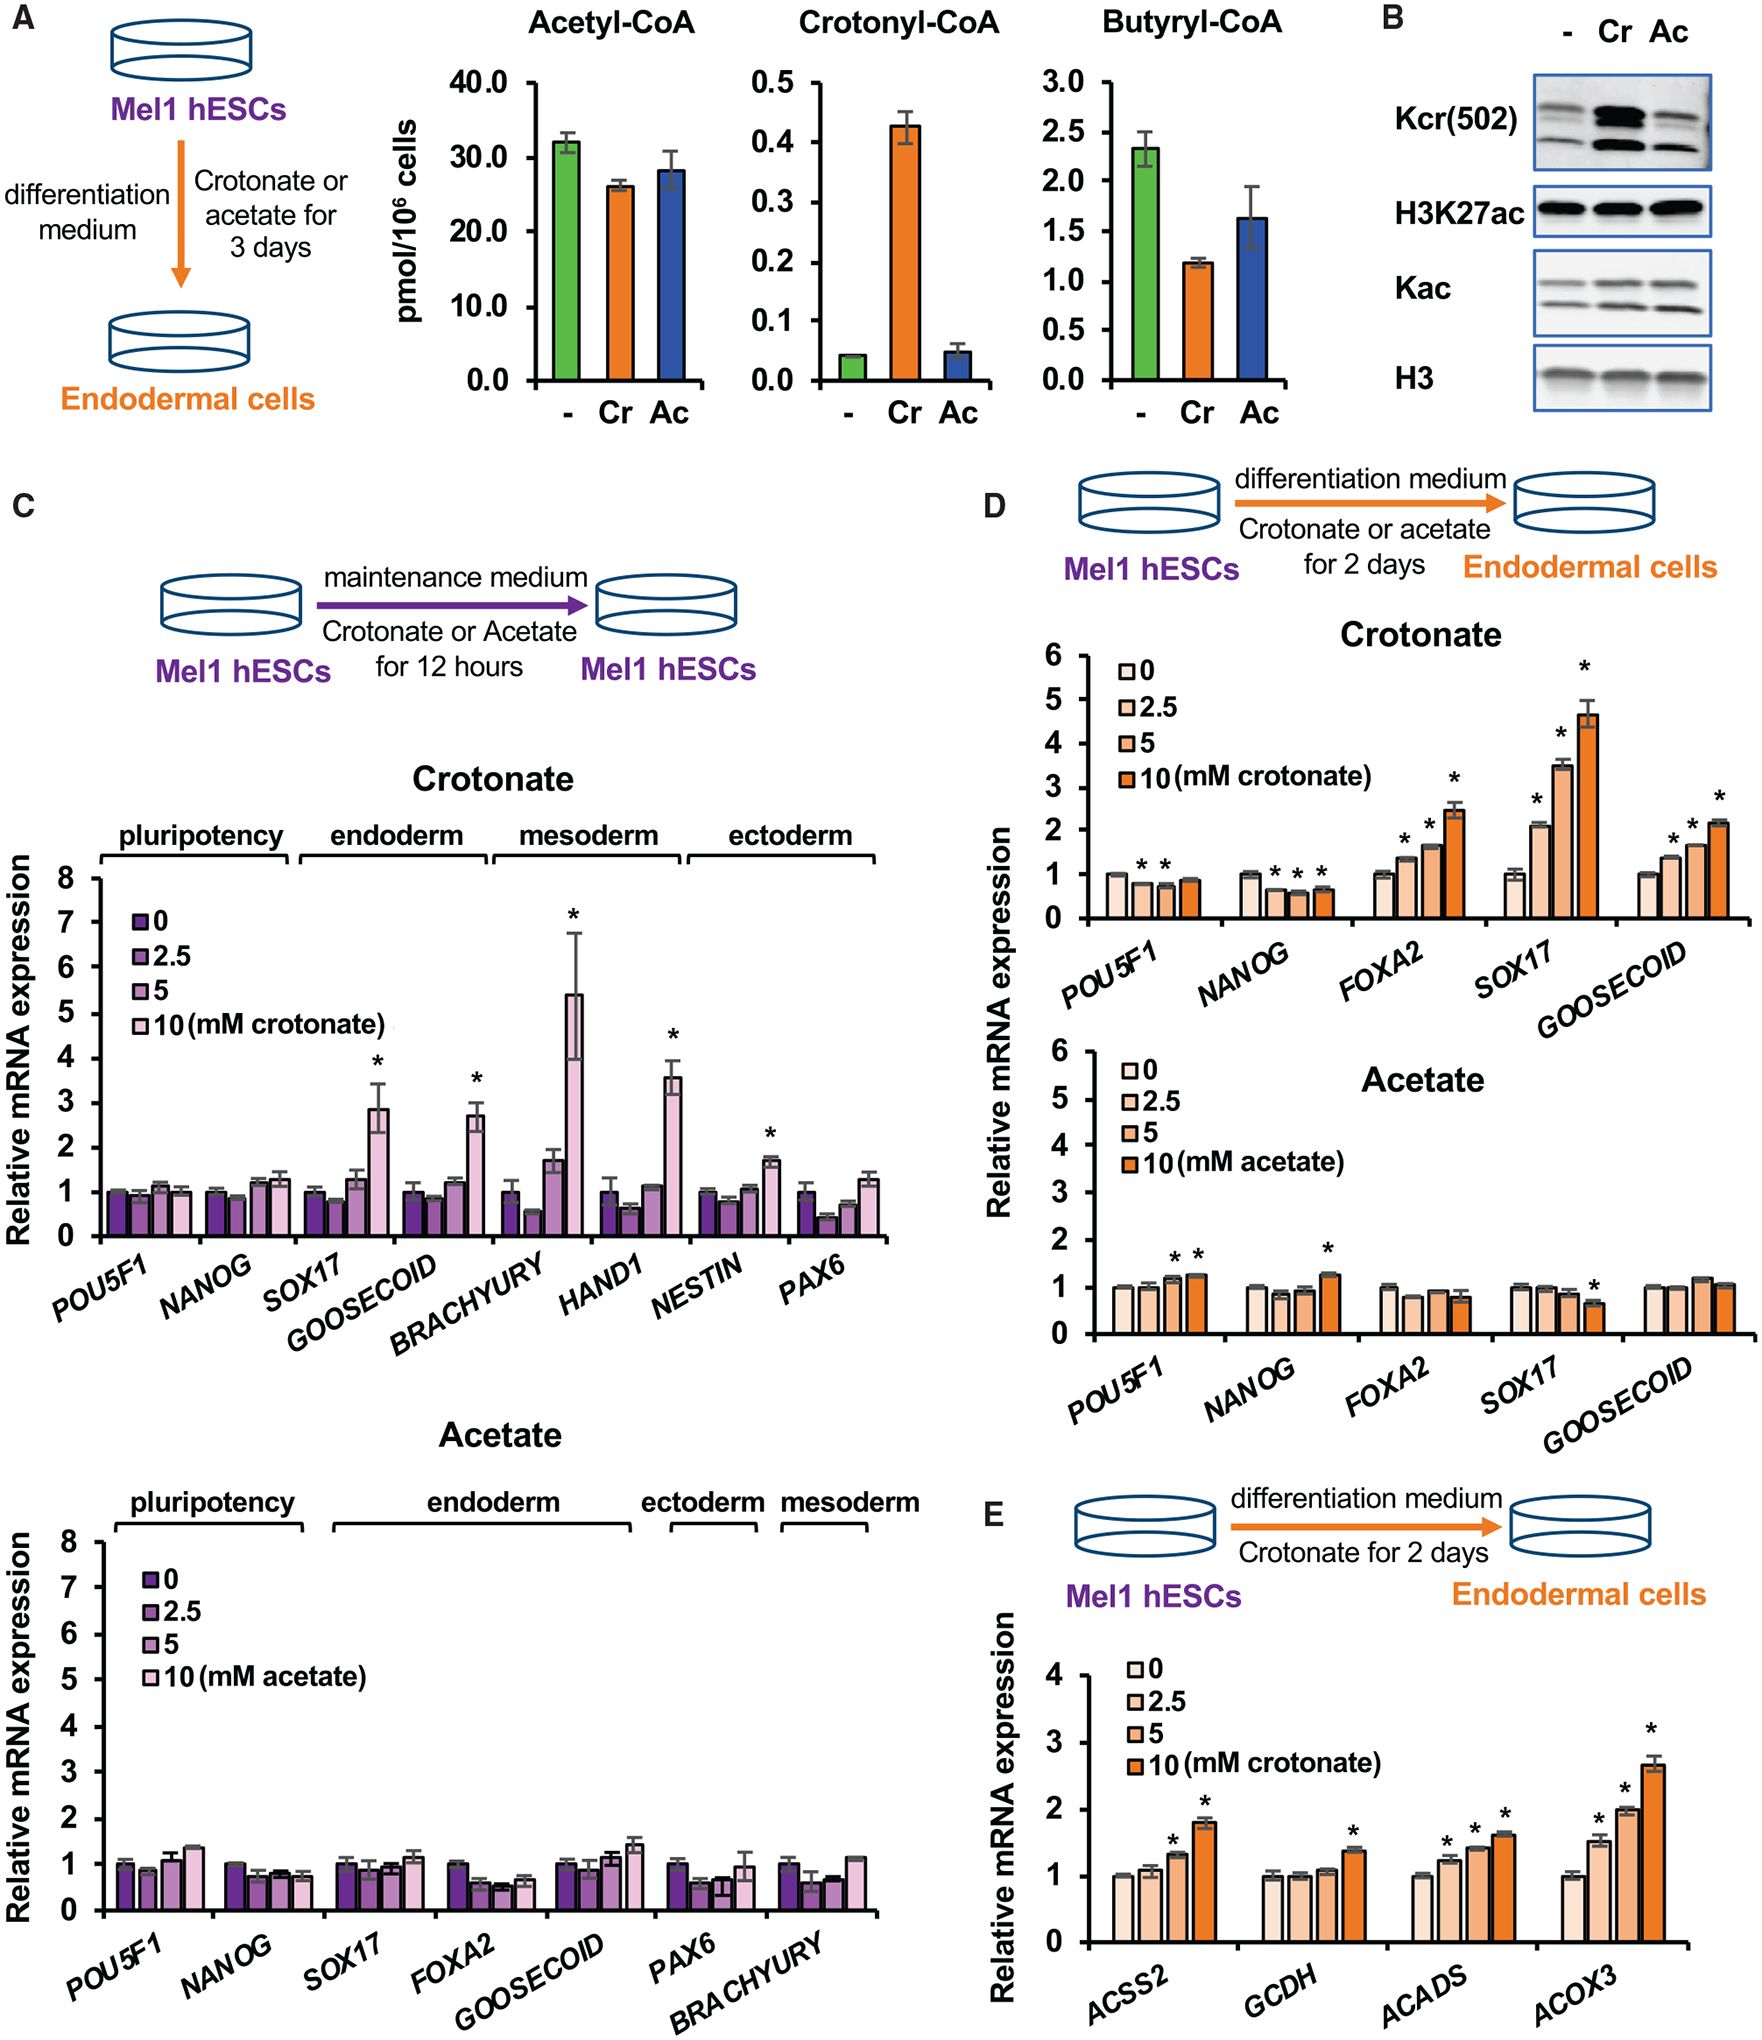
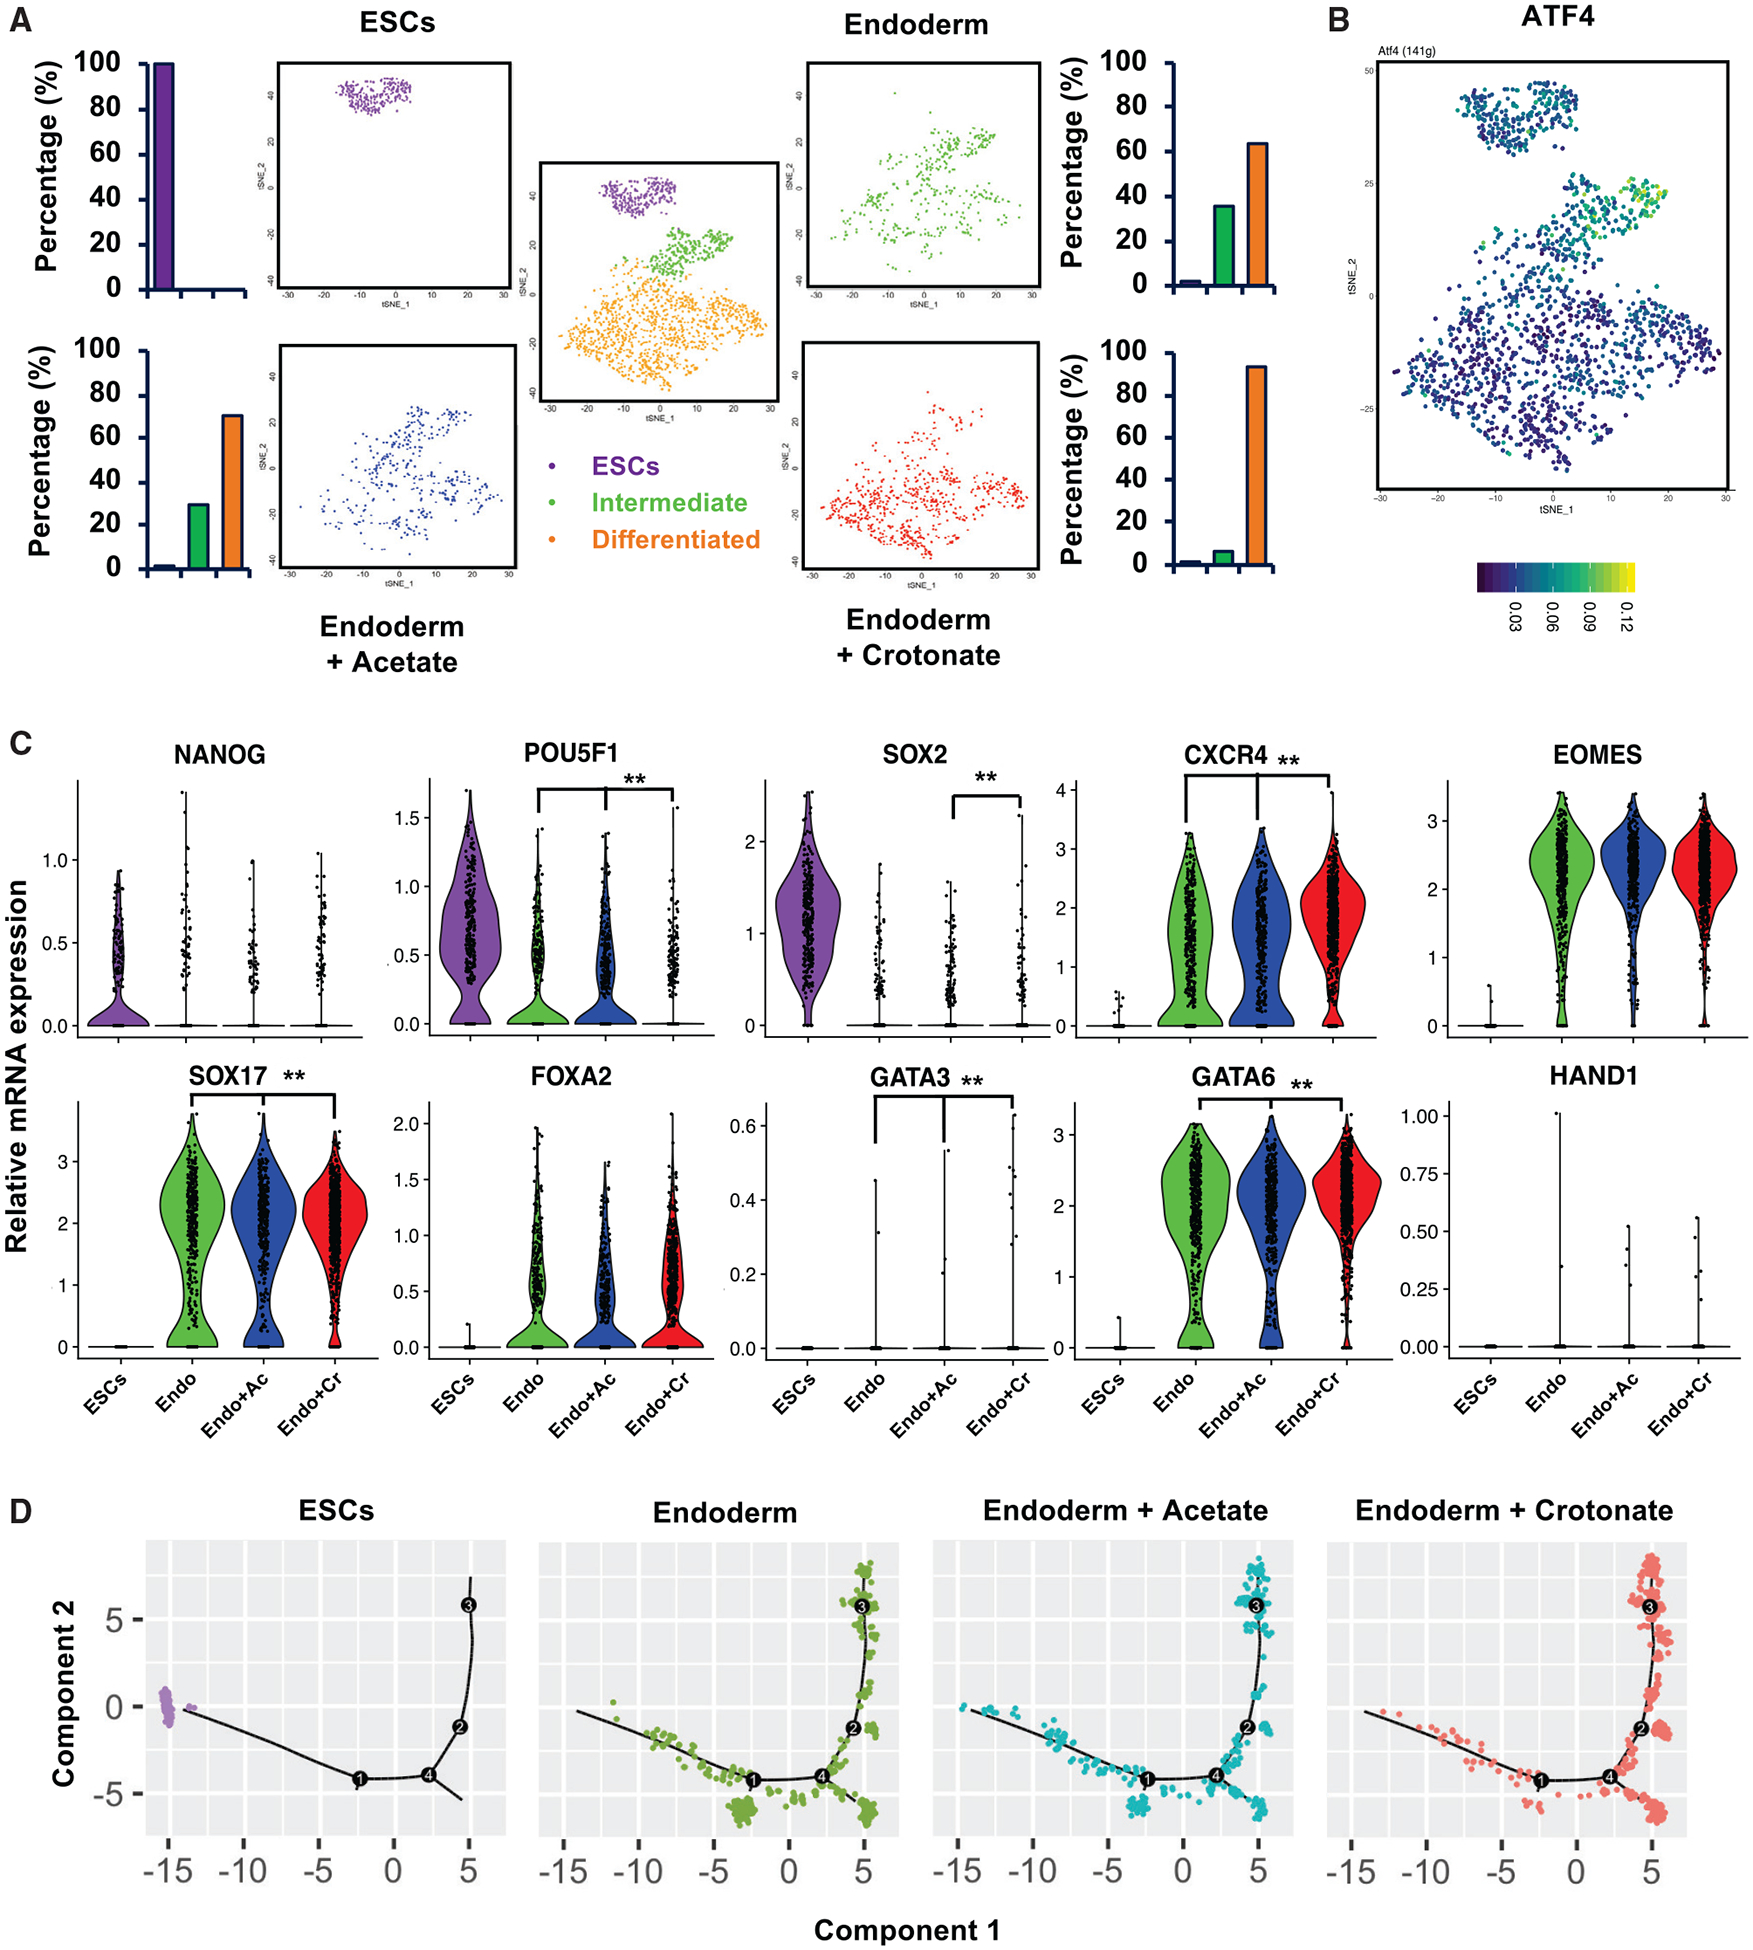
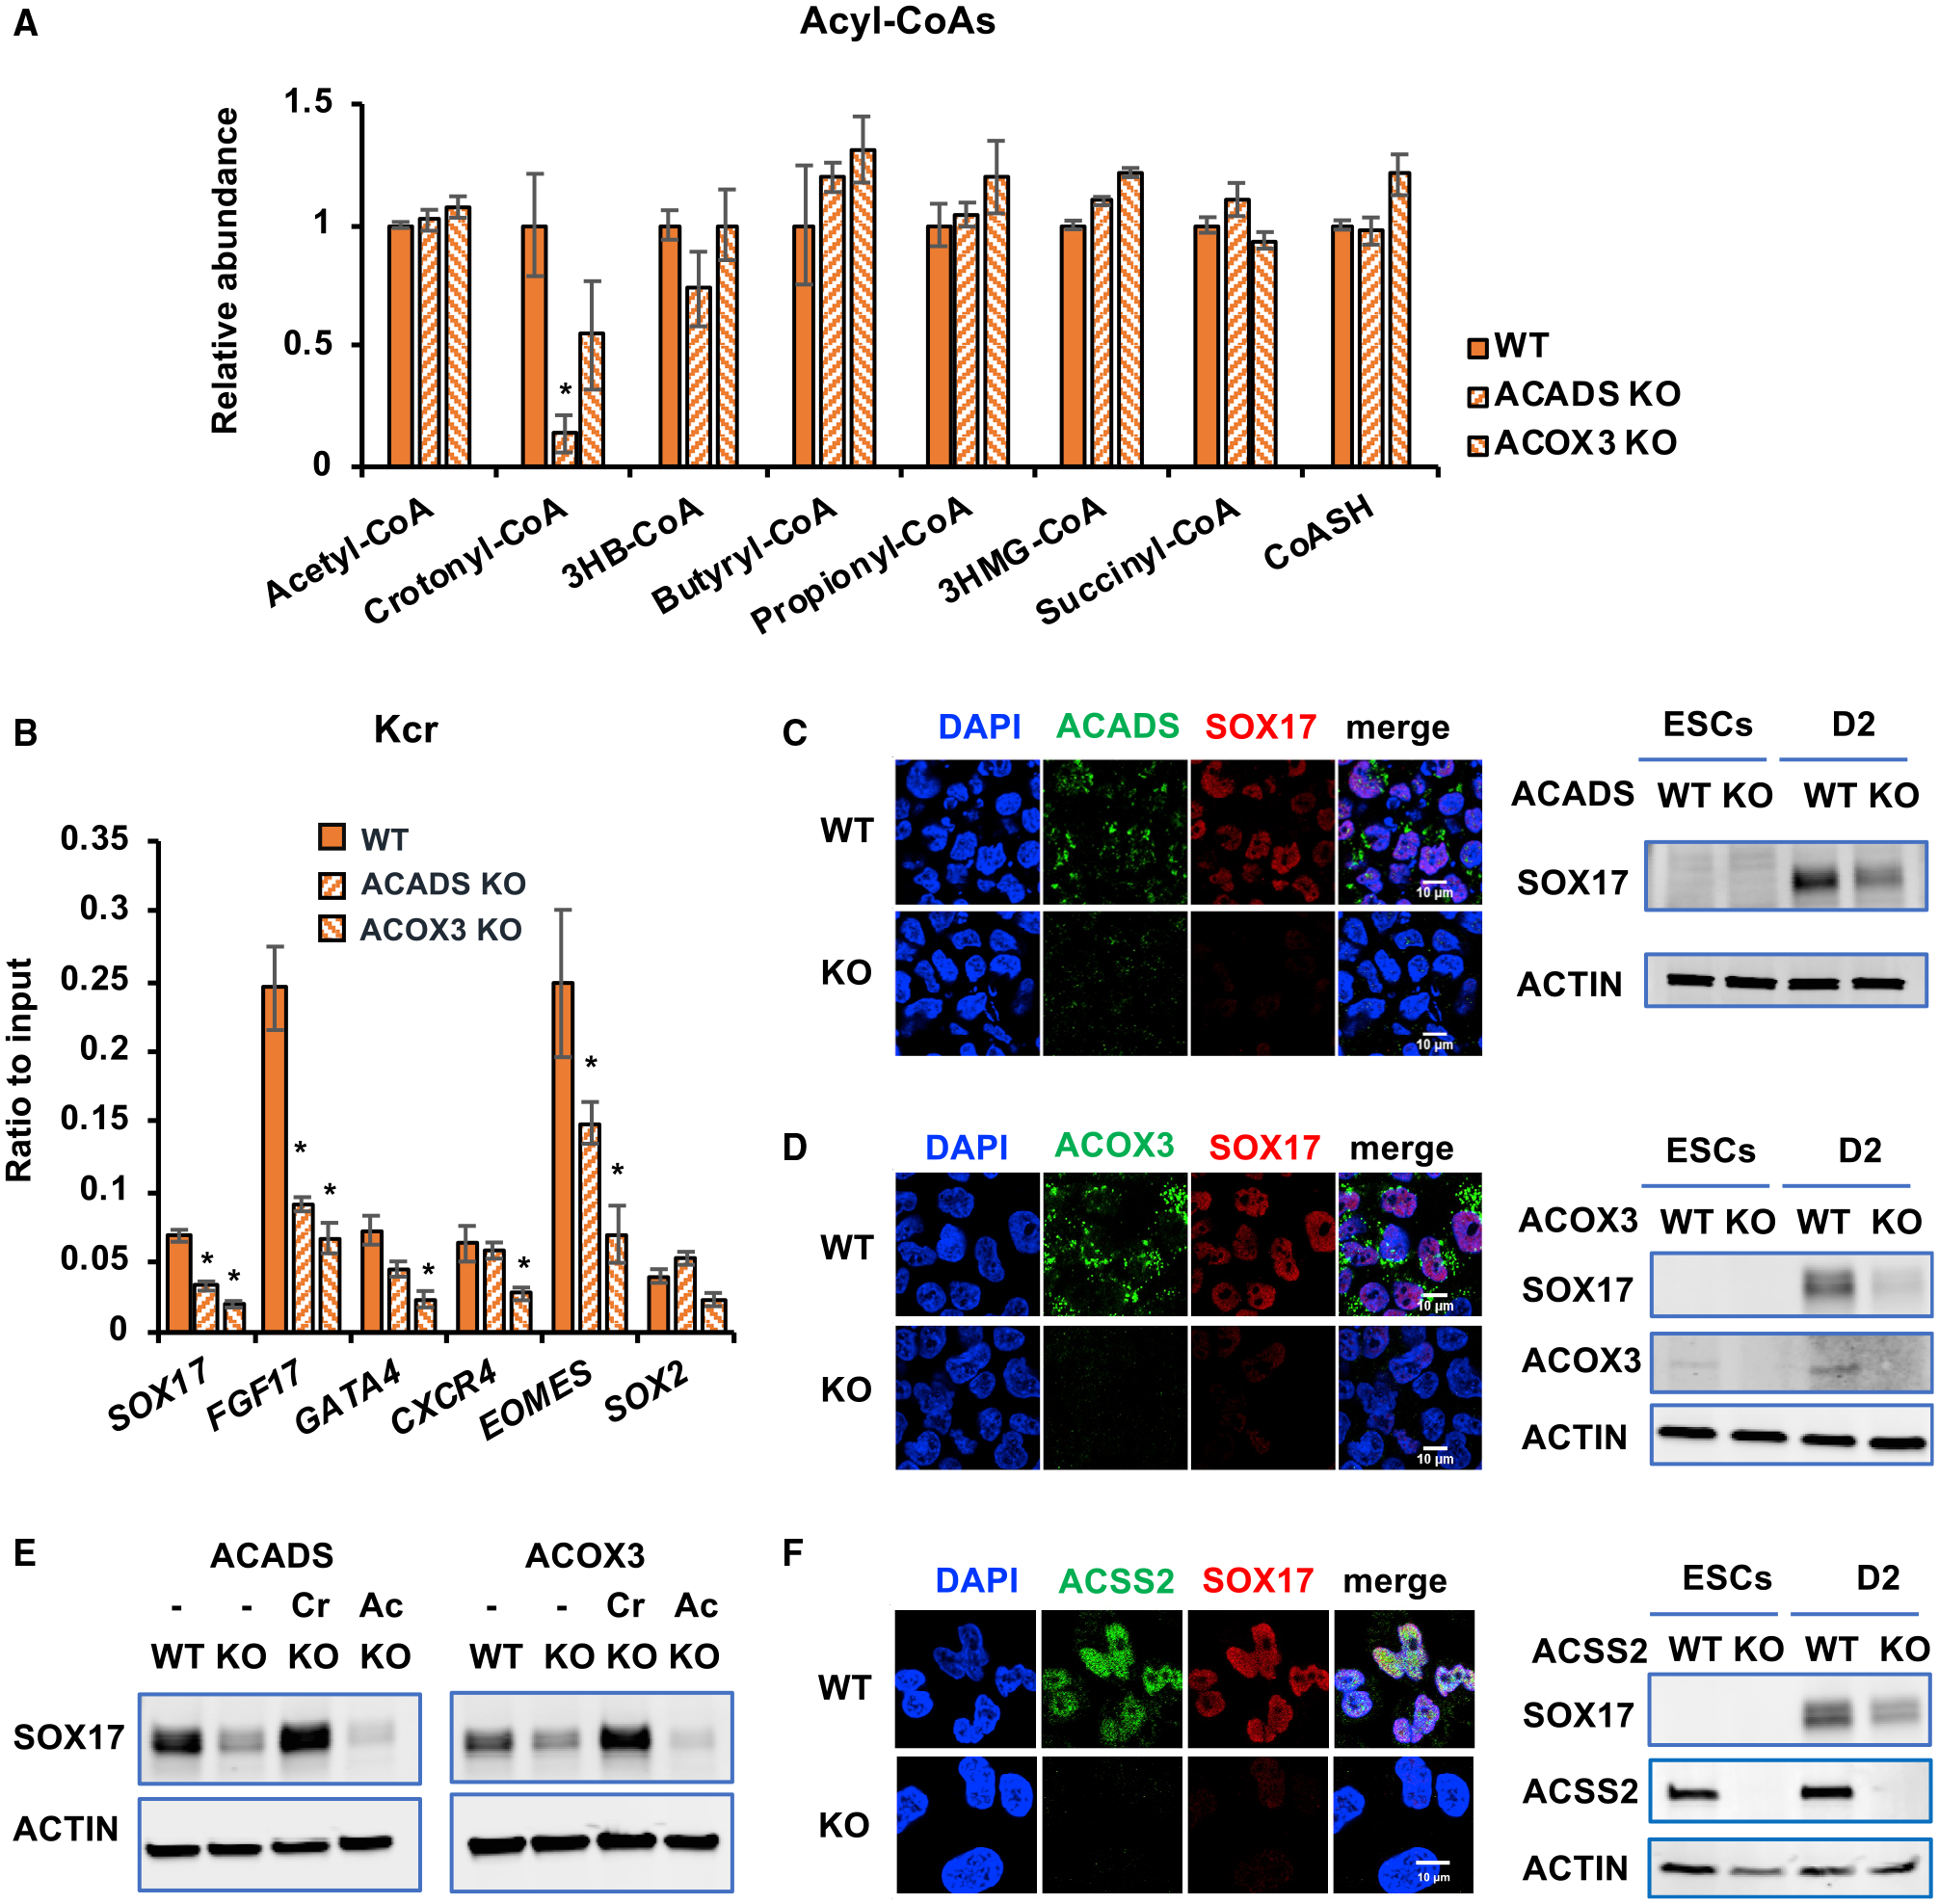
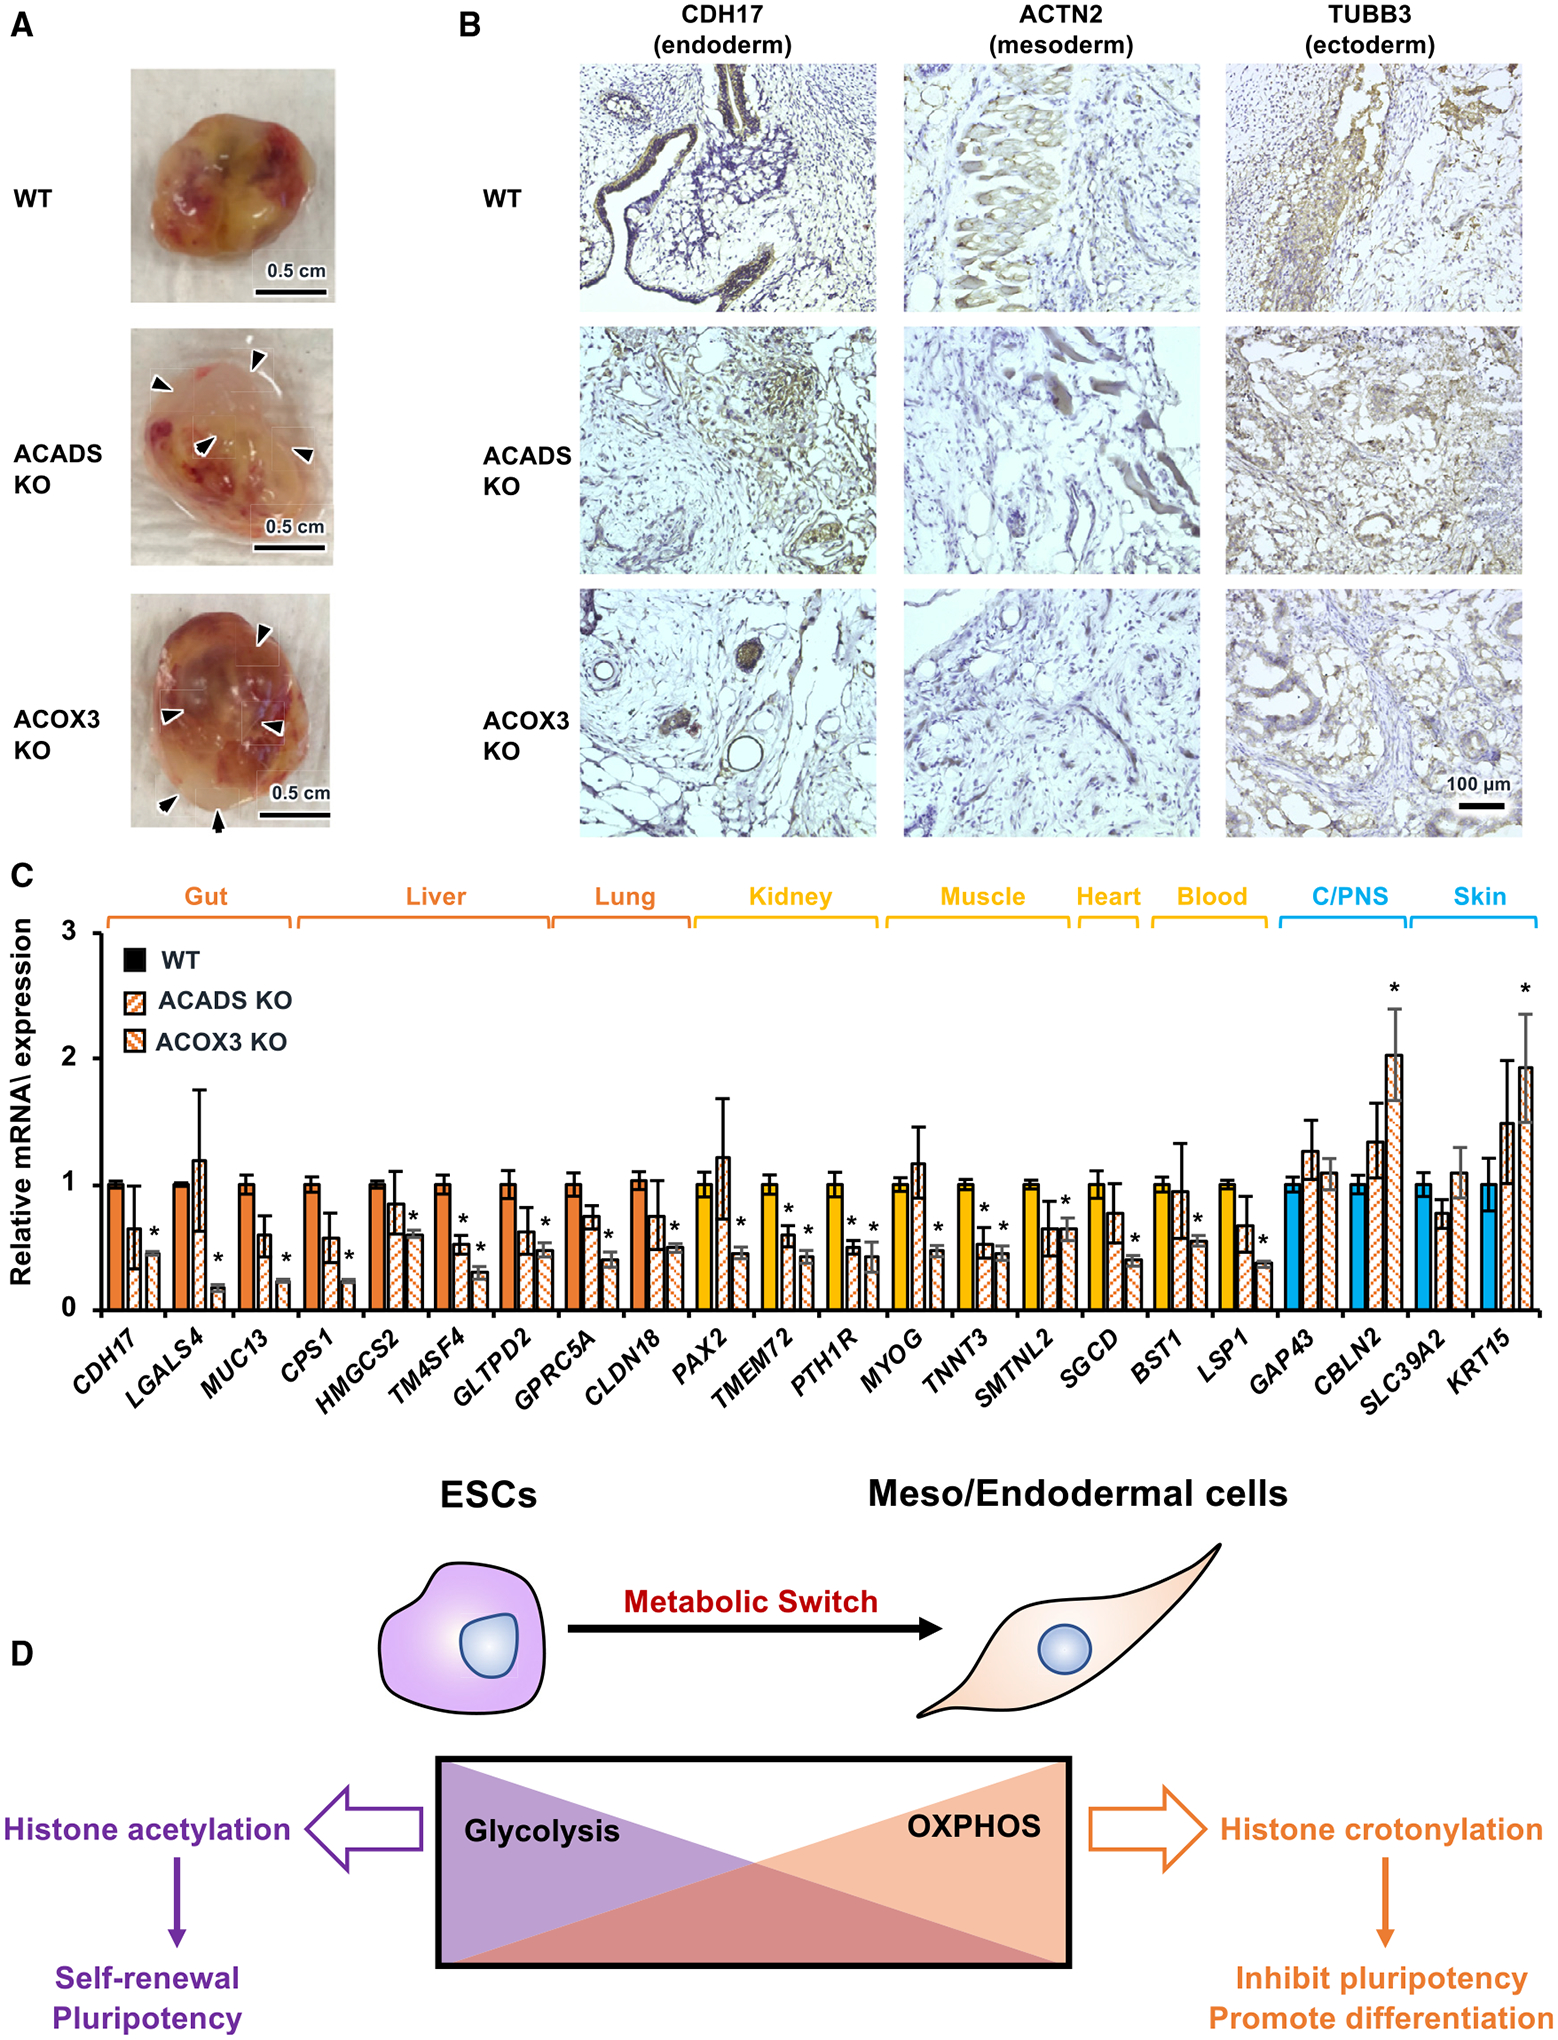
Histone crotonylation is a non-acetyl histone lysine modification that is as widespread as acetylation. However, physiological functions associated with histone crotonylation remain almost completely unknown. Here we report that histone crotonylation is crucial for endoderm differentiation. We demonstrate that key crotonyl-coenzyme A (CoA)-producing enzymes are specifically induced in endodermal cells during differentiation of human embryonic stem cells (hESCs) in vitro and in mouse embryos, where they function to increase histone crotonylation and enhance endodermal gene expression. Chemical enhancement of histone crotonylation promotes endoderm differentiation of hESCs, whereas deletion of crotonyl-CoA-producing enzymes reduces histone crotonylation and impairs meso/endoderm differentiation in vitro and in vivo. Our study uncovers a histone crotonylation-mediated mechanism that promotes endodermal commitment of pluripotent stem cells, which may have important implications for therapeutic strategies against a number of human diseases.

Keywords: crotonylation; embryogenesis; embryonic stem cells; endoderm differentiation; epigenetics; metabolic switch.


Conflict of interest statement

Declaration of interests Y.Z. is on the science advisory board of PTM Biolabs.

Figures

Figure 1.
Figure 1.. Key crotonyl-CoA-producing enzymes are induced and enriched in endodermal cells
(A) Key metabolic reactions that produce crotonyl-CoA. ACSS2, acyl-CoA synthetase short chain family member 2; ACADS, acyl-CoA dehydrogenase short chain; ACOX1, acyl-CoA oxidase 1; ACOX3, acyl-CoA oxidase 3; ECHS1, enoyl-CoA hydratase, short chain 1; GCDH, glutaryl-CoA dehydrogenase. (B) ACSS2, ACADS, and ACOX3 are induced during endodermal differentiation of hESCs in vitro. The mRNA levels of the indicated genes in mel1 hESC-differentiated endoderm, mesoderm, or ectoderm were analyzed by qPCR (n = 3 biological replicates/group, *p < 0.05, values are expressed as mean ± SEM). (C) ACSS2 is enriched in endodermal cells in mouse E7.5 embryos. Expression of ACSS2 was analyzed by immunofluorescence staining in E7.5 mouse embryos. The full embryo images were taken by tiling/stitching multiple fields using ZEN software. Representative images from at least three different embryos are shown. Scale bar, 100 μm. (D) ACSS2, ACADS, and ACOX3 are induced and translocated into the nucleus during endodermal differentiation of mel1 hESCs in vitro. Mel1 hESCs were induced to differentiate into endoderm for 3 days, and then expression of the indicated proteins was analyzed by immunofluorescence staining. Scale bars for the left 8 panels: 100 μm in the FOXA2 images and 25 μm in the ACSS2, ACADS, and ACOX3 images. Scale bars for the last panel: 25 μm in the FOXA2 image and 5 μm in the ACSS2, ACADS, and ACOX3 images. See also Figures S1 and S2.
Figure 2.
Figure 2.. Endoderm differentiation is associated with enhanced histone crotonylation
(A) Histone Kcr, but not Kbu, is increased upon endoderm differentiation of hESCs. Mel1 hESCs were induced to differentiate into endoderm for 3 days, and the levels of SOX17, Kcr, and Kbu were analyzed by immunofluorescence staining. Kcr (501), rabbit polyclonal pan-anti-Kcr antibody (PTM-501, 1:10,000 dilution); Kcr (502), mouse monoclonal pan-anti-Kcr antibody (PTM-502, 1:5,000 dilution); Kbu (301), rabbit polyclonal pan-anti-Kbu antibody (PTM-301, 1:5,000 dilution). Scale bars, 50 μm. (B) H4K77 and H4K91 are two major sites crotonylated upon endoderm differentiation of hESCs. Mel1 hESCs and D3 endodermal cells differentiated from mel1 hESCs were subjected to SILAC analysis as described in Method details. The full mass spectrometry (MS) and MS/MS spectra of H4K77cr and H4K91cr peptides are shown for their identification and quantification. The b and y ions indicate peptide backbone fragment ions containing the N or C terminus, respectively. (C) K-to-R mutation of H4K77 or H4K91 reduces differentiation of endodermal cells from hESCs. Mel1 hESCs were induced to differentiate into endoderm for 2 days. SOX17 levels in D2 endodermal cells expressing GFP-tagged WT H4, H4K77R, or H4K91R were analyzed by immunofluorescence staining. Scale bar, 10 μm. (D) K-to-R mutation of H4K77 or H4K91 reduces differentiation of endodermal cells. The fractions of SOX17+ cells were analyzed in D2 endodermal cells expressing GFP-tagged WT H4, H4K77R, or H4K91R by fluorescence-activated cell sorting (FACS) assay as described in Method details (n = 3 biological replicates/group, *p < 0.05, values are expressed as mean ± SEM). (E) Histone Kcr is enriched in endodermal cells in E7 mouse embryos. The level of Kcr was analyzed by immunofluorescence staining as described in Method details. Representative images from at least three different embryos are shown. Boxed areas are enlarged to show the overlap between Kcr and SOX17 or DAPI. Scale bar in top panels, 100 mm; scale bars in bottom panel, 10 μm. (F) Histone Kcr, but not H3K27ac, is enriched selectively in endodermal cells in E7 mouse embryos. The distribution of Kcr or H3K27ac was analyzed by immunofluorescence staining in E7 mouse embryos. Representative images from at least three different embryos are shown. Scale bars, 50 μm. See also Figure S3 and Table S1.
Figure 3.
Figure 3.. Histone crotonylation is increased and enriched near endodermal genes upon endoderm differentiation
(A) Deposition of histone Kcr and H3K27ac is increased near endodermal genes upon endoderm differentiation of hESCs. Genomic distributions of Kcr and H3K27ac in mel1 hESCs (ESCs) or D3 endodermal cells differentiated in regular differentiation medium (Endo) were analyzed by ChIP-seq analysis as described in Method details. The GO enrichment of biological processes in overlapped 30465 chromatin loci was analyzed by GREAT version 3.0.0. (B) Abundance of histone Kcr and H3K27ac deposition is induced on the SOX17 gene locus upon endoderm differentiation of hESCs. The deposition of Kcr and H3K27ac on the SOX17 locus in cells described in (A) was visualized in the UCSC Genome Browser. (C) Histone Kcr and H3K27ac are enriched on the TSSs of induced genes but depleted from the TSS of repressed genes upon endoderm differentiation of hESCs. Transcriptomes (mRNA) of mel1 hESCs and D3 Endo cells were analyzed by bulk RNA-seq. The top 1,864 significantly upregulated genes (up), 1,495 down-regulated genes (down) (cutoff: fold change > 2.0 or < −2.0, q < 0.01), and 1,677 not significantly changed genes (no change) were selected. These genes were then sorted from the largest to the smallest based on their fold changes between endodermal cells and mel1 hESCs (Endo/ESCs). The corresponding ChIP-seq read tags of Kcr and H3K27ac near the TSS of each gene in mel1 hESCs (ESCs) and D3 endodermal cells (Endo) and the ratio of read tags between endodermal cells and hESCs (Endo/ESCs) were graphed. (D) Boxplot presentation of the average ratio of Kcr and H3K27ac genome coverage on induced (up), not changed (no change), and repressed (down) gene loci upon endodermal differentiation. The gene clusters were selected as in (C), and the average genome coverage of Kcr and H3K27ac on these three gene clusters were plotted. The center line is located at the median; the box length extends from the first quantile (Q1) to the third quantile (Q3), which corresponds to the interquartile range (IQR). The maximum line is located at Q3 + 1.5 3 IQR, whereas the minimum line is located at Q1 −1.5 × IQR. For Kcr and H3K27ac, the difference between three clusters was significant (p < 2.2 × 10⁻¹⁶, Student’s t test between any two clusters). (E) Endoderm differentiation results in increased deposition of histone Kcr and H3K27ac on endodermal genes. Association of Kcr and H3K27ac on the TSSs of the indicated endodermal and pluripotent genes was analyzed by ChIP-qPCR, and relative enrichment was calculated against the input signal (n = 3 biological replicates/group, *p < 0.05, values are expressed as mean ± SEM). See also Figure S4 and Tables S2, S3, and S4.
Figure 4.
Figure 4.. Crotonate promotes endoderm differentiation of hESCs
(A) Crotonate increases the cellular level of crotonyl-CoA. The concentrations of acetyl-CoA, crotonyl-CoA, and butyryl-CoA in mel1 hESCs after 3-day differentiation into endoderm in regular differentiation medium (−) or in differentiation medium containing 5 mM crotonate (Cr) or 5 mM acetate (Ac) were analyzed as described in Method details (n = 3 biological replicates/group, values are expressed as mean ± SEM). (B) Crotonate increases histone crotonylation. Mel1 hESCs were induced for endoderm differentiation with or without 5 mM Cr or 5 mM Ac for 3 days. Whole-cell lysates were immunoblotted with the indicated antibodies. (C) Crotonate is sufficient to induce expression of endodermal and mesodermal genes in hESCs. Mel1 hESCs were treated with increased doses of Cr or Ac in ESC maintenance medium for 12 h, and the expression of the indicated genes was analyzed by qPCR (n = 3 biological replicates/group, *p < 0.05, values are expressed as mean ± SEM). (D) Crotonate dose-dependently promotes the expression of endodermal genes upon endoderm differentiation of hESCs. Mel1 hESCs were induced to differentiate into endoderm in differentiation medium containing 0, 2.5, 5, or 10 mM Cr or Ac for the indicated days. The mRNA levels of the indicated genes were analyzed by qPCR (n = 3 biological replicates/group, *p < 0.05, values are expressed as mean ± SEM). (E) Crotonate dose-dependently enhances the expression of key crotonyl-CoA-producing enzymes upon endoderm differentiation. Mel1 hESCs were differentiated into endoderm in regular differentiation medium containing 0, 2.5, 5, or 10 mM Cr for 2 days. The mRNA levels of the indicated crotonyl-CoA-producing enzymes were analyzed by qPCR (n = 3 biological replicates/group, *p < 0.05, values are expressed as mean ± SEM). See also Figures S5A and S5B.
Figure 5.
Figure 5.. Crotonate increases the fraction of differentiated endodermal cells upon endoderm differentiation of hESCs
(A) Crotonate, but not acetate, promotes more hESCs to differentiate into endodermal cells when analyzed at the single-cell transcriptome level. Mel1 hESCs and D3 endoderm cells differentiated in regular endodermal differentiation medium (endoderm) or in regular endodermal differentiation medium containing 5 mM acetate (endoderm+Acetate) or 5 mM Crotonate (endoderm+Crotonate) were analyzed by scRNA-seq. A total of 1,863 cells from all four samples were clustered into three clusters (center panel). The tSNE plots at the four corners are for four individual experimental samples, showing their individual clustering patterns and the percentage of cells in each cluster. The percentage of cells within each cluster was quantified by comparing the number of cells in that particular cluster with the total cell number analyzed for that experimental sample (n = 290 cells in ESCs, 428 in endoderm, 397 in endoderm+Acetate, and 748 in endoderm+Crotonate). (B) ATF4 is enriched in the intermediate cluster during endodermal differentiation of hESCs. Mel1 hESCs and corresponding D3 endodermal cells were analyzed by scRNA-seq. All combined promoters of the genes expressed in a cell were used to infer transcription factor activity by SCENIC, and the activity of the ATF4 transcription factor in different cells was projected onto tSNE space with its activity color coded (AUCell; high, yellow; low, dark blue). (C) Crotonate, but not acetate, promotes more cells with high endodermal gene expression. The color-coded violin plots display the expression distribution of pluripotent and differentiation markers in four different scRNA-seq samples. Each dot represents a single cell. Gene expression changes between samples were compared, and the significance of change was labeled (**false discovery rate [FDR]-adjusted p < 0.01). (D) Crotonate, but not acetate, promotes more hESCs to differentiate into endodermal cells, as revealed by the single-cell pseudotemporal analysis. The endodermal differentiation trajectories of the indicated scRNA-seq samples were analyzed by pseudotemporal analysis as described in Method details. See also Figures S5C and S5D and Tables S5 and S6.
Figure 6.
Figure 6.. Crotonyl-CoA-producing enzymes modulate histone crotonylation and regulate endoderm differentiation in vitro
(A) KO of ACADS or ACOX3 reduces crotonyl-CoA levels. The levels of crotonyl-CoA in the indicated mel1-differentiated D3 endodermal cells were measured as described in Method details (n = 3 biological replicates/group, *p < 0.05, values are expressed as mean ± SEM). (B) Knocking out ACADS or ACOX3 in mel1 hESCs reduces deposition of Kcr at the TSSs of endodermal genes. TSS-associated Kcr levels were analyzed by ChIP-qPCR in the indicated cells, and relative enrichment was calculated against the input signal (n = 3 independent experiments, *p < 0.05, values are expressed as mean ± SEM). (C) Knocking out ACADS in mel1 hESCs impairs endodermal gene expression. Left: the expression of ACADS and SOX17 was analyzed in WT and ACADS KO D2 endodermal cells by immunofluorescence staining. Right: the expression of SOX17 was analyzed in hESCs and the indicated D2 endodermal cells by immunoblotting. Scale bars, 10 μm. (D) Knocking out ACOX3 in mel1 hESCs impairs endodermal gene expression. WT and ACOX3 KO D2 endodermal cells were analyzed as in (C). Scale bars, 10 μm (E) Crotonate, but not acetate, rescues the defective endoderm differentiation induced by ACADS or ACOX3 deficiency. WT and the indicated KO mel1 hESCs were induced into endoderm differentiation in the absence or presence of 5 mM crotonate (Cr) or acetate (Ac) for 2 days. (F) Deletion of ACSS2 in mel1 hESCs impairs endodermal gene expression. WT and ACSS2 KO D2 endodermal cells were analyzed as in (C). Scale bar, 10 μm. See also Figure S6.
Figure 7.
Figure 7.. Crotonyl-CoA-producing enzyme deficiency impairs endoderm differentiation in vivo
(A) WT, ACADS KO, and ACOX3 KO teratomas. WT, ACADS KO, and ACOX3 KO mel1 hESCs were injected subcutaneously into NSG mice for an in vivo teratoma assay as described in Method details. WT, ACADS KO, and ACOX3 KO teratomas were dissected 9 weeks after injection. Arrowheads, fluid-filled large cysts on ACADS KO and ACOX3 KO teratomas. Representative images are shown (see Figure S7 for all teratomas in this experiment; n = 8 WT teratomas, 8 ACADS KO teratomas, and 10 ACOX3 KO teratomas). Scale bars, 0.5 cm. (B) ACADS or ACOX3 deficiency in hESCs impairs differentiation of endodermal and mesodermal tissues in vivo. Tissue sections of WT, ACADS KO, and ACOX3 KO teratomas were analyzed by immunohistochemistry (IHC) staining of the indicated endodermal, mesodermal, or ectodermal markers. ACADS KO and ACOX3 KO teratomas display disorganized structures of endodermal and mesodermal tissues. Scale bar, 100 μm. (C) Deletion of ACADS or ACOX3 in hESCs reduces the expression of endodermal and mesodermal but not ectodermal markers in vivo. Orange, endodermal tissues; yellow, mesodermal tissues; blue, ectodermal tissues. The mRNA levels of the indicated genes were analyzed by qPCR (n = 3 WT, 4 ACADS KO, and 3 ACOX3 KO teratomas, *p < 0.05, values are expressed as mean ± SEM). (D) Histone crotonylation promotes meso/endodermal commitment of PSCs. Pluripotent ESCs demand high glycolysis-mediated production of acetyl-CoA and histone acetylation for maintenance of pluripotency (left). During differentiation of PSCs to meso/endodermal cells, when a metabolic switch from glycolysis to oxidative phosphorylation occurs, histone crotonylation is enhanced to promote differentiation (right). See also Figure S7.

References

    1. Aibar S, González-Blas CB, Moerman T, Huynh-Thu VA, Imrichova H, Hulselmans G, Rambow F, Marine JC, Geurts P, Aerts J, et al. (2017). SCENIC: single-cell regulatory network inference and clustering. Nat. Methods 14, 1083–1086. - PMC - PubMed
    1. Andrews FH, Shinsky SA, Shanle EK, Bridgers JB, Gest A, Tsun IK, Krajewski K, Shi X, Strahl BD, and Kutateladze TG (2016). The Taf14 YEATS domain is a reader of histone crotonylation. Nat. Chem. Biol 12, 396–398. - PMC - PubMed
    1. Bao X, Wang Y, Li X, Li XM, Liu Z, Yang T, Wong CF, Zhang J, Hao Q, and Li XD (2014). Identification of ‘erasers’ for lysine crotonylated histone marks using a chemical proteomics approach. eLife 3, e02999. - PMC - PubMed
    1. Basu SS, and Blair IA (2011). SILEC: a protocol for generating and using isotopically labeled coenzyme A mass spectrometry standards. Nat. Protoc 7, 1–12. - PMC - PubMed
    1. Bhala A, Willi SM, Rinaldo P, Bennett MJ, Schmidt-Sommerfeld E, and Hale DE (1995). Clinical and biochemical characterization of short-chain acyl-coenzyme A dehydrogenase deficiency. J. Pediatr 126, 910–915. - PubMed

Publication types