. 2021 Feb 9;16(2):337-353.
doi: 10.1016/j.stemcr.2020.12.009. Epub 2021 Jan 14.

Absence of Both Thyroid Hormone Transporters MCT8 and OATP1C1 Impairs Neural Stem Cell Fate in the Adult Mouse Subventricular Zone

Affiliations

Absence of Both Thyroid Hormone Transporters MCT8 and OATP1C1 Impairs Neural Stem Cell Fate in the Adult Mouse Subventricular Zone

Cristina Luongo et al. Stem Cell Reports. .

Abstract

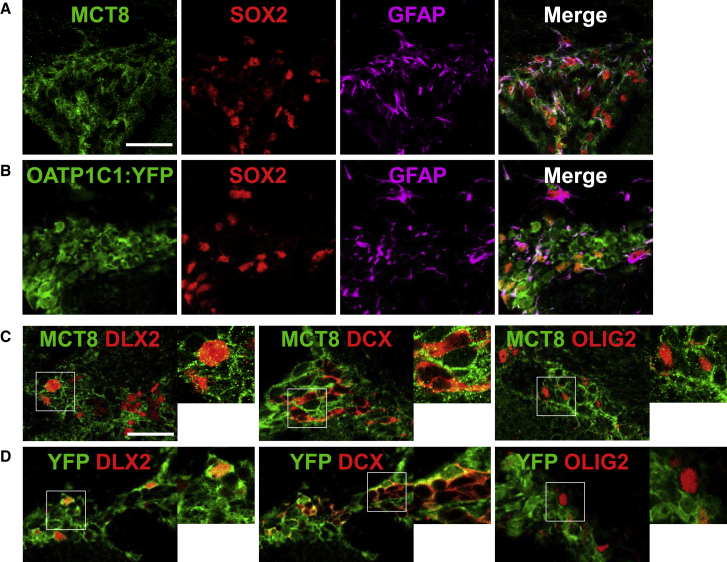
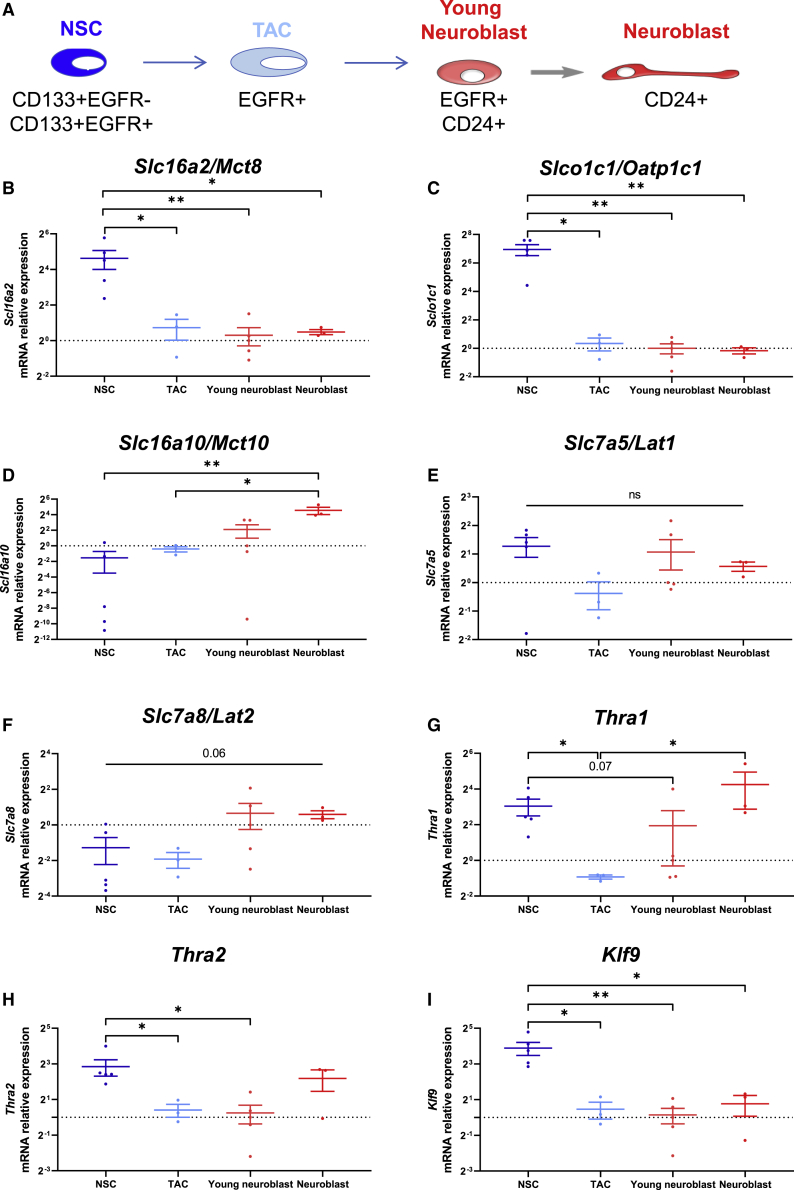
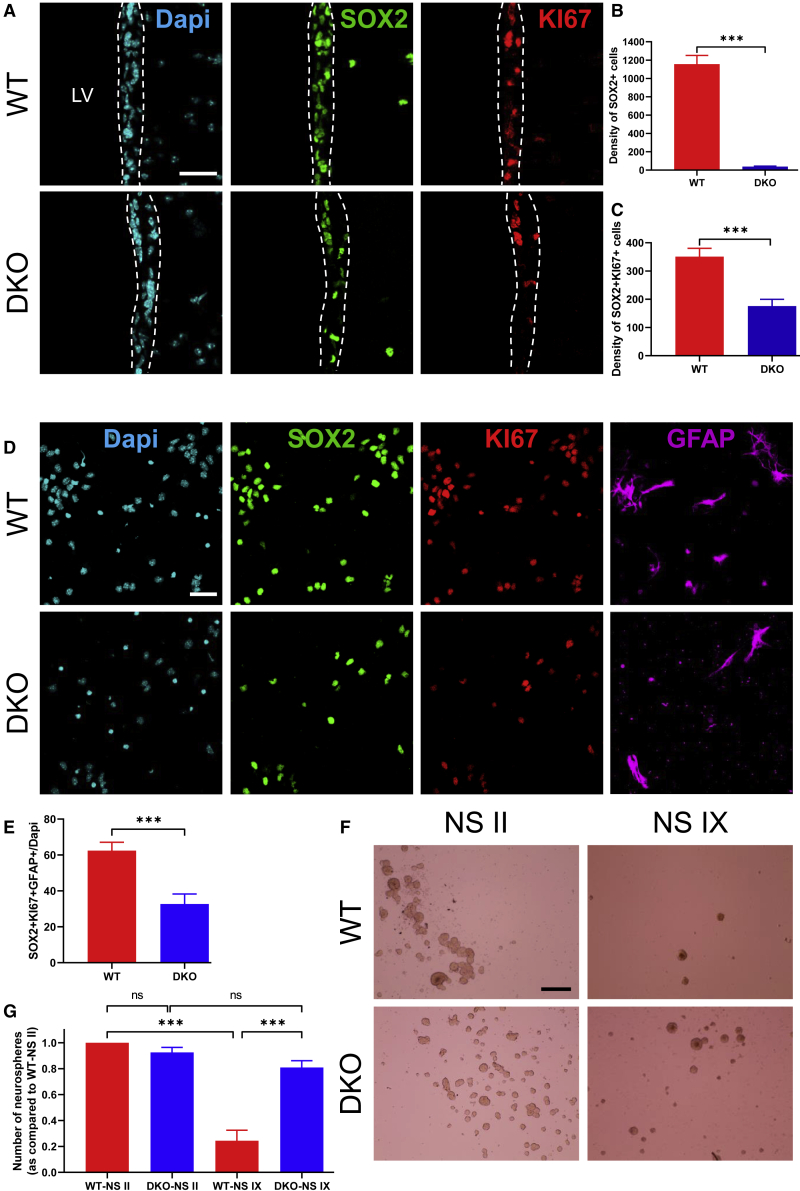
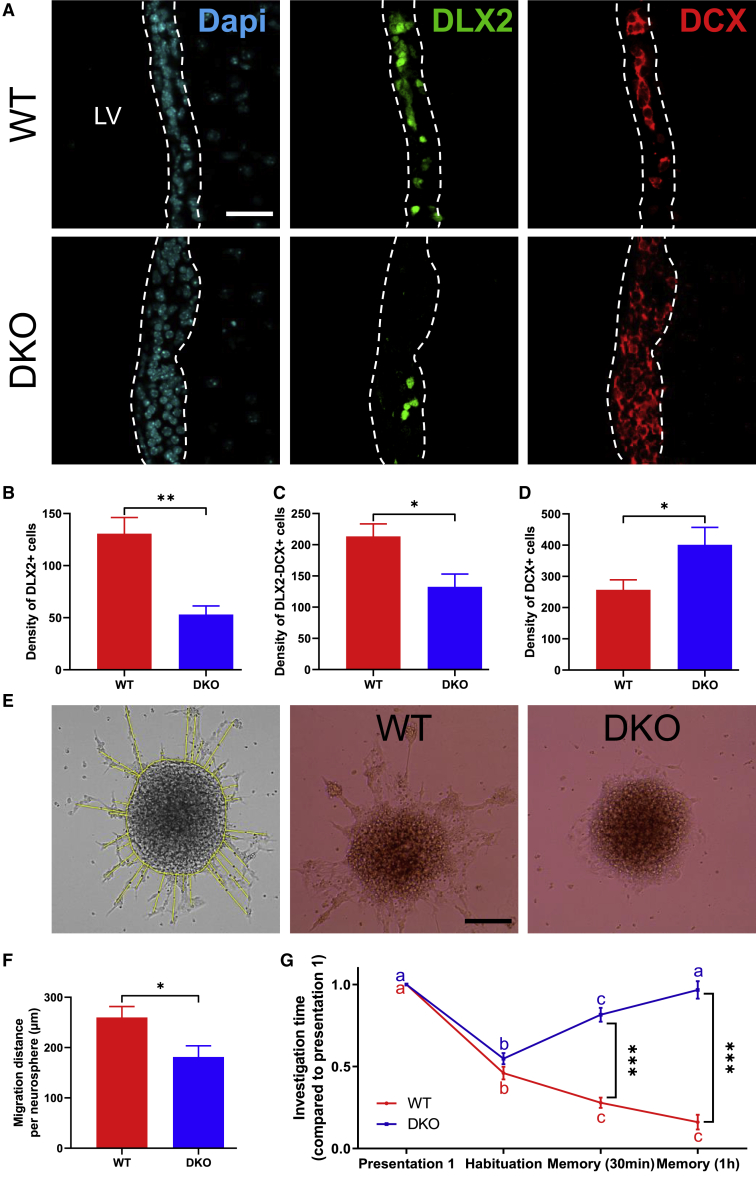
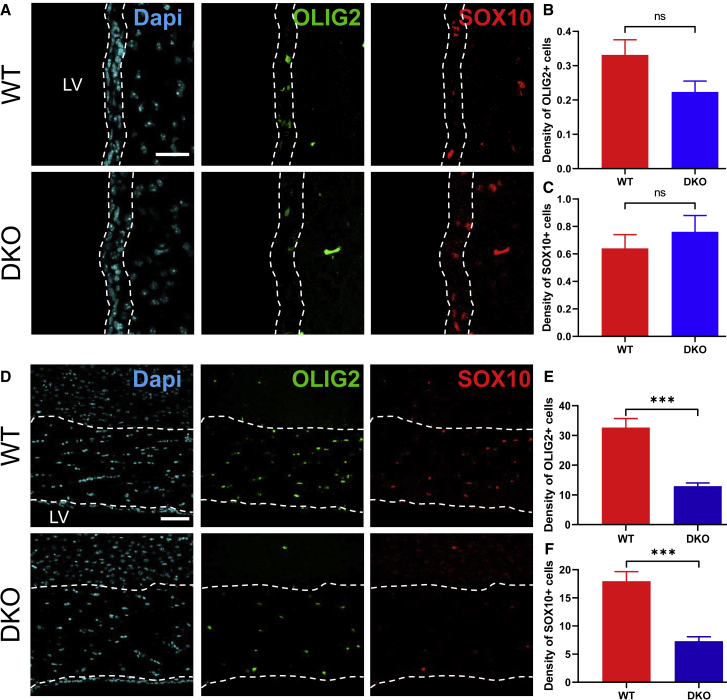
Adult neural stem cell (NSC) generation in vertebrate brains requires thyroid hormones (THs). How THs enter the NSC population is unknown, although TH availability determines proliferation and neuronal versus glial progenitor determination in murine subventricular zone (SVZ) NSCs. Mice display neurological signs of the severely disabling human disease, Allan-Herndon-Dudley syndrome, if they lack both MCT8 and OATP1C1 transporters, or MCT8 and deiodinase type 2. We analyzed the distribution of MCT8 and OATP1C1 in adult mouse SVZ. Both are strongly expressed in NSCs and at a lower level in neuronal cell precursors but not in oligodendrocyte progenitors. Next, we analyzed Mct8/Oatp1c1 double-knockout mice, where brain uptake of THs is strongly reduced. NSC proliferation and determination to neuronal fates were severely affected, but not SVZ-oligodendroglial progenitor generation. This work highlights how tight control of TH availability determines NSC function and glial-neuron cell-fate choice in adult brains.

Keywords: MCT8; OATP1C1; adult neural stem cell; olfaction; subventricular zone; thyroid hormone; thyroid hormone transporters.


Figures

Figure 1
Figure 1
MCT8 and OATP1C1 Are Strongly Expressed in NSCs and Are Maintained Principally in Committed Neuronal Cells within the Adult SVZ (A and B) Expression of MCT8 and OATP1C1 THTs in NSCs. MCT8 (A) and OATP1C1 (B) stainings on coronal section of adult dorsal SVZ show strong expression of both THTs in SOX2+ and GFAP+ NSCs. (C and D) Expression of THTs in neuronal (DLX2+, DCX+) and oligodendrocyte (OLIG2+) differentiation pathways. MCT8 (C) and OATP1C1-YFP (D) are maintained in the neuronal differentiation pathway but are not expressed in the oligodendrocyte differentiation pathway. Scale bar: 30 μm.
Figure 2
Figure 2
TH Signaling Components Are Dynamically Expressed in Neuronal Lineage Cells within the Adult SVZ (A) Schematic representation of the markers used to quantify TH signaling components mRNA expression levels in quiescent and activated NSCs (CD133+EGFR), TACs (EGFR+), NPCs (EGFR+CD24+) and neuroblasts (CD24+) from FACS-sorted SVZ cells of five adult WT male mice. (B–F) Detection of THTs mRNA expression levels in FACS-sorted SVZ cells: Slc16a2/Mct8 (B), Slco1c1/Oatp1c1 (C), Slc16a10/Mct10 (D), Slc7a5/Lat1 (E), Slc7a8/Lat2 (F). (G and H) Detection of TH receptor mRNA expression levels in FACS-sorted SVZ cells: Thra1 (G) and Thra2 (H). (I) Gene expression analysis of TH-responsive gene Klf9. n = 3–5 samples per cell population, Kruskal-Wallis test followed by permutation test, p < 0.05, ∗∗p < 0.01. Data are presented in boxplots with medians, minimum, and maximum values.
Figure 3
Figure 3
DKO Adult Mice Differentially Affect NSC and Progenitor Proliferation within the Lateral SVZ (A) Representative images of proliferative NSCs (Sox2+KI67+) within the lateral SVZ from WT and DKO adult male mice. Less proliferative NSCs are observable in DKO mice. (B and C) Statistical analysis revealed significantly decreased SOX2+ NSCs (B) and SOX2+KI67+ proliferative NSCs (C) in the lateral SVZ of DKO mice as compared with WT mice (n = 3 mice per group and n = 2–5 sections per mouse, t test, ∗∗∗p < 0.001). (D) Representative images of proliferative NSCs (SOX2+KI67+GFAP+) after plating primary neurospheres following a 24-h period under a low growth factor condition. DKO mice show less proliferative NSCs. (E) DKO mice display a significant decreased SOX2+KI67+GFAP+ proliferative NSCs as compared with WT mice (n = 3–5 mice per group and n = 30 images per condition, Mann-Whitney test, ∗∗∗p < 0.001). (F) Representative images of floating NS II and NS IX derived from lateral SVZ of adult male WT and DKO mice. (G) The neurosphere formation in WT mice significantly decreased after nine passages (NS IX), whereas the number of neurospheres is maintained in DKO mice (n = 3 wells per condition, two-way ANOVA followed by Bonferroni's test, ∗∗∗p < 0.0001). Bars represent mean ± SEM. Scale bars: 30 μm (A and D) and 250 μm (F). LV, lateral ventricle.
Figure 4
Figure 4
DKO Adult Mice Display Reduced SVZ-Derived NPCs and Impaired Neuroblast Migration within the SVZ (A) Representative images of NPCs (DLX2+) and neuroblasts (DCX+) within the lateral SVZ from WT and DKO adult male mice. (B–D) Quantification of uncommitted (DLX2+ cells) and committed (DLX2+DCX+ cells) neural progenitors and mature neuroblasts (DCX+ cells) within the lateral SVZ of WT and DKO male mice. DKO mice display reduced density of uncommitted (B) and committed (C) neural progenitors as compared with WT mice. In contrast, the density of mature neuroblasts (D) increased in DKO mice as compared with WT mice (n = 3 mice per group and n = 2–5 sections per mouse, t test, p < 0.05, ∗∗p < 0.01). (E) Representative images of the migration calculation method. Migrating cells can be seen as mixed cell outgrowth constituted by both individual and chain cells that migrate from neurospheres. The migration distance is determined using a line-drawing tool under Fiji software. The lines are drawn from the outline of the neurospheres to the center of the migrating cells. All cells that migrate from the neurospheres are considered. The two other images represent plated SVZ neurospheres generated from WT and DKO mice following a 3-day period under a low growth factor condition. (F) In vitro measurement of neural precursor migration away from plated primary neurospheres shows reduced migration distance per neurosphere in DKO mice (n = 5 neurospheres per condition, Mann-Whitney test, p < 0.05). (G) Short-term olfactory memory behavioral test. The graph represents the time spent by WT and DKO mice to investigate the odor during the first presentation, the habituation phase (2-min later), and the two-memory phase (after 30-min and 1-h rest period). The short-term olfactory memory is impaired in DKO mice, as shown by the increase of the investigation time 30 min and 1 h after the first exposure (n = 3–5 mice per group, n = 3 experiments, two-way ANOVA followed by Bonferroni's multiple comparisons test to compare the four presentations and to compared WT and DKO mice, ∗∗∗p < 0.001). Bars represent mean ± SEM. Scale bars: 30 μm (A) and 250 μm (E).
Figure 5
Figure 5
DKO Adult Mice Display Reduced SVZ-Derived OPCs within the Corpus Callosum but not within the SVZ (A) Representative images of OPCs (OLIG2+ and SOX10+) within the lateral SVZ from WT and DKO adult male mice. (B and C) Quantification of OLIG2+ (B) and SOX10+ (C) OPCs into the lateral SVZ demonstrate no density difference between WT and DKO mice (n = 3 mice per group and n = 2–5 sections per mouse, Mann-Whitney test, p > 0.05 non-significant). (D) Representative images of OPCs (OLIG2+ and SOX10+) within the corpus callosum from WT and DKO adult male mice. (E and F) DKO mice display a significant decreased OLIG2+ (E) and SOX10+ (F) OPCs density in the corpus callosum as compared with WT mice (n = 3 mice per group and n = 2–5 sections per mouse, t test, ∗∗∗p < 0.001). Bars represent mean ± SEM. Scale bars: 30 μm (A) and 60 μm (D).

Similar articles

Cited by

References

    1. Alvarez-Dolado M., Ruiz M., Del Río J.A., Alcántara S., Burgaya F., Sheldon M., Nakajima K., Bernal J., Howell B.W., Curran T. Thyroid hormone regulates reelin and dab1 expression during brain development. J. Neurosci. 1999;19:6979–6993. - PMC - PubMed
    1. Andrade N., Komnenovic V., Blake S.M., Jossin Y., Howell B., Goffinet A., Schneider W.J., Nimpf J. ApoER2/VLDL receptor and Dab1 in the rostral migratory stream function in postnatal neuronal migration independently of Reelin. Proc. Natl. Acad. Sci. 2007;104:8508–8513. - PMC - PubMed
    1. Astapova I., Hollenberg A.N. The in vivo role of nuclear receptor corepressors in thyroid hormone action. Biochim. Biophys. Acta - Gen. Subj. 2013;1830:3876–3881. - PMC - PubMed
    1. Ayuso-Sacido A., Moliterno J.A., Kratovac S., Kapoor G.S., O’Rourke D.M., Holland E.C., García-Verdugo J.M., Roy N.S., Boockvar J.A. Activated EGFR signaling increases proliferation, survival, and migration and blocks neuronal differentiation in post-natal neural stem cells. J. Neurooncol. 2010;97:323–337. - PubMed
    1. Barres B.A., Lazar M.A., Raff M.C. A novel role for thyroid hormone, glucocorticoids and retinoic acid in timing oligodendrocyte development. Development. 1994;120:1097–1108. - PubMed

Publication types

MeSH terms

LinkOut - more resources