. 2021 Jan 21;184(2):384-403.e21.
doi: 10.1016/j.cell.2020.12.031. Epub 2021 Jan 14.

Spliceosome-targeted therapies trigger an antiviral immune response in triple-negative breast cancer

Affiliations

Spliceosome-targeted therapies trigger an antiviral immune response in triple-negative breast cancer

Elizabeth A Bowling et al. Cell. .

Abstract

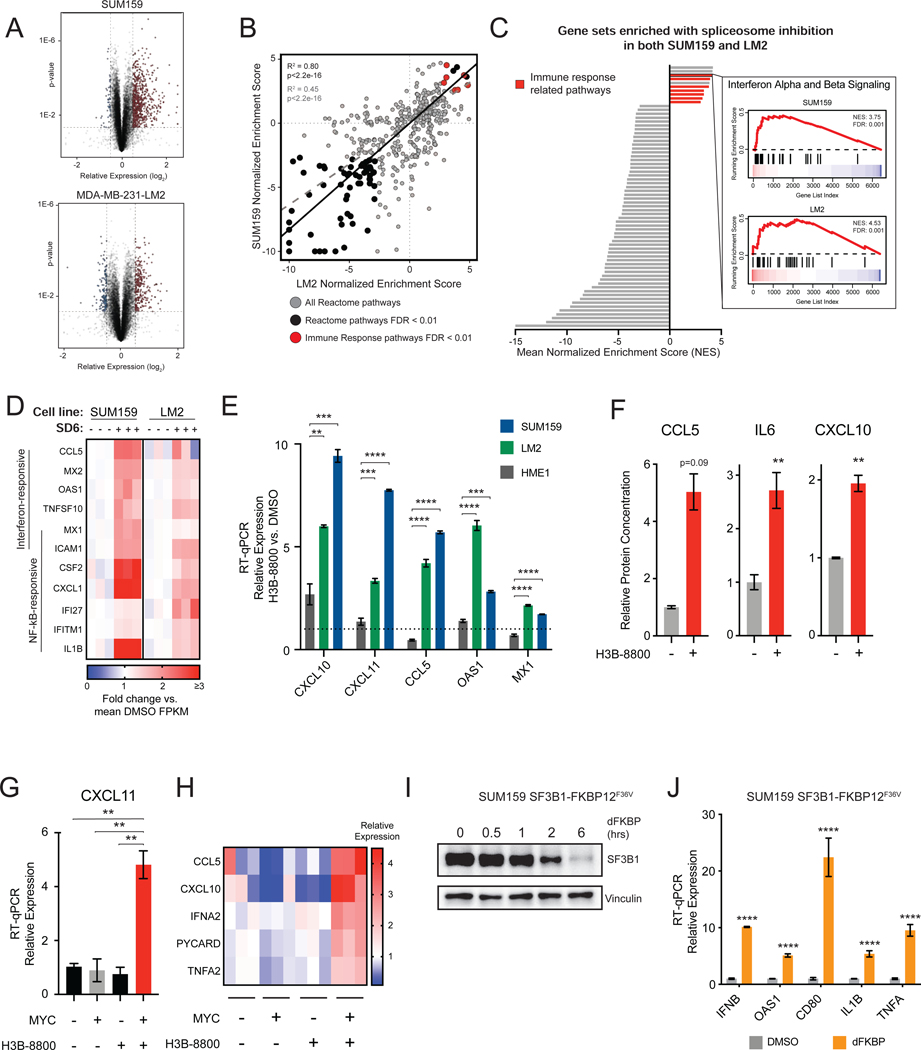
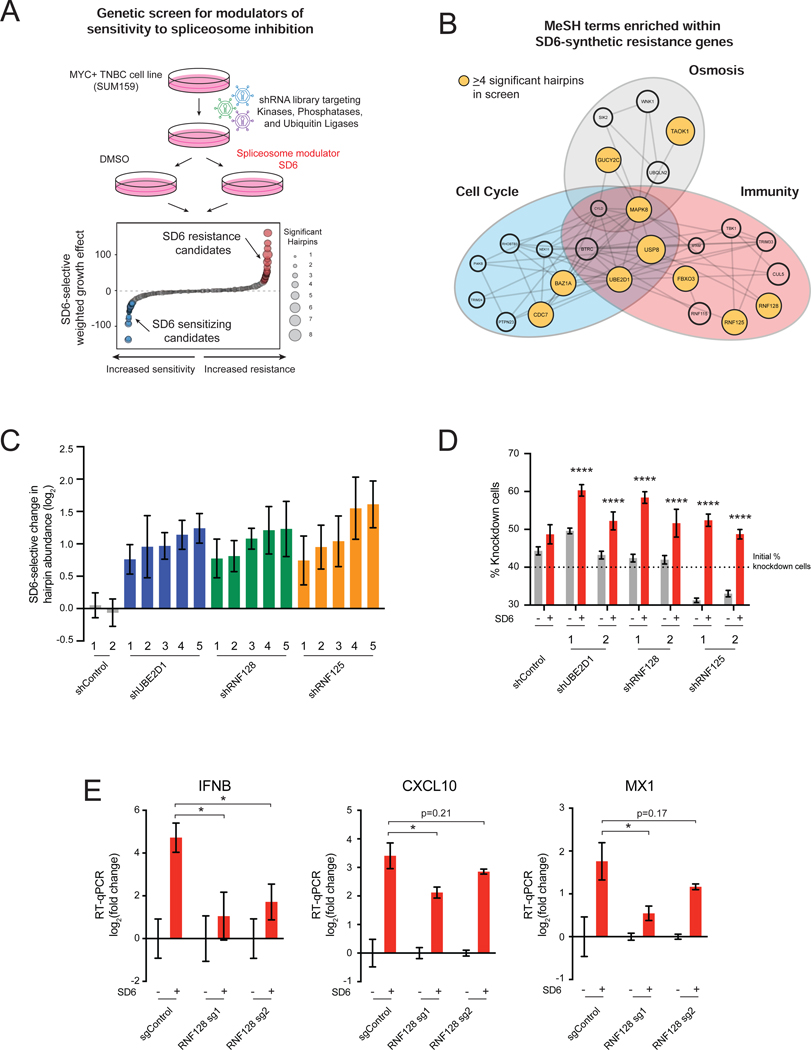
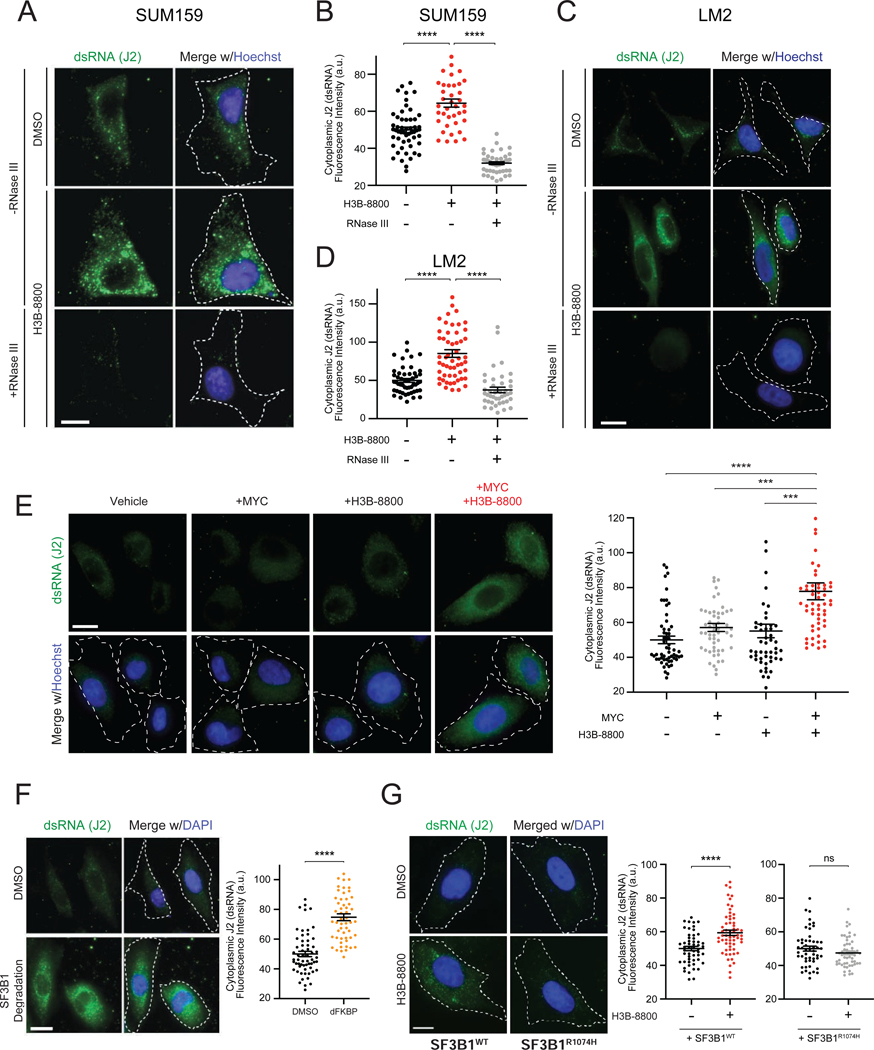
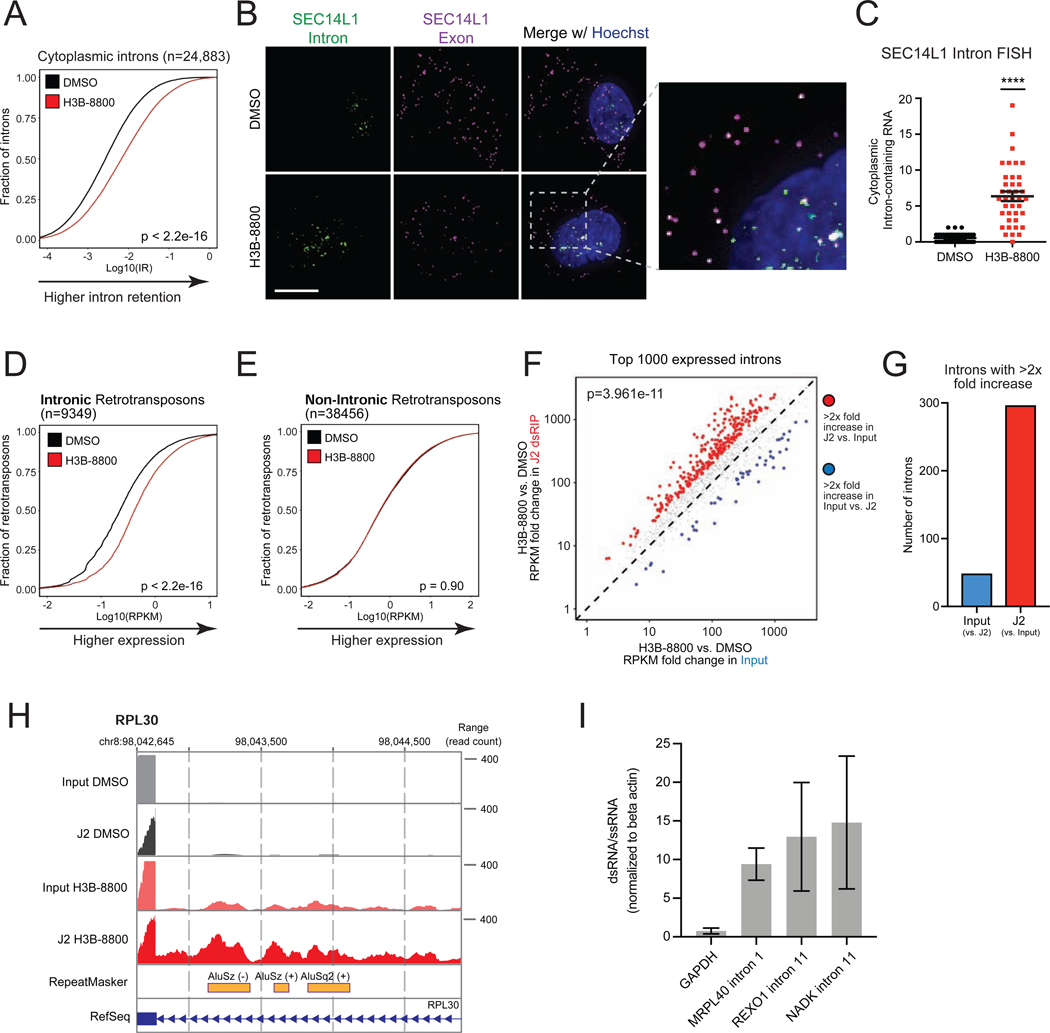
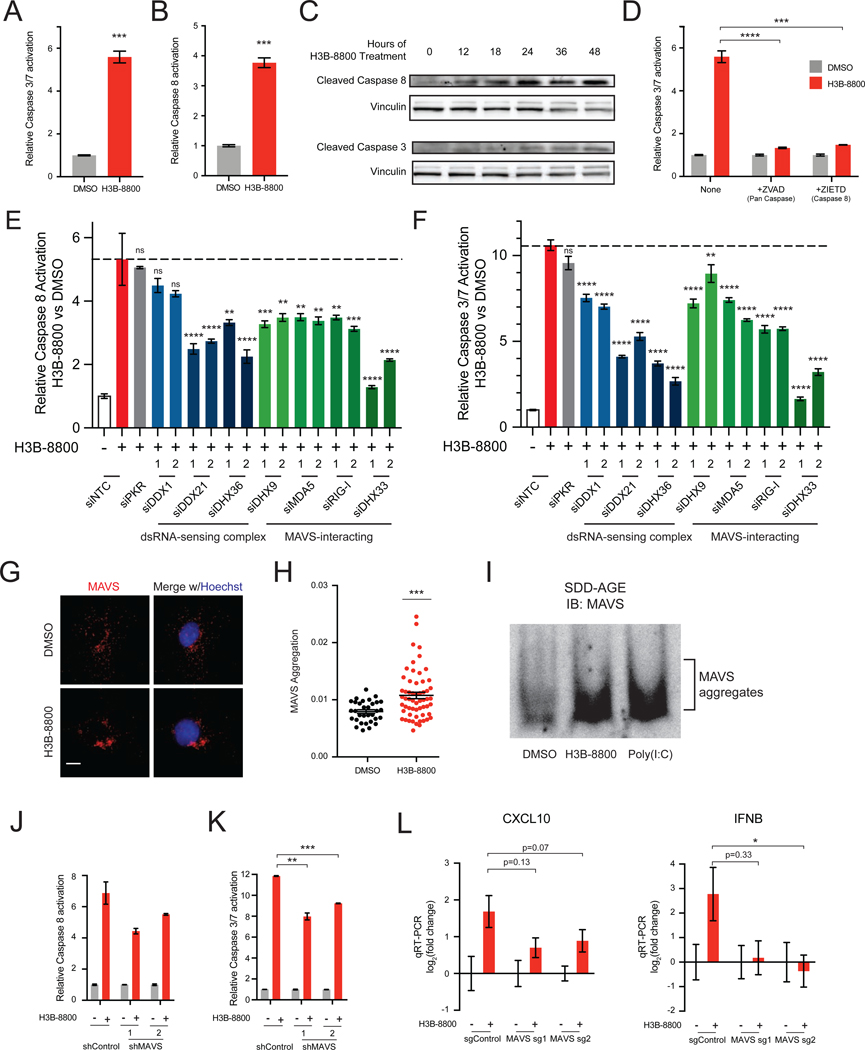
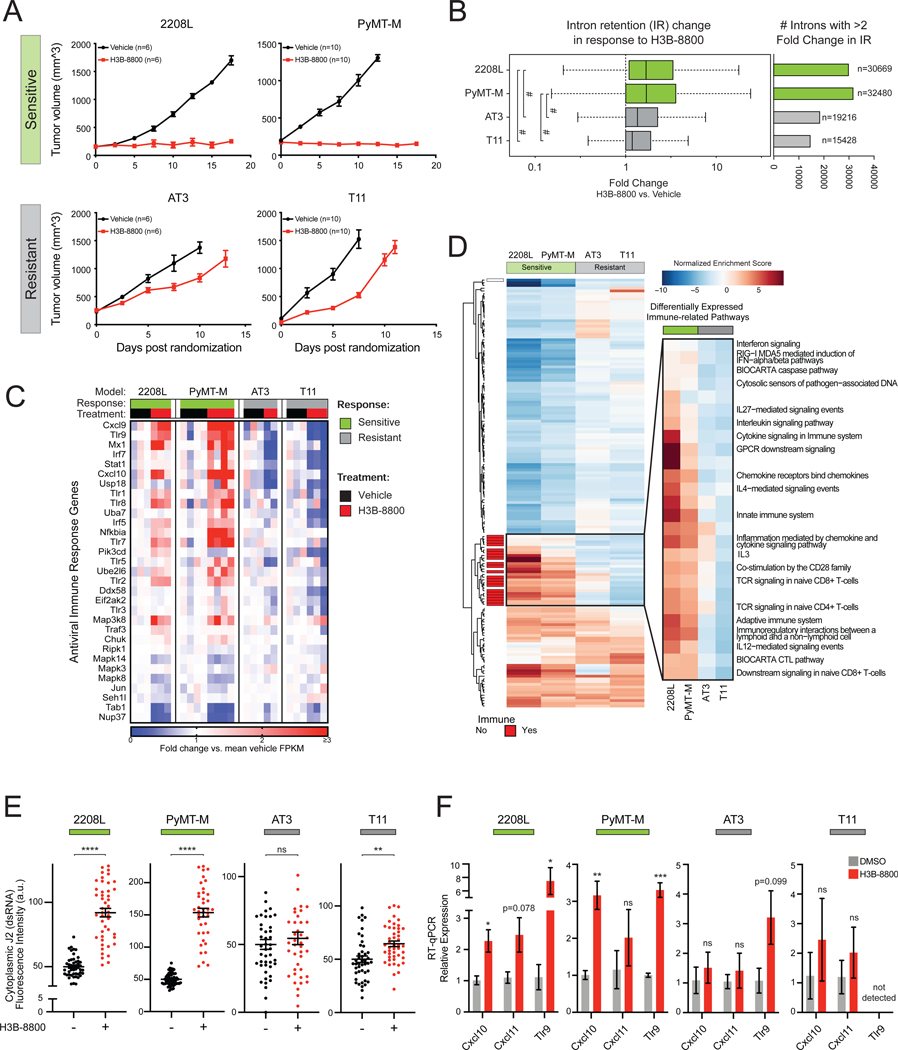
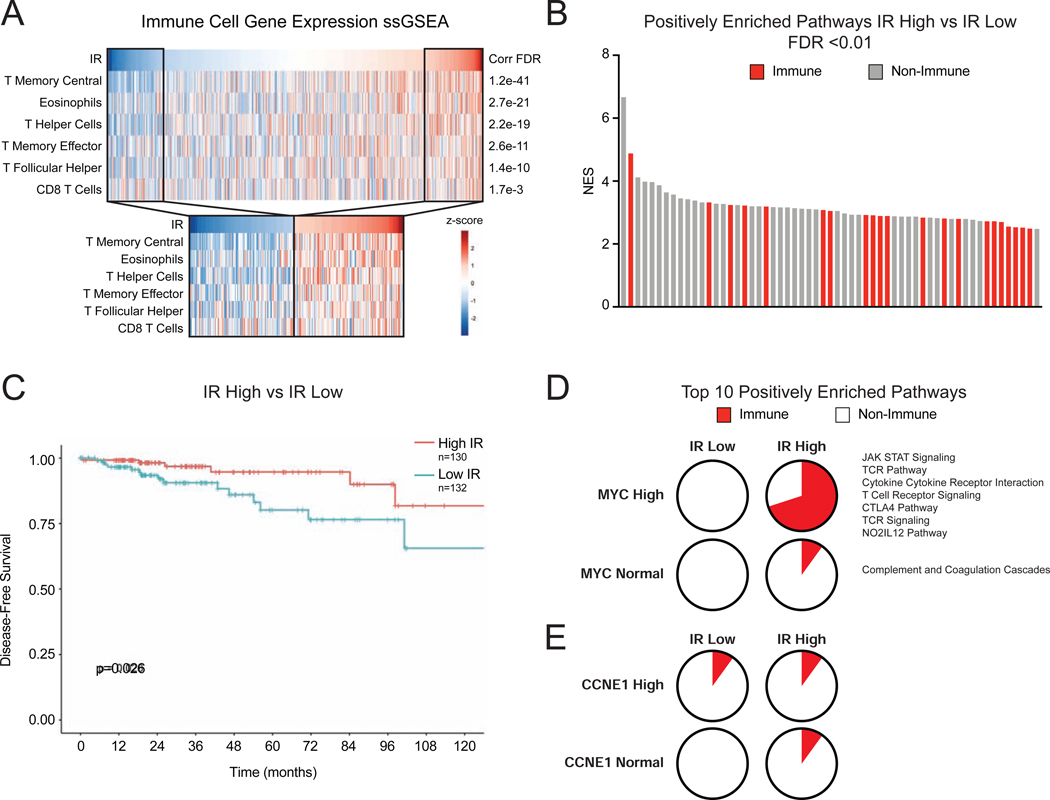
Many oncogenic insults deregulate RNA splicing, often leading to hypersensitivity of tumors to spliceosome-targeted therapies (STTs). However, the mechanisms by which STTs selectively kill cancers remain largely unknown. Herein, we discover that mis-spliced RNA itself is a molecular trigger for tumor killing through viral mimicry. In MYC-driven triple-negative breast cancer, STTs cause widespread cytoplasmic accumulation of mis-spliced mRNAs, many of which form double-stranded structures. Double-stranded RNA (dsRNA)-binding proteins recognize these endogenous dsRNAs, triggering antiviral signaling and extrinsic apoptosis. In immune-competent models of breast cancer, STTs cause tumor cell-intrinsic antiviral signaling, downstream adaptive immune signaling, and tumor cell death. Furthermore, RNA mis-splicing in human breast cancers correlates with innate and adaptive immune signatures, especially in MYC-amplified tumors that are typically immune cold. These findings indicate that dsRNA-sensing pathways respond to global aberrations of RNA splicing in cancer and provoke the hypothesis that STTs may provide unexplored strategies to activate anti-tumor immune pathways.

Keywords: MYC; RNA splicing in cancer; anti-cancer immunity; antiviral immunity; double-stranded RNA; oncogenic stress; spliceosome-targeted therapies; triple-negative breast cancer; viral mimicry.


Conflict of interest statement

Declaration of interests The authors declare no competing interests.

Figures

Figure 1.
Figure 1.. Spliceosome-Targeted Therapies Stimulate Antiviral Signaling in MYC-Driven Triple-Negative Breast Cancer
(A) Volcano plot of RNA-seq gene expression changes due to spliceosome inhibition for two MYC-driven TNBC cell lines, SUM159 and LM2, treated with SD6 or DMSO (n=3 biological replicates). (B, C) Spliceosome inhibition leads to activation of immune signatures in MYC+ TNBC cells. (B) Scatterplot of gene sets enriched in SUM159 and LM2 after SD6 treatment. Gene sets with FDR <0.01 in both cell lines are black. Immune-related gene sets are red. Pearson correlation between all pathways shown as dashed gray line (R2 =0.45, p<2.2e-16); between pathways with FDR<0.01 as black line (R2=0.80, p<2.2e-16). (C) Immune-related transcriptional pathways are among the most positively enriched. Gene sets with FDR <0.01 in both cell lines are shown, with immune-related gene sets in red (7 of 10 positively enriched pathways). The GSEA trace of Interferon Alpha and Beta Signaling is shown as an example. (D) Spliceosome inhibition with SD6 leads to activation of interferon stimulated and NF-kB responsive genes. Heatmap of RNA-seq data shows relative expression (mean FPKM fold change vs. DMSO) of leading edge genes from enriched immune-related transcriptional pathways in panel (C). (E) Spliceosome inhibition activates antiviral signaling in TNBC cells but not in non-transformed MECs. SUM159 and LM2 and non-transformed MECs (HME1) were treated with the same dose of H3B-8800. Gene expression assayed by RT-qPCR. (F) Spliceosome inhibition leads to production of cytokines and chemokines. Conditioned media from SUM159 cells ± H3B-8800 was measured for CCL5, IL6, and CXCL10 (mean ± SEM, n=2 technical replicates, two-tailed unpaired Student’s t-test). (G, H) MYC hyperactivation primes antiviral transcriptional changes in response to spliceosome inhibition. HMECs with inducible MYC were treated ± 4-OHT (to induce MYC) ± H3B-8800. Transcription of (G) CXCL11 and (H) other antiviral signaling targets was assayed by RT-qPCR. (I, J) Chemical genetic degradation of SF3B1 upregulates interferon-stimulated and NF-kB responsive genes. SUM159s engineered with endogenous SF3B1 knockout and exogenous SF3B1-FKBP12F36V cDNA expression were (I) treated with dFKBP ligand to deplete SF3B1. (J) Gene expression assayed by RT-qPCR. Bar plots of RT-qPCR data in (E), (G), and (J) are expressed relative to DMSO (mean ± SEM, n=3 biological replicates, two-tailed unpaired Student’s t-test). **p<0.01, ***p<0.001, **** p<0.0001. See also Figure S1.
Figure 2.
Figure 2.. Components of Antiviral Response Pathways Modulate Sensitivity to Spliceosome Inhibition
(A, B) Immunity-related genes confer resistance to spliceosome inhibition. (A) shRNA screen for genes that modulate sensitivity to spliceosome-targeted therapies. SUM159 cells were transduced with an shRNA library and cultured ± SD6. Waterfall plot shows combined SD6-selective growth effect of each gene, calculated as a weighted effect of knockdown by multiple shRNAs. SD6 resistance candidates are red. SD6 sensitizing candidates are blue. (B) MeSH term enrichment analysis of top 50 resistance candidates. Enriched MeSH terms (FDR<0.1) grouped by related function. Node size represents number of shRNAs that significantly conferred resistance (≥4 significant shRNAs highlighted in yellow). (C, D) Knockdown of UBE2D1, RNF128, and RNF125 confers resistance to spliceosome inhibition. (C) For each gene, the top five independent shRNAs from the screen are plotted along with two negative control shRNAs. log2 (fold change) calculated based on change in shRNA abundance in SD6 vs. DMSO (mean ± SEM, n=4 biological replicates). shRNAs with log2 (fold change) > 0.5 and p-value ≤ 0.05 shown. (D) SUM159 cells transduced with RNF128, RNF125, or UBE2D1-targeting or control shRNAs were mixed (40%) with SUM159-E2 Crimson cells (60%) and cultured ± SD6. Shown is the percentage of cells expressing a given shRNA for DMSO and SD6 treated samples (mean ± SEM, n=6 biological replicates, two-tailed unpaired Student’s t-test). (E) RNF128 is required for SD6-induced antiviral signaling. SUM159 cells expressing two RNA128-targeting or negative control sgRNAs were tested for expression of IFNB, CXCL10, and MX1 ± SD6 treatment. Data shown as expression relative to DMSO (mean ± SEM, n=3 biological replicates, two-tailed unpaired Student’s t-test). *p<0.05, ****p<0.0001. See also Figure S2 and Tables S1 and S2.
Figure 3.
Figure 3.. Spliceosome-Targeted Therapies Cause Cytoplasmic Accumulation of Double-stranded RNA (dsRNA) in TNBC Cells
(A-D) Spliceosome inhibition induces cytoplasmic dsRNA accumulation. (A, C) Cellular dsRNA was evaluated with anti-dsRNA (J2) immunofluorescence (IF) in (A) SUM159 and (C) LM2 cells ± H3B-8800. RNase III treatment used as negative control for dsRNA signal. Scale bars, 10μm. Images representative of 3 experiments. (B, D) Quantification of cytoplasmic dsRNA signal intensity for (B) SUM159 and (D) LM2. (E) Spliceosome inhibition in combination with MYC hyperactivation induces cytoplasmic dsRNA accumulation. HMECs with inducible MYC were treated ± 4-OHT (to induce MYC) ± H3B-8800 and assessed for dsRNA with J2 antibody. Scale bars, 10μm. Right, quantification of cytoplasmic dsRNA signal. (F) SF3B1 degradation induces cytoplasmic dsRNA accumulation. Left, IF labeling of dsRNA (J2) in SUM159 SF3B1-FKBP12F36V cells ± dFKBP. Images representative of 2 experiments. Scale bars, 20μm. Right, quantification of cytoplasmic dsRNA signal. (G) Expression of spliceosome modulator-resistant SF3B1R1074H mutant suppresses accumulation of dsRNA after H3B-8800 treatment. Left, IF labeling of dsRNA (J2) in SUM159 cells expressing SF3B1WT and SF3B1R1074H ± H3B-8800. Scale bars, 10μm. Right, quantification of cytoplasmic dsRNA signal. All quantification plots of dsRNA signal intensity are mean ± SEM from >35 cells per group, two-tailed unpaired Student’s t-test. *p<0.05, ***p<0.001, ****p<0.0001. See also Figure S3.
Figure 4.
Figure 4.. Intron-Retained RNAs Accumulate in the Cytoplasm and Form dsRNA in Response to Spliceosome-Targeted Therapies
(A-C) Spliceosome inhibition leads to cytoplasmic intron retention in TNBC cells. (A) RNA-seq was performed on cytoplasmic RNA from SUM159 ± H3B-8800 and intron retention (IR) was assessed. Empirical cumulative distribution curves of mean IR scores (n=2 biological replicates) shown. A rightward shift in the red curve indicates increased IR (p<2.2e-16, Mann-Whitney U). (B) RNA fluorescence in situ hybridization (FISH) images of retained introns and surrounding exon sequences for SEC14L1 ± H3B-8800. Arrows indicate overlapped intron and exon foci. Scale bars, 10μm. (C) Quantification of cytoplasmic intron-retained mRNAs per cell (mean ± SEM from >35 cells per group, two-tailed unpaired Student’s t-test). (D, E) Intron-residing retrotransposons increase in abundance in the cytoplasm of TNBC cells after H3B-8800. Empirical cumulative distribution curves of mean RPKMs are plotted for (D) 9,349 intron-residing retrotransposons or (E) 38,456 non-intronic retrotransposons detected in RNA-seq. A rightward shift in the red curve indicates increased expression in intronic retrotransposons (p<2.2e-16, Mann-Whitney U) but not non-intronic retrotransposons (p = 0.90, Mann-Whitney U). (F, G, H) Retained introns induced by spliceosome inhibition form dsRNA. SUM159 cells ± H3B-8800 (n=2 biological replicates). dsRNA was enriched by J2 immunoprecipitation followed by poly(A) RNA-seq (J2 dsRIP-seq). (F) Scatterplot of intron expression fold changes ± H3B-8800 of the top 1000 introns ranked by expression (RPKM). (G) Number of retained introns with >2× increase in input or J2-dsRIP (compared to the other state). (H) Representative intron-embedded retrotransposons (RPL30 gene). (I) Introns retained after H3B-8800 form dsRNA structures. Lysates from SUM159 cells ± H3B-8800 were treated ± RNaseONE, a ssRNA specific ribonuclease. Relative RNA levels were quantified via RT-qPCR (mean ± SEM, n=3 biological replicates). Data shown are relative to ACTB mRNA, a well-characterized ssRNA. ****p<0.0001. See also Figure S4.
Figure 5.
Figure 5.. Spliceosome-Targeted Therapies Activate Extrinsic Apoptosis via Antiviral dsRNA Sensing Pathways
(A-D) Spliceosome inhibition activates apoptosis via extrinsic mechanisms. (A) Caspases-3 and −7 activity from SUM159s ± H3B-8800. (B) Caspase-8 activity from SUM159s ± H3B-8800. (C) Immunoblotting time course shows cleavage of caspase-8 precedes cleavage of caspase-3 in response to spliceosome inhibition in SUM159 cells. (D) H3B-8800-induced apoptosis requires the extrinsic initiator caspase-8. SUM159s ± H3B-8800 and no caspase inhibitor, pan-caspase inhibitor (ZVAD), or caspase-8 inhibitor (ZIETD) were measured for caspases-3 and −7. (E, F) Multiple dsRNA sensors contribute to activation of extrinsic apoptosis and downstream effector caspases upon spliceosome inhibition. SUM159 cells were transfected with control (NTC) siRNA or siRNA targeting the indicated genes, treated ± H3B-8800, and assessed for (E) caspase-8 and (F) caspases-3 and −7 (mean ± SEM, n≥3 biological replicates, one-way ANOVA with Dunnett’s multiple comparison test). (G-I) Spliceosome inhibition causes aggregation of the mitochondrial antiviral signaling protein MAVS. (G) MAVS immunofluorescence (IF) of SUM159 cells ± H3B-8800. Scale bars, 10μm. (H) MAVS aggregation quantified by inverse dispersal of IF signal (mean ± SEM, two-tailed unpaired Student’s t-test). (I) P5 mitochondrial fraction was prepared from SUM159 cells ± H3B-8800 or transfected with poly (I:C). MAVS aggregation analyzed by SDD-AGE. (J, K) Knockdown of MAVS suppresses activation of extrinsic apoptosis and downstream effector caspases upon spliceosome inhibition. SUM159 cells expressing control or MAVS-targeted shRNA were treated ± H3B-8800 and assessed for (J) caspase-8 and (K) caspases-3 and −7 (mean ± SEM, n=2 biological replicates, two-tailed unpaired Student’s t-test). (L) MAVS knockout suppresses upregulation of antiviral signaling in TNBC cells treated with H3B-8800. SUM159 cells expressing two independent MAVS sgRNAs assessed for CXCL10 and IFNB expression ± H3B-8800. Data shown relative to DMSO (mean ± SEM, n=3 biological replicates, two-tailed unpaired Student’s t-test). Bar plots in panels (A), (B), and (D) of caspase activity shown as mean ± SEM, n=3 biological replicates, two-tailed unpaired Student’s t-test. *p<0.05, **p<0.01, ***p<0.001, ****p<0.0001. See also Figure S5.
Figure 6.
Figure 6.. RNA Splicing Inhibition Induces Antiviral and Adaptive Signaling in Immune Competent Models of Breast Cancer
(A) H3B-8800 impairs tumor progression heterogeneously across syngeneic murine TNBC tumor models. 2208L and PyMT-M tumor progression was significantly impaired (termed sensitive), while AT3 and T11 tumors progressed (termed resistant) (mean ± SEM number of animals plotted). (B) H3B-8800 results in higher global intron retention in sensitive tumor models (p<2.2e-16, Mann-Whitney U). Boxplot (left) of transcriptome-wide IR scores. Bar plot (right) indicates number of introns with >2-fold change in IR in H3B-8800 vs. Vehicle-treated tumors. (C) H3B-8800 stimulates expression of antiviral signaling genes in sensitive tumor models. Genes shown are part of KEGG and Reactome antiviral signaling-related pathways. Relative expression calculated as mean FPKM fold change vs. vehicle. (D) Immune pathways are strongly induced by H3B-8800 in sensitive tumor models but not in resistant tumor models. Pathways shown from MSigDB C2 Canonical Pathways have GSEA FDR<0.05 in either both of the sensitive or both of the resistant models. Immune pathways (red) are annotated based on leading edge genes. (E) Spliceosome inhibition leads to accumulation of cytoplasmic dsRNA in sensitive syngeneic models of TNBC in vitro. Cell lines derived from syngeneic mouse TNBC models were assessed for cytoplasmic dsRNA using J2-immunofluorescence. Quantification of cytoplasmic dsRNA signal intensity shown (mean ± SEM from ≥40 cells per group, two-tailed unpaired Student’s t-test). (F) H3B-8800 induces transcriptional activation of antiviral immune signaling in sensitive syngeneic models of TNBC in vitro. Cell lines were treated with H3B-8800 and immune transcriptional activation was measured via RT-qPCR. Data are relative to DMSO (mean ± SEM, n=3 biological replicates, two-tailed unpaired Student’s t-test). *p<0.05, **p<0.01, ***p<0.001, ****p<0.0001, #p<2.2e-16. See also Figure S6 and Table S3.
Figure 7.
Figure 7.. Defects in RNA Splicing and MYC Amplification Associate with Immune Response in Human Breast Cancer
(A) Intron retention (IR) correlates with signatures of immune infiltration in human breast cancer. Scores from ssGSEA analysis of immune cell gene signatures were computed and correlated to IR levels in BRCA tumors (n=983) in TCGA. Heatmaps show IR level across tumors and ssGSEA scores for signatures that have Pearson correlation q-value of <0.01, ranked by q-value. Subset heatmaps show tumors with IR level >1 z-score from the mean. (B) Immune-related gene sets are enriched in tumors with high IR. GSEA with MSigDB C2 Canonical Pathways was used to compare gene expression of tumors with high vs. low IR (>1 z-score from mean). Bar plot of NES of positively enriched gene sets (FDR <0.01). Red indicates immune-related gene set. (C) Tumors with high IR have improved disease-free survival (DFS). Kaplan-Meier plot shows DFS for patients with breast tumors (TCGA). High IR tumors have improved DFS (p=0.026, log-rank test). (D, E) MYC-amplified breast tumors exhibit increased IR-associated immune signaling pathway activity. GSEA was used to compare gene expression patterns of human tumors divided into cohorts based on IR levels and MYC amplification. (D) Pie charts represent the percent of immune-related pathways among the top 10 enriched pathways ranked by NES. In the High IR, High MYC cohort, 7 of 10 pathways are related to immune signaling. (E) In comparison, CCNE1 amplified tumors do not exhibit increased IR-associated immune signaling. See also Figure S7 and Table S4.

Comment in

References

    1. Aird D, Teng T, Huang C-L, Pazolli E, Banka D, Cheung-Ong K, Eifert C, Furman C, Wu ZJ, Seiler M, et al., 2019. Sensitivity to splicing modulation of BCL2 family genes defines cancer therapeutic strategies for splicing modulators. Nat. Commun 10, 137. - PMC - PubMed
    1. Al-Kuraya K, Schraml P, Torhorst J, Tapia C, Zaharieva B, Novotny H, Spichtin H, Maurer R, Mirlacher M, Köchli O, et al., 2004. Prognostic relevance of gene amplifications and coamplifications in breast cancer. Cancer Res. 64, 8534–8540. - PubMed
    1. Andrejeva J, Childs KS, Young DF, Carlos TS, Stock N, Goodbourn S, Randall RE, 2004. The V proteins of paramyxoviruses bind the IFN-inducible RNA helicase, mda-5, and inhibit its activation of the IFN- promoter. Proc. Natl. Acad. Sci 101, 17264–17269. - PMC - PubMed
    1. Arimoto K, Takahashi H, Hishiki T, Konishi H, Fujita T, Shimotohno K, 2007. Negative regulation of the RIG-I signaling by the ubiquitin ligase RNF125. Proc. Natl. Acad. Sci. U. S. A 104, 7500–5. - PMC - PubMed
    1. Aulmann S, Adler N, Rom J, Helmchen B, Schirmacher P, Sinn HP, 2006. c-myc amplifications in primary breast carcinomas and their local recurrences. J. Clin. Pathol 59, 424–428. - PMC - PubMed

Publication types

MeSH terms