. 2021 Jan 21;184(2):422-440.e17.
doi: 10.1016/j.cell.2020.12.033. Epub 2021 Jan 14.

A basophil-neuronal axis promotes itch

Affiliations

A basophil-neuronal axis promotes itch

Fang Wang et al. Cell. .

Abstract

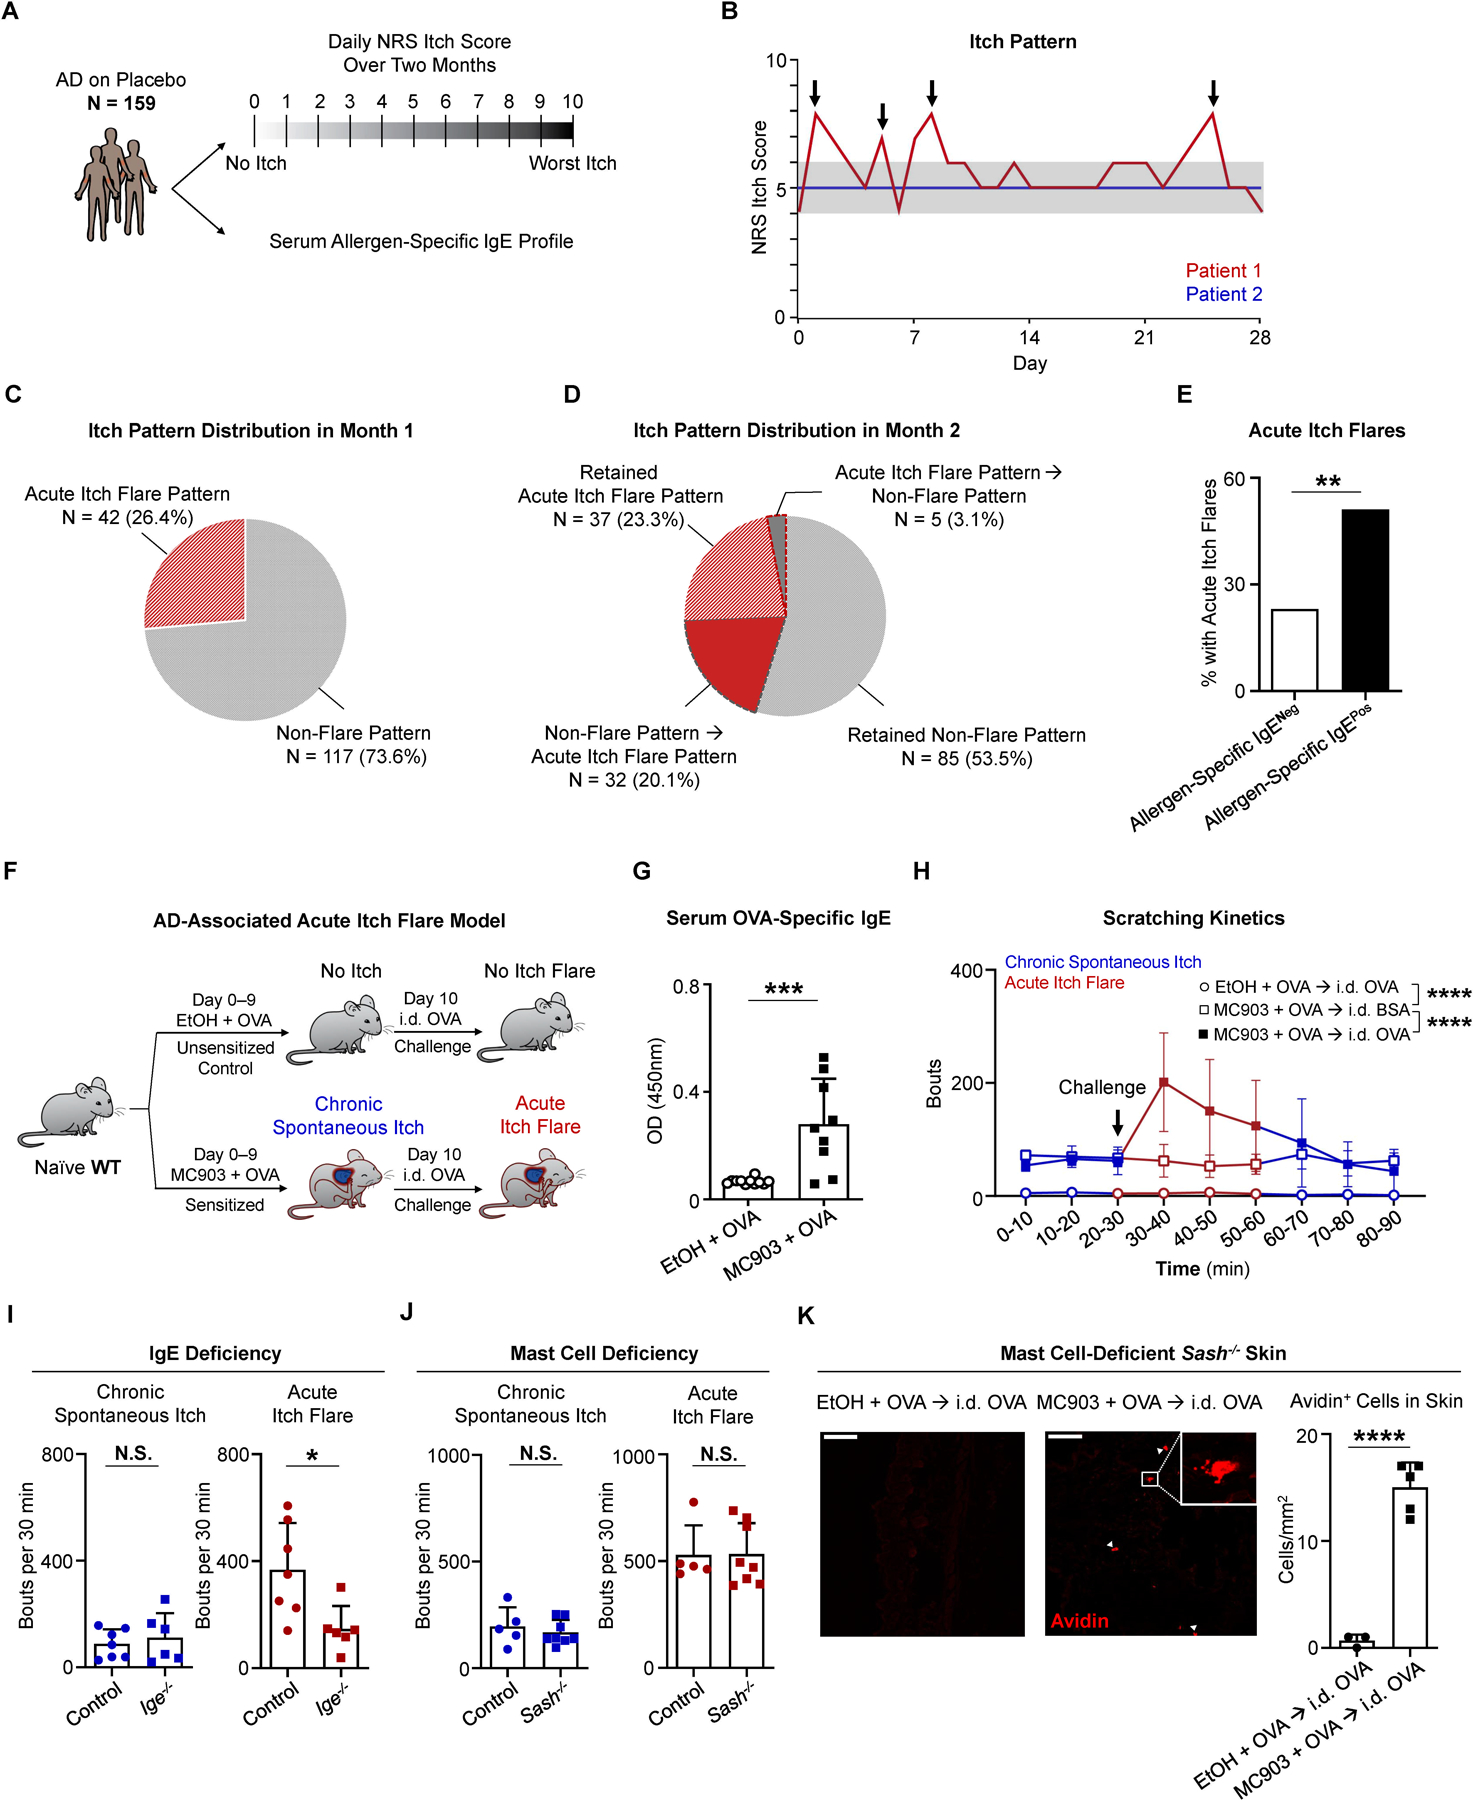
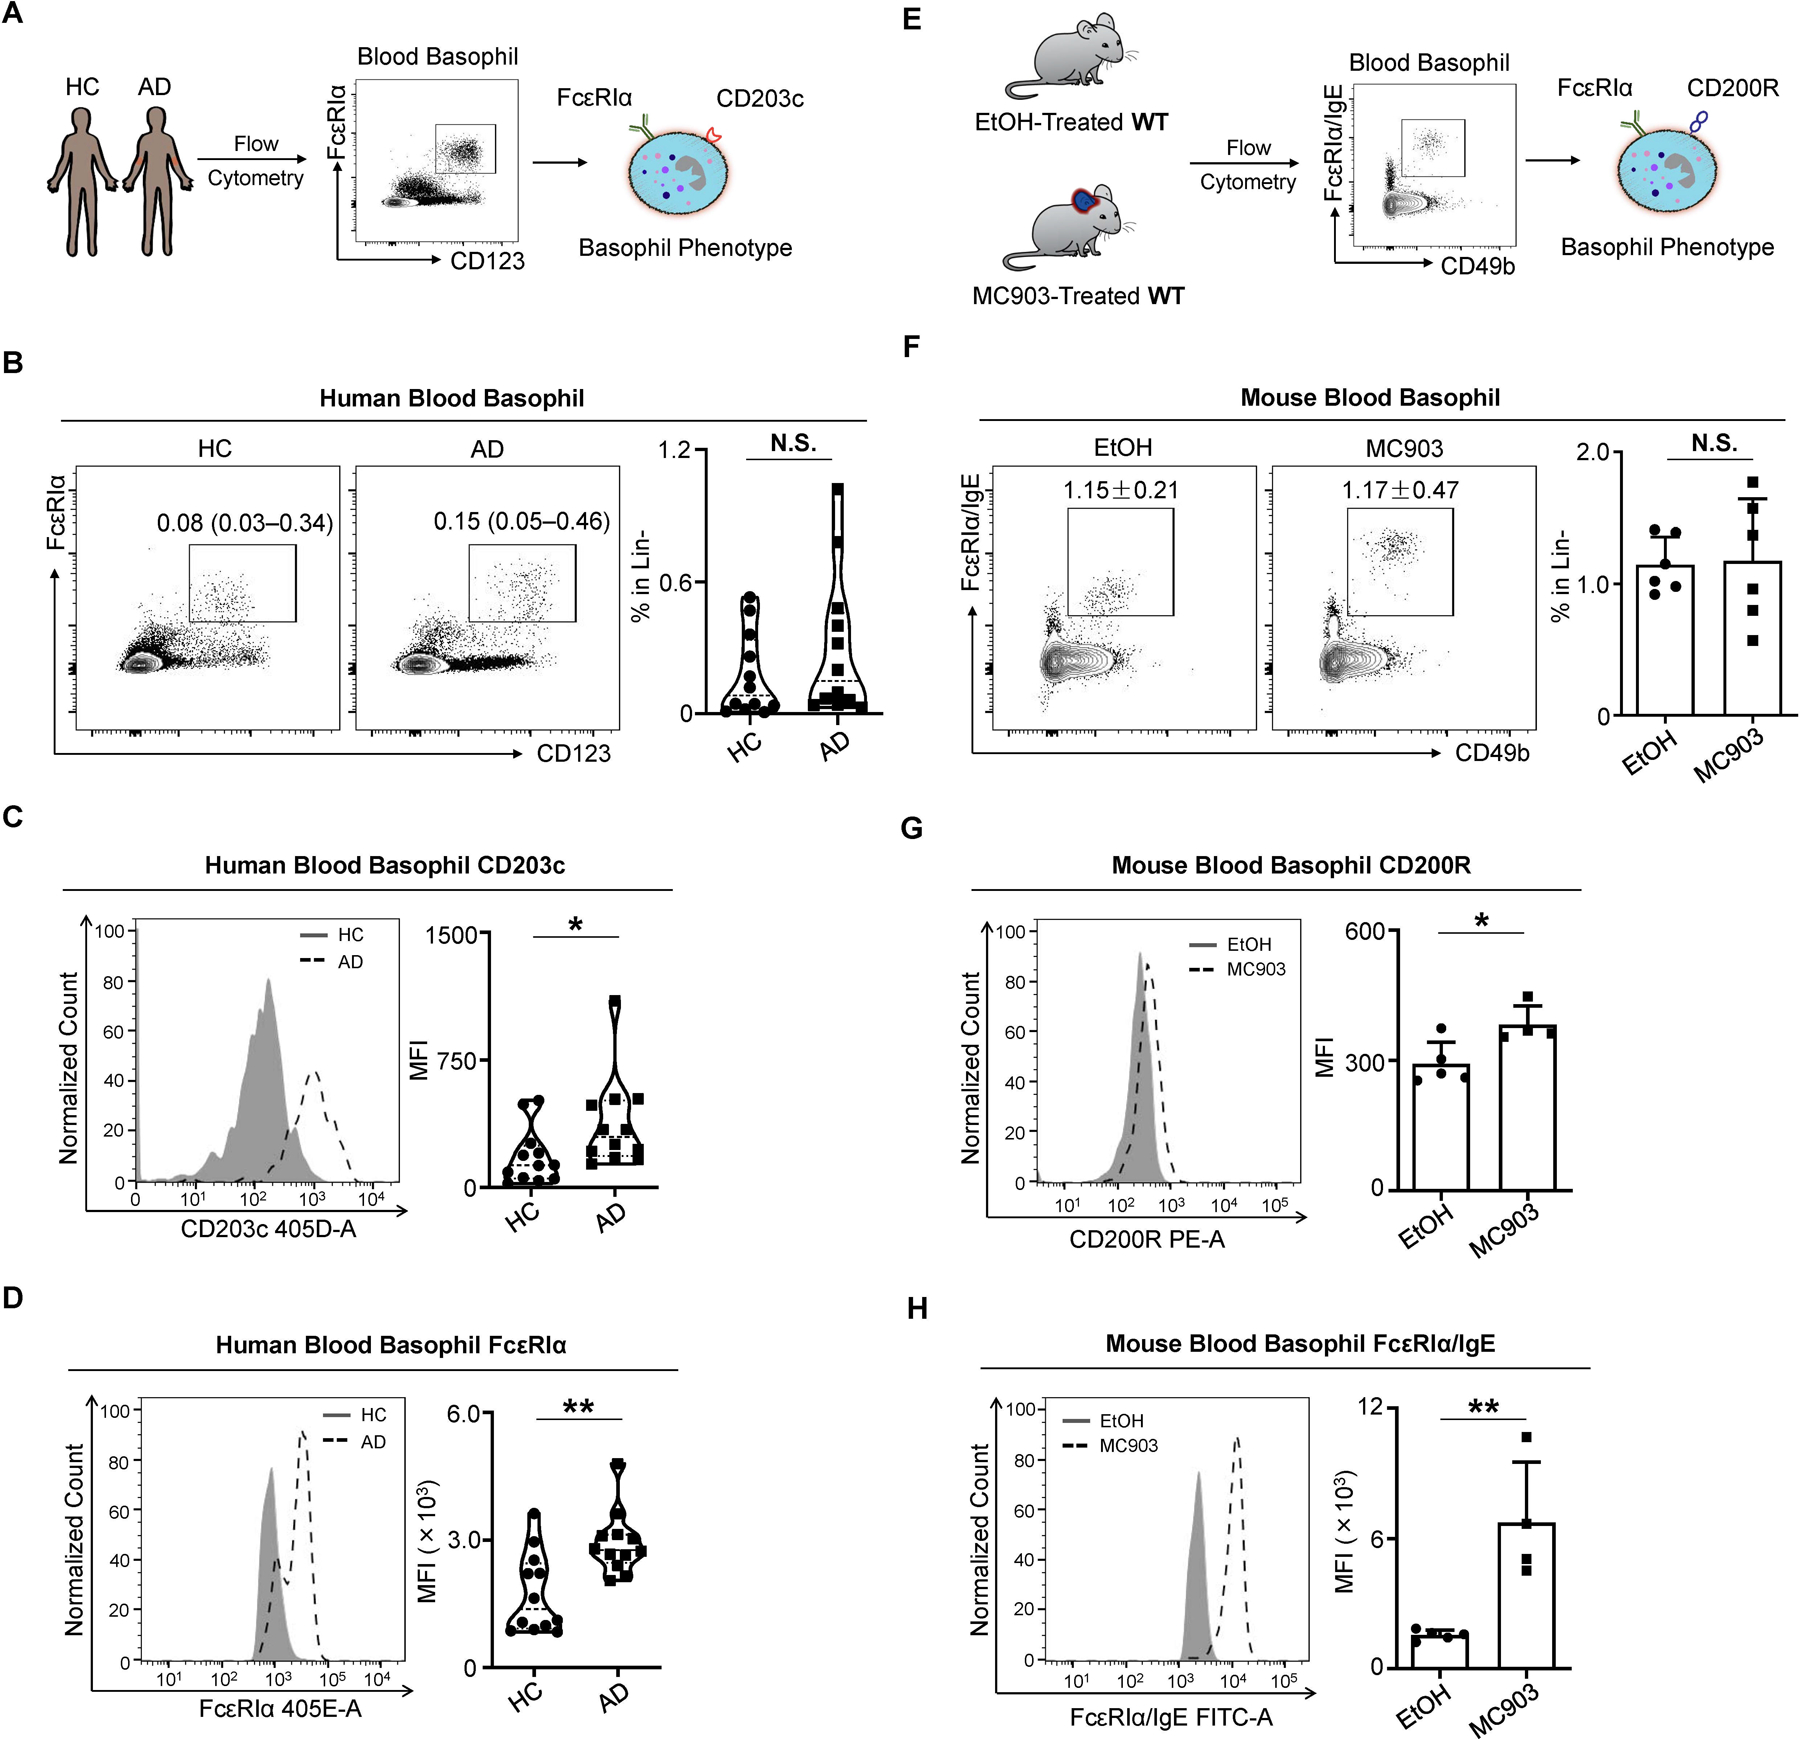
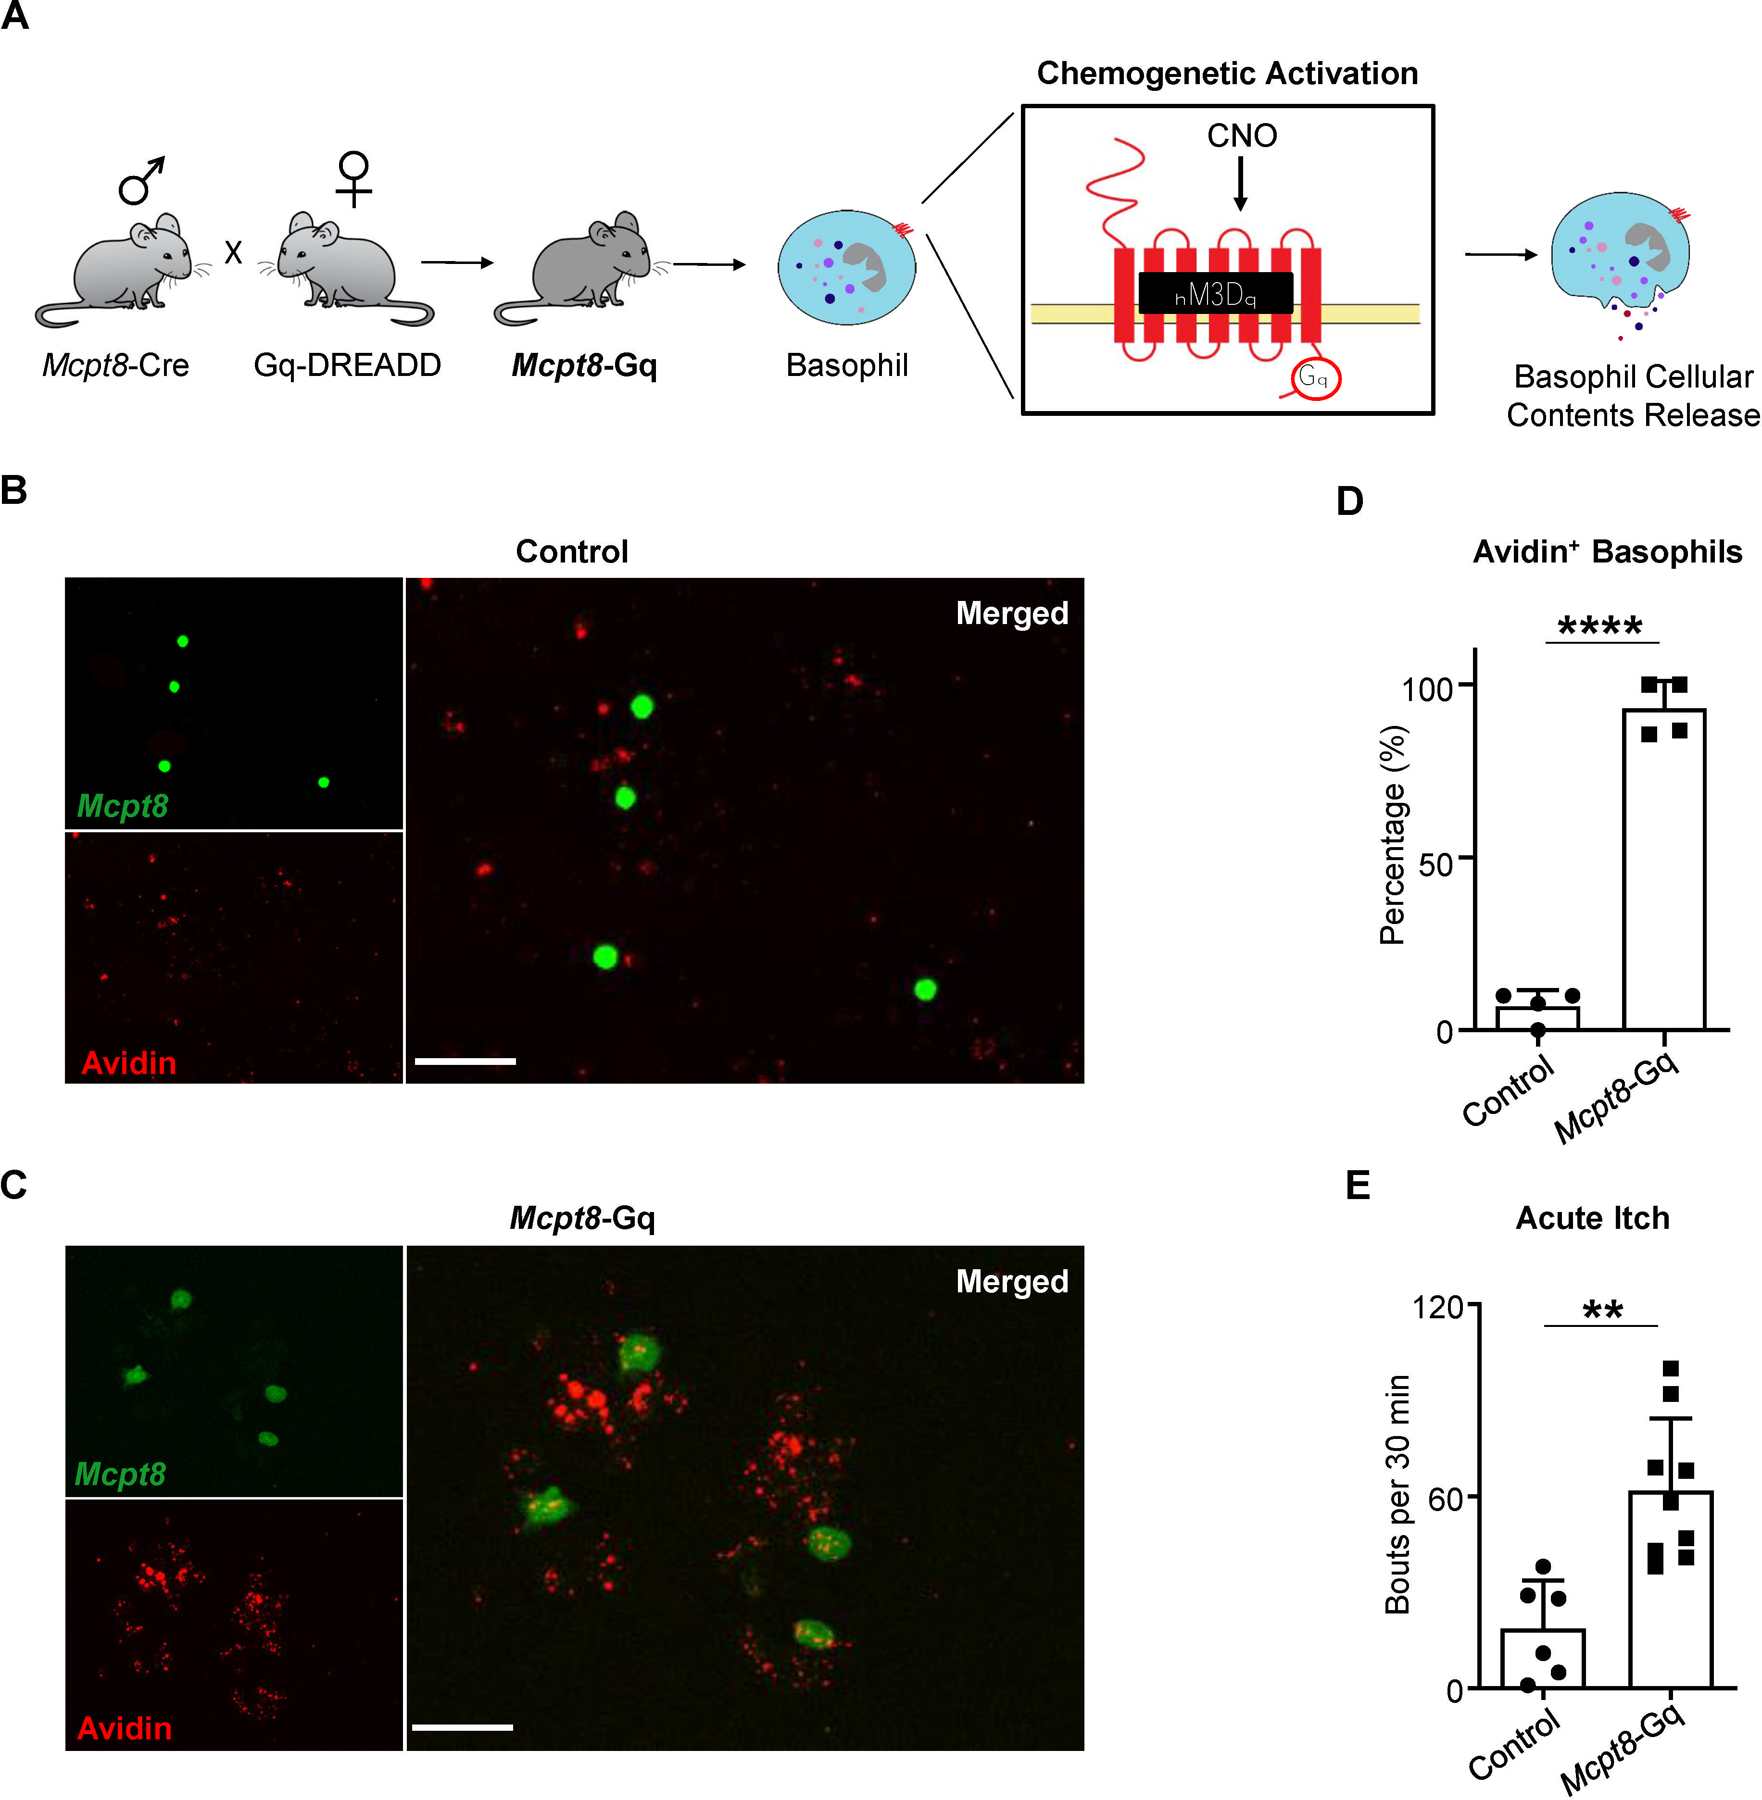
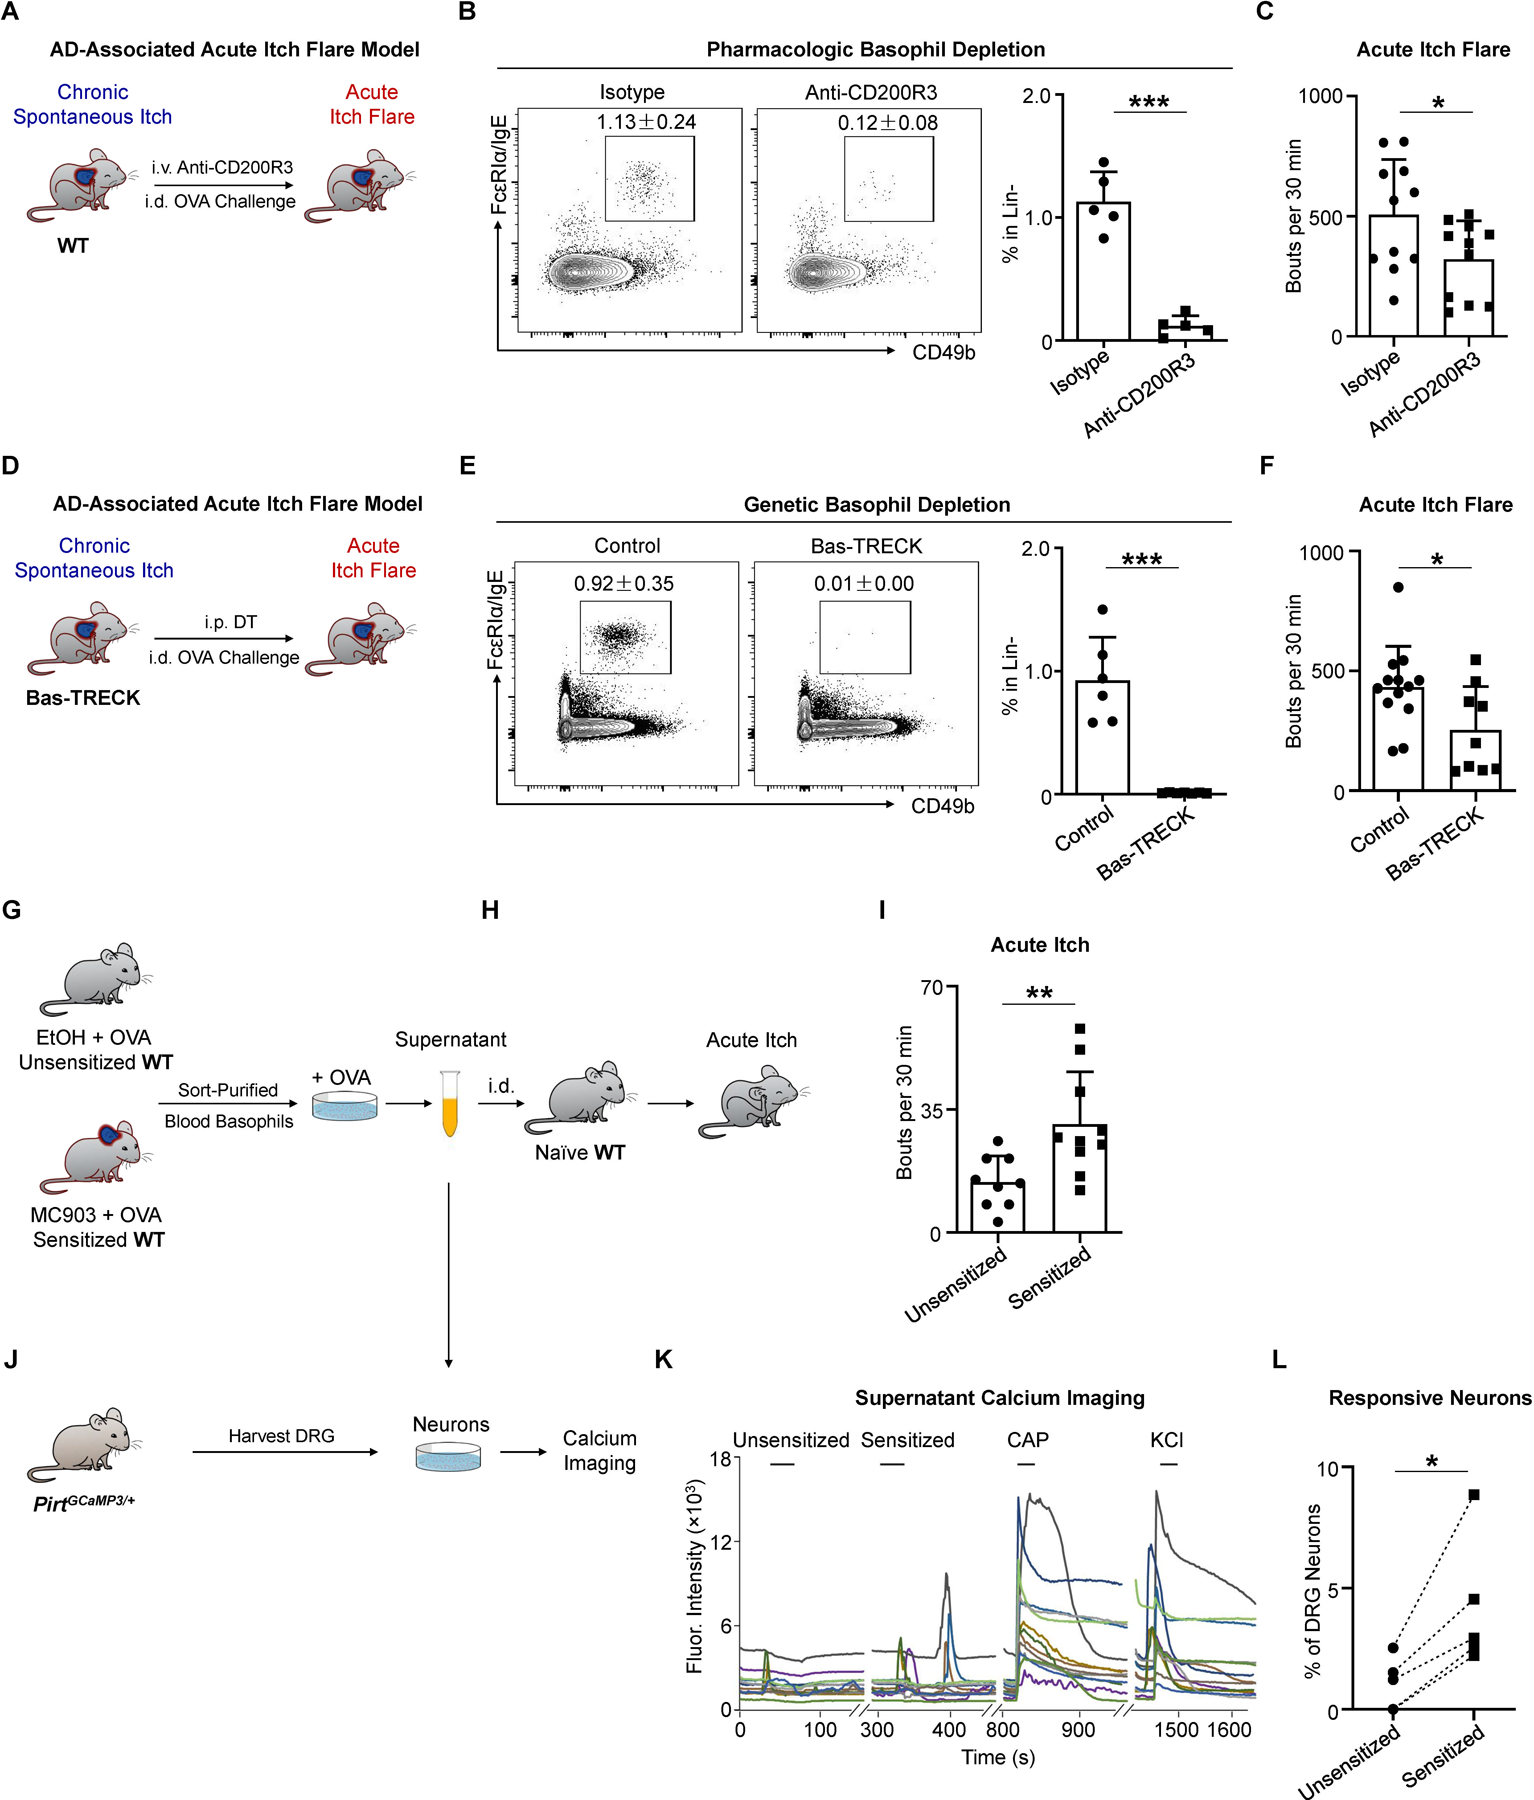
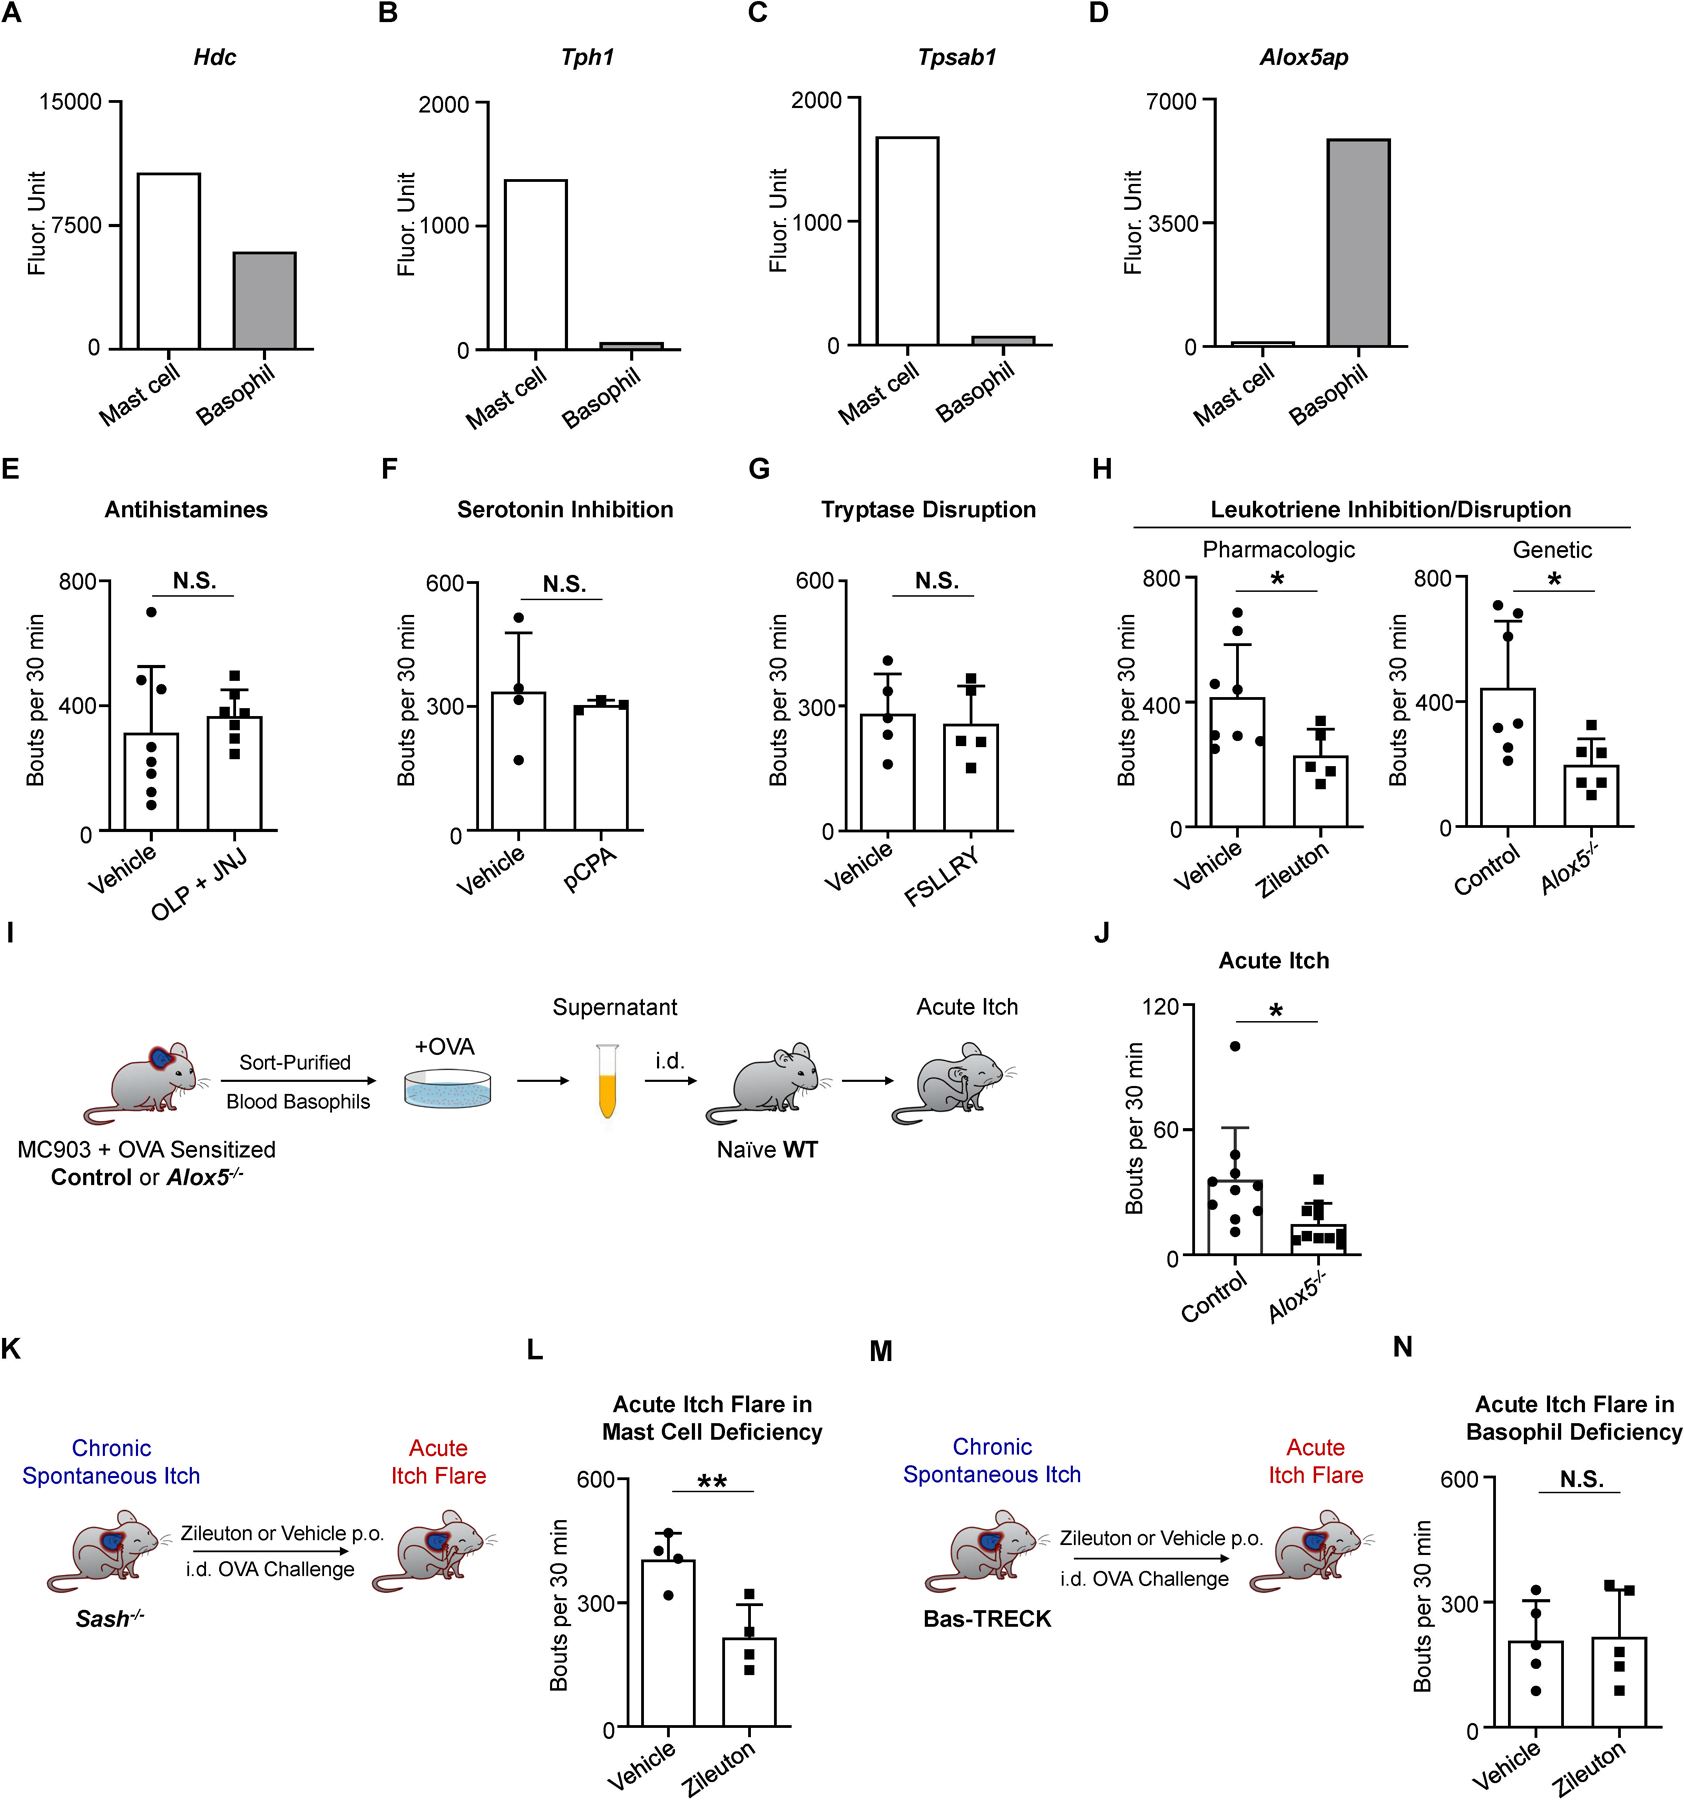
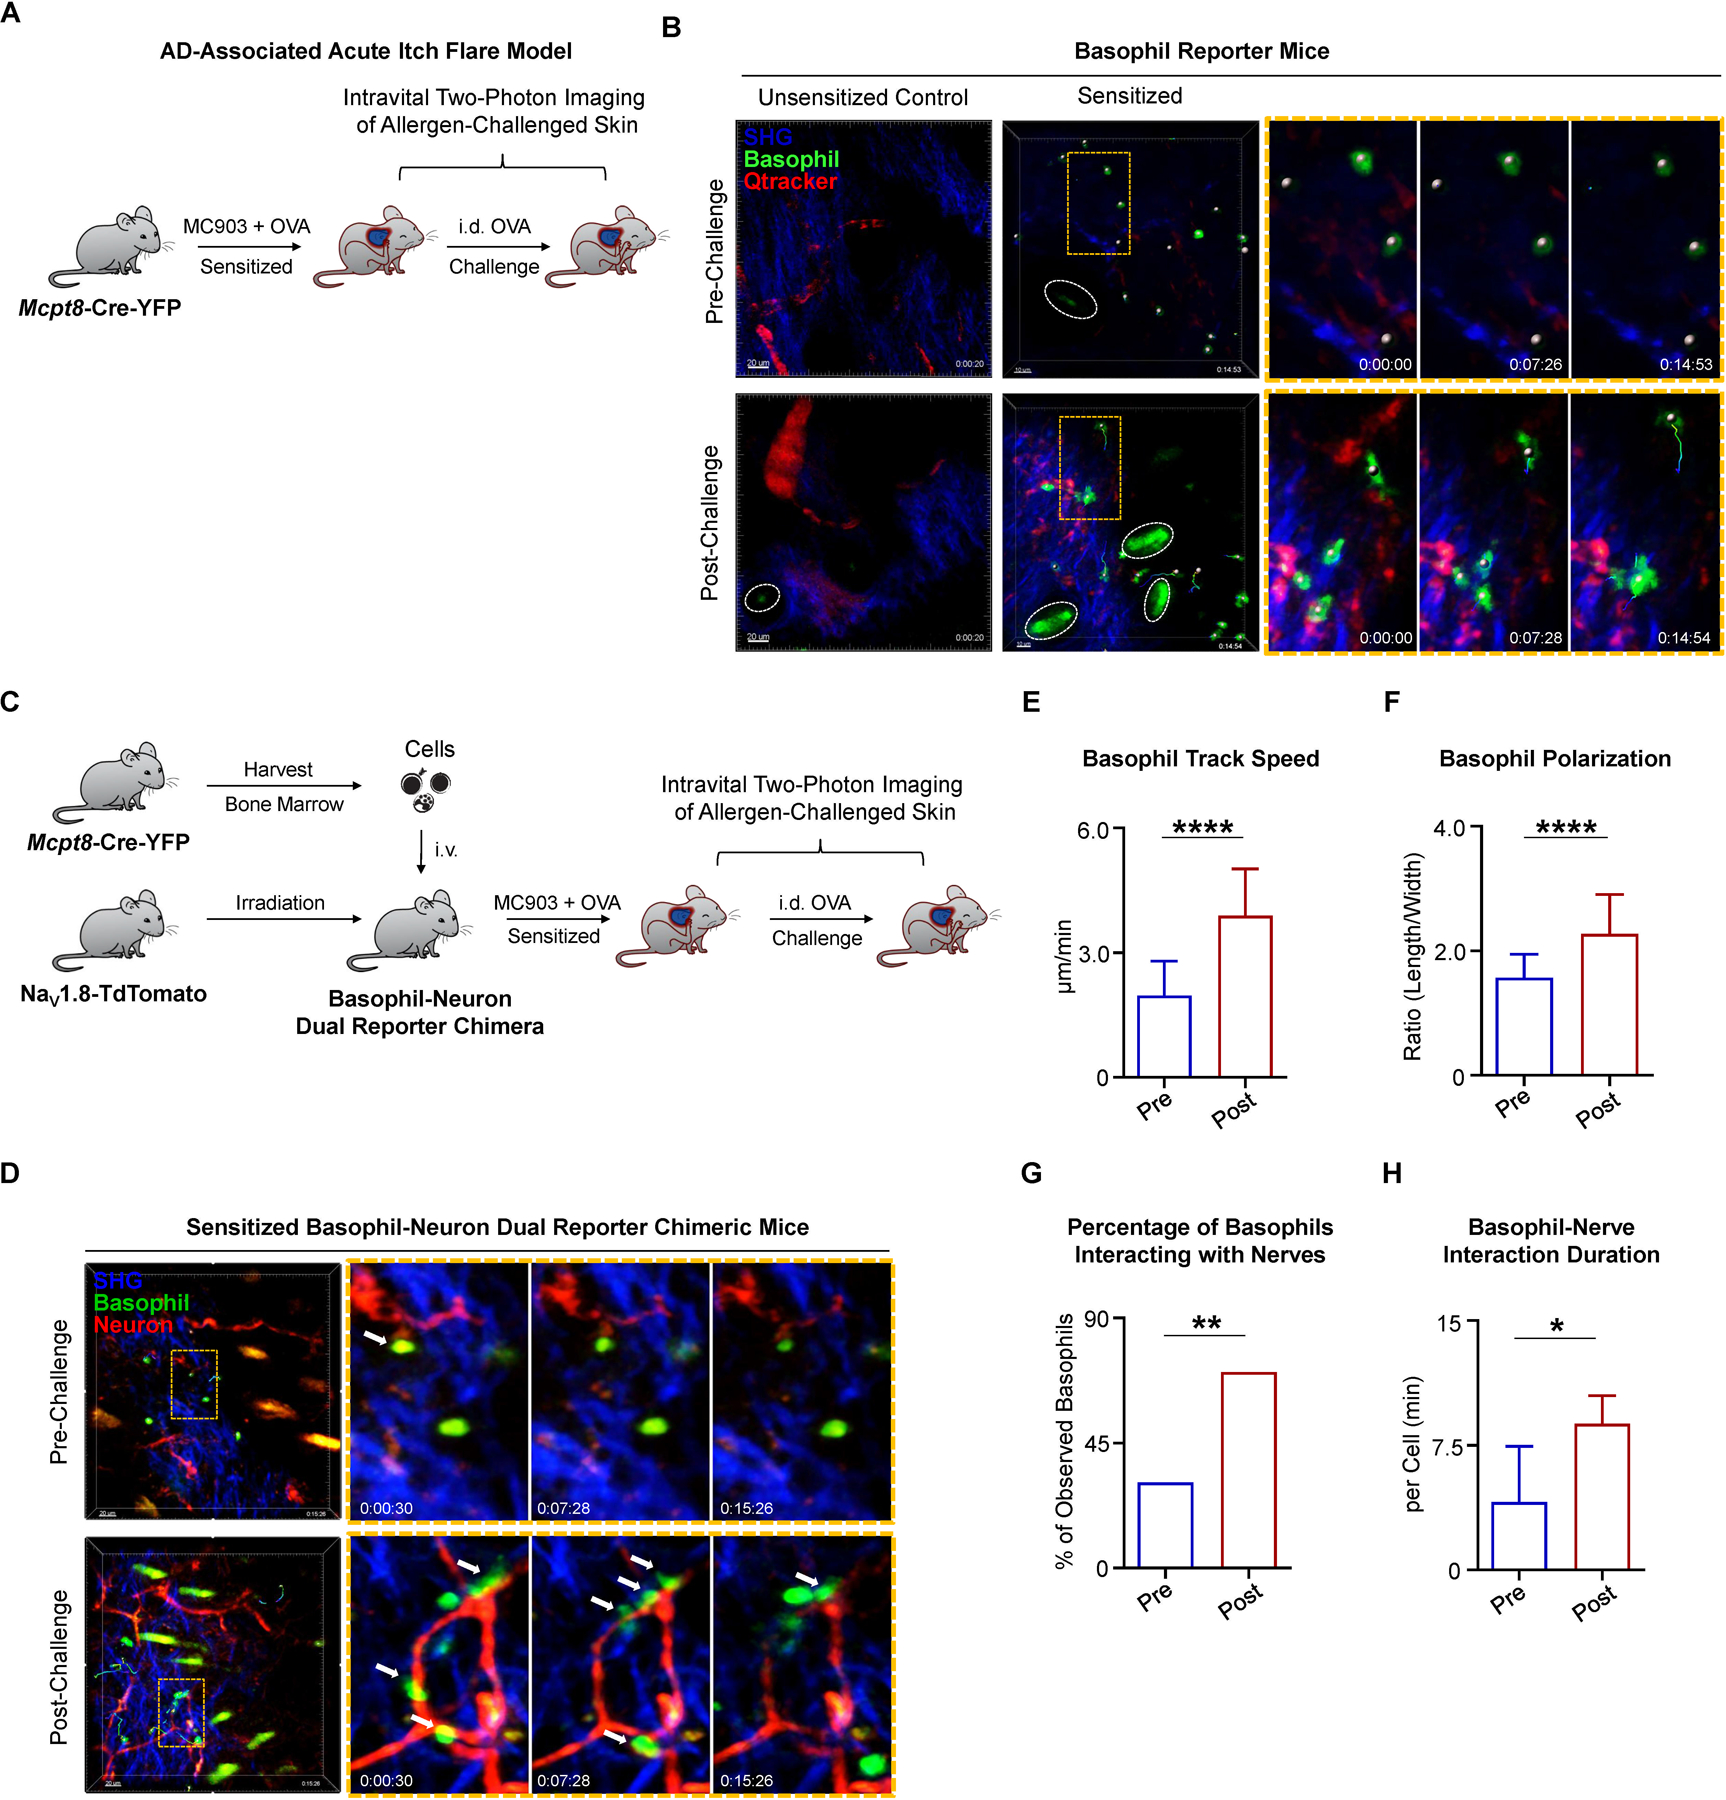
Itch is an evolutionarily conserved sensation that facilitates expulsion of pathogens and noxious stimuli from the skin. However, in organ failure, cancer, and chronic inflammatory disorders such as atopic dermatitis (AD), itch becomes chronic, intractable, and debilitating. In addition to chronic itch, patients often experience intense acute itch exacerbations. Recent discoveries have unearthed the neuroimmune circuitry of itch, leading to the development of anti-itch treatments. However, mechanisms underlying acute itch exacerbations remain overlooked. Herein, we identify that a large proportion of patients with AD harbor allergen-specific immunoglobulin E (IgE) and exhibit a propensity for acute itch flares. In mice, while allergen-provoked acute itch is mediated by the mast cell-histamine axis in steady state, AD-associated inflammation renders this pathway dispensable. Instead, a previously unrecognized basophil-leukotriene (LT) axis emerges as critical for acute itch flares. By probing fundamental itch mechanisms, our study highlights a basophil-neuronal circuit that may underlie a variety of neuroimmune processes.

Keywords: IgE; allergy; atopic dermatitis; basophils; itch; leukotriene; mast cells; pruritus; sensory neurons.


Conflict of interest statement

Declaration of interests B.S.K. has served as a consultant for AbbVie, ABRAX Japan, Almirall, AstraZeneca, Cara Therapeutics, Daewoong Pharmaceutical, Incyte, LEO Pharma, Lilly, Maruho, Menlo Therapeutics, OM Pharma, Pfizer, and Third Rock Ventures. He has also participated on the advisory board for Almirall, Boehringer Ingelheim, Cara Therapeutics, Kiniksa Pharmaceuticals, Menlo Therapeutics, Regeneron Pharmaceuticals, Sanofi Genzyme, and Trevi Therapeutics. He is stockholder of Locus Biosciences. All other authors declare that they have no relevant conflicts of interest.

Figures

Figure 1.
Figure 1.. Acute Itch Flares Are Associated with Allergen-Specific IgE in Human AD and Mast Cell-Independent in Murine AD-Like Disease
(A) Schematic of post hoc analysis of phase 3 clinical trial data from a cohort of placebo-treated patients with atopic dermatitis (AD, N = 159). For each patient, the daily numerical rating scale (NRS) itch scores over a two-month period and the serum allergen-specific IgE repertoire were assessed. (B) Itch patterns from two representative individuals. Patient 1 (red line) has an acute itch flare pattern due to the presence of at least one acute itch flare (indicated by arrows). Patient 2 (blue line) has a non-flare itch pattern due to a lack of apparent itch flares. Gray shading highlights 2-point threshold above baseline for patient 1. (C) Pie chart depicting the percentage (%) of patients with an acute itch flare or non-flare pattern in the first month. (D) Pie chart depicting the percentage (%) of patients with various itch patterns in month 2. Wedges outlined by dotted lines represent patients whose itch pattern changed from month 1 to month 2. (E) Frequency of patients who exhibited acute itch flares over the 2-month observation period out of all patients that tested positive for allergen-specific IgE (black bar, N = 68/133) and out of all patients that tested negative (White bar, N = 6/26). **p < 0.01 by Chi-square test. (F) Schematic of the AD-associated acute itch flare model. Calcipotriol (MC903) + ovalbumin (OVA)-treated (sensitized; from day 0 to day 9) or ethanol (EtOH) + OVA-treated (unsensitized control; from day 0 to day 9) wild-type (WT) mice received an intradermal (i.d.) injection of OVA into adjacent non-lesional cheek skin on day 10. Prior to and following i.d. OVA challenge, chronic spontaneous itch and acute itch flares were recorded, respectively. (G) ELISA quantification of OVA-specific IgE in the serum of MC903 + OVA-treated and EtOH + OVA-treated WT mice on day 10 of the AD-associated acute itch flare model. n = 9–11 mice per group. ***p < 0.001 by unpaired Student’s t-test. (H) Number of scratching bouts in 10-minute (min) intervals prior to and following i.d. allergen (OVA or bovine serum albumin [BSA]) challenge on day 10 of the AD-associated acute itch flare model. Unsensitized (EtOH + OVA) mice were challenged with i.d. OVA (open circle) and sensitized (MC903 + OVA) mice were challenged with i.d. OVA (closed square) or i.d. BSA (open square). Blue line indicates chronic spontaneous itch and red line indicates acute itch flares. n = 7 mice per group. ****p < 0.0001 by Two-way ANOVA test. (I) Number of scratching bouts in littermate control and Ige−/− mice prior to i.d. OVA challenge (chronic spontaneous itch; left) and following i.d. OVA challenge (acute itch flares; right) on day 10 of the AD-associated acute itch flare model. n = 6–7 mice per group. N.S., not significant, *p < 0.05 by unpaired Student’s t-test. (J) Number of scratching bouts in littermate control and mast cell-deficient Sash−/− mice prior to i.d. OVA challenge (chronic spontaneous itch; left) and following i.d. OVA challenge (acute itch flares; right) on day 10 of the AD-associated acute itch flare model. n = 5–8 mice per group. N.S., not significant by unpaired Student’s t-test. (K) Representative images of i.d. OVA-challenged skin sections stained with avidin-Texas Red (TRITC) in unsensitized (EtOH + OVA) or sensitized (MC903 + OVA) mast cell-deficient Sash−/− mice and the number of avidin positive cells quantified per square millimeter from each treatment group. White arrows indicate positively stained cells. White square indicates zoomed view of an avidin positive cell. Scale bar, 50µm. n = 3–5 mice per group. ****p < 0.0001 by unpaired Student’s t-test. Data are represented as mean ± SD. See also Figure S1.
Figure 2.
Figure 2.. Circulating Basophils Exhibit a Distinct Phenotype in AD-Associated Inflammation in Mice and Humans
(A) Schematic of human blood basophil analysis by flow cytometry from healthy controls (HC) and patients with AD. (B) Representative flow cytometry plots and frequency of lineage negative (Lin-) (CD3, CD4, CD19, CD14, CD34, CD56, c-Kit) CD123+ FcεRIα+ blood basophils from HCs and patients with AD. N = 12 subjects per group. N.S., not significant by Wilcoxon–Mann–Whitney nonparametric test. (C and D) CD203c (C) and FcεRIα (D) expression measured by mean fluorescence intensity (MFI) on blood basophils from HCs and patients with AD. N = 12 subjects per group. *p < 0.05, **p < 0.01 by Wilcoxon–Mann–Whitney nonparametric test. (E) Schematic of murine blood basophil analysis by flow cytometry. Vehicle EtOH or MC903 was topically applied on the ear skin of WT mice from day 0 to day 9 to induce AD-like disease. (F) Representative flow cytometry plots and frequency of Lin- (CD3e, CD5, CD11c, CD19, NK1.1) CD49b+ FcεRIα/IgE+ blood basophils in EtOH- or MC903-treated WT mice on day 10 of the AD-like disease model. n = 6 mice per group. N.S., not significant by unpaired Student’s t-test. (G and H) CD200R (G) and FcεRIα/IgE (H) expression measured by MFI on blood basophils in EtOH- or MC903-treated WT mice on day 10 of the AD-like disease model. n = 4–5 mice per group. *p < 0.05, **p < 0.01 by unpaired Student’s t-test. Data are represented as median (interquartile range) in (B–D) and mean ± SD in (F–H). See also Figure S2 and Table S1.
Figure 3.
Figure 3.. Chemogenetic Activation of Basophils Is Sufficient to Elicit Itch
(A) Schematic of the Mcpt8-Gq mouse line. Generated by crossing the Cre-dependent Gq-DREADD line with the Mcpt8-Cre-YFP line, Mcpt8-Gq mice specifically express hM3Dq in basophils allowing for selective chemogenetic activation of basophils upon clozapine-N-oxide (CNO) administration. (B and C) Representative images of basophils isolated from the blood of (B) control (Mcpt8-Cre) or (C) Mcpt8-Gq mice stimulated ex vivo with CNO. Identified based on their expression of the YFP reporter, basophils (FITC, green) were additionally stained with avidin-Texas Red (TRITC, red). Scale bar, 50µm. (D) Frequency of blood basophils isolated from control (Mcpt8-Cre) and Mcpt8-Gq mice that were avidin-positive following ex vivo stimulation with CNO. n = 4 mice per group. ****p < 0.0001 by unpaired Student’s t-test. (E) Number of scratching bouts following intraperitoneal (i.p.) injection of CNO in control (Mcpt8-Cre) and Mcpt8-Gq mice. n = 6–9 mice per group. **p < 0.01 by unpaired Student’s t-test. Data are represented as mean ± SD.
Figure 4.
Figure 4.. Basophils Are Required for Acute Itch Flares in AD-Associated Inflammation
(A) Schematic of pharmacologic basophil depletion. WT mice received intravenous (i.v.) injection of isotype control or anti-CD200R3 monoclonal antibody (mAb) on day 7 and day 9 of the AD-associated acute itch flare model (MC903 + OVA). (B) Representative flow cytometry plots and frequency of Lin- (CD3e, CD5, CD11c, CD19, NK1.1) FcεRIα/IgE+ CD49b+ basophils from the blood of isotype-treated and anti-CD200R3 mAb-treated WT mice prior to i.d. OVA challenge on day 10 of the AD-associated acute itch flare model. n = 5 mice per group. ***p < 0.001 by unpaired Student’s t-test. (C) Number of scratching bouts following i.d. OVA challenge on day 10 of the AD-associated acute itch flare model in isotype-treated WT mice and basophil-depleted (anti-CD200R3 mAb-treated) WT mice. n = 11 mice per group. *p < 0.05 by unpaired Student’s t-test. (D) Schematic of conditional basophil depletion by i.p. injection of diphtheria toxin (DT) into Bas-TRECK mice on day 8 and day 9 of the AD-associated acute itch flare model. (E) Representative flow cytometry plots and frequency of Lin- (CD3e, CD5, CD11c, CD19, NK1.1) FcεRIα/IgE+ CD49b+ basophils from the blood of littermate control and Bas-TRECK mice prior to i.d. OVA challenge on day 10 of the AD-associated acute itch flare model. n = 6–7 mice per group. ***p < 0.001 by unpaired Student’s t-test. (F) Number of scratching bouts following i.d. OVA challenge on day 10 of the AD-associated acute itch flare model in littermate control and basophil-depleted Bas-TRECK mice. n = 9–13 mice per group. *p < 0.05 by unpaired Student’s t-test. (G) Schematic of sort purification and culture of circulating basophils from unsensitized (EtOH + OVA) or sensitized (MC903 + OVA) WT mice. Supernatants were collected one hour following ex vivo stimulation with OVA. (H) Schematic of i.d. injection of supernatants from OVA-stimulated basophils (from Figure 4G) into naïve WT mice to test acute itch responses. (I) Number of scratching bouts in naïve WT recipient mice following i.d. injection of basophil-derived supernatants from unsensitized (EtOH + OVA) or sensitized (MC903 + OVA) WT mice. n = 9–10 recipient mice per group. **p < 0.01 by unpaired Student’s t-test. (J) Schematic of dorsal root ganglia (DRG) neurons isolated from PirtGCaMP3/+ calcium reporter mice being stimulated with supernatants from OVA-stimulated basophils (from Figure 4G) to test calcium responses using calcium imaging. (K) Representative calcium traces of mouse DRG responses to supernatant stimulation. Calcium responses were measured by fluorescence (Fluor.) intensity (488 nm). Neurons isolated from PirtGCaMP3/+ mice were sequentially stimulated with supernatants from unsensitized (EtOH + OVA) mice, supernatants from sensitized (MC903 + OVA) mice, capsaicin (CAP, 500 nM), and KCl (50 mM). Each color trace represents one neuron. (L) Percentage (%) of supernatant-responsive neurons out of all KCl-responsive neurons. Each data point represents the percentage of supernatant-responsive neurons from one individual PirtGCaMP3/+ mouse. n = 5 mice (> 200 neurons each). *p < 0.05 by paired Student’s t-test. Data are represented as mean ± SD. See also Figure S3.
Figure 5.
Figure 5.. Acute Itch Flares Require Basophil-Intrinsic Leukotriene Pathways
(A–D) RNA expression of (A) Hdc, (B) Tph1, (C) Tpsab1, and (D) Alox5ap in murine skin mast cells and blood basophils. Raw data from www.immgen.org. (E) Number of scratching bouts following i.d. OVA challenge on day 10 of the AD-associated acute itch flare model in WT mice that were pre-administered vehicle or antihistamines olopatadine (OLP, 3 mg/kg; i.p.) and JNJ7777120 (JNJ, 20 mg/kg; subcutaneous injection into the nape) 30 minutes prior to i.d. OVA challenge. n = 7–8 mice per group. N.S., not significant by unpaired Student’s t-test. (F) Number of scratching bouts following i.d. OVA challenge on day 10 of the AD-associated acute itch flare model in WT mice that were pre-administered vehicle or tryptophan hydroxylase inhibitor p-Chlorophenylalanine (pCPA, 150 mg/kg; i.p.) on day 7, day 8, and day 9. n = 3–4 mice per group. N.S., not significant by unpaired Student’s t-test. (G) Number of scratching bouts following i.d. OVA challenge on day 10 of the AD-associated acute itch flare model in WT mice that were pre-administered vehicle or protease-activated receptor 2 (PAR2; the tryptase receptor) antagonist FSLLRY-NH2 (FSLLRY, 7.5 mg/kg; i.p.) 30 minutes prior to i.d. OVA challenge. n = 5 mice per group. N.S., not significant by unpaired Student’s t-test. (H) Number of scratching bouts following i.d. OVA challenge on day 10 of the AD-associated acute itch flare model in WT mice that were pre-administered vehicle or zileuton (a 5-lipoxygenase [5-LOX] inhibitor, 50 mg/kg; gavage) 60 minutes prior to i.d. OVA challenge (left). Number of scratching bouts following i.d. OVA challenge on day 10 of the AD-associated acute itch flare model in littermate control and Alox5−/− mice (right). n = 5–8 mice per group. *p < 0.05 by unpaired Student’s t-test. (I) Schematic for testing the pruritogenic properties of circulating basophils from sensitized (MC903 + OVA) littermate control or Alox5−/− mice stimulated ex vivo with OVA. Supernatants suspended from stimulated basophils are i.d. injected into naïve WT mice to provoke acute itch responses. (J) Number of scratching bouts in naïve WT recipient mice i.d. injected with basophil-derived supernatants from sensitized littermate control or sensitized Alox5−/− mice. n = 10 recipient mice per group. *p < 0.05 by unpaired Student’s t-test. (K) Schematic for testing the 5-LOX pathway in mast cell-deficient Sash−/− mice pre-administered vehicle or zileuton prior to i.d. OVA challenge on day 10 of the AD-associated acute itch flare model. (L) Number of scratching bouts following i.d. OVA challenge on day 10 of the AD-associated acute itch flare model in mast cell-deficient Sash−/− mice that were pre-administered vehicle or zileuton (50 mg/kg; gavage). n = 4 mice per group. **p < 0.01 by unpaired Student’s t-test. (M) Schematic for testing 5-LOX pathway in basophil-depleted Bas-TRECK mice pre-administered vehicle or zileuton prior to i.d. OVA challenge on day 10 of the AD-associated acute itch flare model. (N) Number of scratching bouts following i.d. OVA challenge on day 10 of the AD-associated acute itch flare model in basophil-depleted Bas-TRECK mice that were pre-administered vehicle or zileuton (50 mg/kg; gavage). n = 5 mice per group. N.S., not significant by unpaired Student’s t-test. Data are represented as mean ± SD. See also Figure S4.
Figure 6.
Figure 6.. Basophils Interact with Sensory Neurons in the Skin upon Allergen Challenge
(A) Schematic of intravital two-photon imaging of cheek skin (injection site) pre- and post-challenge with i.d. OVA in Mcpt8-Cre-YFP mice on day 10 of the AD-associated acute itch flare model. (B) Time-lapse intravital two-photon imaging of basophil behavior. Representative images were taken of the cheek skin from unsensitized (EtOH + OVA) control and sensitized (MC903 + OVA) Mcpt8-Cre-YFP mice, pre- and post-challenge with i.d. OVA. Tracked basophils (green) are indicated by white dots (center of mass). Autofluorescent hairs are identified by white ellipses. Basophil motility is indicated by time encoded colored tracks. Zoomed views are taken from the regions outlined by orange rectangles. Blood vessels (red) were labeled by i.v. injection of Qtracker 655 vascular label 15–30 minutes prior to imaging. Collagen (blue) is imaged by collecting the second harmonic generation signal (SGH). (C) Schematic of basophil-neuron dual reporter chimera generation and intravital two-photon imaging of the cheek skin (injection site) in sensitized (MC903 + OVA) dual reporter mice pre- and post-challenge with i.d. OVA on day 10 of the AD-associated acute itch flare model. Bone marrow cells harvested from Mcpt8-Cre-YFP donors were i.v. injected into NaV1.8-TdTomato recipients after X-ray irradiation to generate dual reporter mice. Mice were rested 8 weeks before initiation of AD-associated acute itch flare model. (D) Time-lapse intravital two-photon imaging of basophil-neuron interactions in the cheek skin of basophil-neuron dual reporter chimeric mice, pre- and post-challenge with i.d. OVA on day 10 of the AD-associated acute itch flare model. Representative images show sensory nerve fibers (red) and basophils (green, white dots). Tracked cell motility is shown as time-encoded colored tracks. Autofluorescent hairs appear yellow or green and collagen appears blue due to the SHG signal. Zoomed views are taken from the regions outlined by orange rectangles. White arrows show examples of basophils making apparent contacts with sensory nerves in the skin. (E) Basophil track speed in the cheek skin of basophil-neuron dual reporter chimeric mice, pre- and post-challenge with i.d. OVA on day 10 of the AD-associated acute itch flare model. n > 20 basophils per group. Data are represented as median (interquartile range). ****p < 0.0001 by Wilcoxon–Mann–Whitney nonparametric test. n = 3 mice. (F) Basophil polarization (length/width ratio) in the cheek skin of basophil-neuron dual reporter chimeric mice, pre- and post-challenge with i.d. OVA on day 10 of the AD-associated acute itch flare model. n > 20 basophils per group. ****p < 0.0001 by unpaired Student’s t-test. n = 3 mice. (G) Percentage (%) of basophils interacting with nerve fibers in the cheek skin of basophil-neuron dual reporter chimeric mice, pre- and post-challenge with i.d. OVA on day 10 of the AD-associated acute itch flare model. n > 20 basophils per group. **p < 0.01 by Chi-square test. n = 3 mice. (H) Basophil-nerve interaction durations normalized to cell number of basophils in the skin of basophil-neuron dual reporter chimeric mice, pre- and post-challenge with i.d. OVA on day 10 of the AD-associated acute itch flare model. n > 20 observed basophils per group. *p < 0.05 by unpaired Student’s t-test. n = 3 mice. Data are represented as mean ± SD in (F and H). See also Movies S1–S3.
Figure 7.
Figure 7.. The LTC4-CysLTR2 Axis Underlies Acute Itch Flares
(A) ELISA quantification of serum leukotriene (LT) B4 levels in sensitized (MC903 + OVA) WT mice challenged with i.d. BSA or OVA on day 10 of the AD-associated acute itch flare model. n = 7 mice per group. N.S., not significant by unpaired Student’s t-test. (B) ELISA quantification of serum LTC4 levels in sensitized (MC903 + OVA) WT mice challenged with i.d. BSA or OVA on day 10 of the AD-associated acute itch flare model. n = 5–6 mice per group. *p < 0.05 by unpaired Student’s t-test. (C) ELISA quantification of LTC4 levels in supernatants collected from basophils stimulated ex vivo with OVA from unsensitized (EtOH + OVA) or sensitized (MC903 + OVA) WT mice (as in Figure 4G). n = 5–10 mice per group. *p < 0.05 by unpaired Student’s t-test. (D) ELISA quantification of serum LTC4 levels in sensitized (MC903 + OVA) littermate control and basophil-depleted Bas-TRECK mice challenged with i.d. OVA on day 10 of the AD-associated acute itch flare model. n = 8 mice per group. ***p < 0.001 by unpaired Student’s t-test. (E) Number of scratching bouts following i.d. injection of saline or N-methyl LTC4 (N-met LTC4, 0.75 µg) in WT mice. n = 6 mice per group. ***p < 0.001 by unpaired Student’s t-test. (F) Dose-response curves of scratching bouts quantified in WT mice following i.d. challenge with increasing doses of histamine (0–10,000 µg) or N-met LTC4 (0–1.5 µg). n ≥ 3 mice per dosage in each group. ****p < 0.0001 by Two-way ANOVA test. (G) Schematic for pharmacologic inhibition of CysLTR2 in WT mice pre-administered vehicle or HAMI3379 prior to i.d. OVA challenge on day 10 of the AD-associated acute itch flare model. (H) Number of scratching bouts following i.d. OVA challenge on day 10 of the AD-associated acute itch flare model in WT mice that were pre-administered vehicle or CysLTR2 antagonist HAMI3379 (HAMI, 0.4 mg/kg; i.p.) on day 9 (two doses) and on day 10 (one dose, 60 minutes prior to challenge). n = 5–8 mice per group. *p < 0.05 by unpaired Student’s t-test. (I) Schematic for neuronal in vivo CysLTR2 inhibition in WT mice pretreated with daily intracisternal (i.c.) injection of control siRNA or CysLTR2 siRNA from day 7 to day 9 followed by i.d. OVA challenge on day 10 of the AD-associated acute itch flare model. (J) Representative images of the trigeminal ganglion stained with PGP9.5 (TRITC, red) and CysLTR2 (FITC, green) and the percentage (%) of CysLTR2 positive cells out of PGP9.5 positive neurons in sensitized (MC903 + OVA) WT mice that were pretreated with i.c. control siRNA or CysLTR2 siRNA. Scale bar, 50µm. n = 3 mice per group. **p < 0.01 by unpaired Student’s t-test. (K) Number of scratching bouts following i.d. OVA challenge on day 10 of the AD-associated acute itch flare model in WT mice that were pretreated with i.c. control siRNA or CysLTR2 siRNA. n = 5 mice per group. **p < 0.01 by unpaired Student’s t-test. (L) Representative calcium traces of mouse sensory neuron responses to N-met LTC4 stimulation. Calcium levels were measured as a ratio of 340/380 nm fluorescence over time. DRG neurons isolated from WT mice were sequentially stimulated with N-met LTC4 (100 nM), allyl isothiocyanate (AITC, 100 µM), capsaicin (CAP, 500 nM), and KCl (50 mM). Each trace represents one neuron. (M) Representative Venn diagram depicting the overlapping responses of DRG neuron subsets to N-met LTC4 (100 nM), AITC (100 µM), and CAP (500 nM). n > 200 neurons from a WT mouse. (N) Percentage (%) of N-met LTC4-responsive neurons out of all KCl-responsive neurons. DRG neurons were isolated from WT, Trpv1−/−, Trpa1−/−, or compound Trpv1−/− Trpa1−/− mice. Each data point represents the percentage of neurons that were responsive to N-met LTC4 in an individual mouse. n = 3 mice (> 200 neurons each) per group. N.S., not significant, **p < 0.01 by unpaired Student’s t-test. (O) Number of scratching bouts following i.d. injection of N-met LTC4 in WT (control) and compound Trpv1−/− Trpa1−/− mice. n = 4–5 mice per group. *p < 0.05 by unpaired Student’s t-test. (P) Number of scratching bouts following i.d. OVA challenge on day 10 of the AD-associated acute itch flare model in WT (control) and compound Trpv1−/− Trpa1−/− mice. n = 5–7 mice per group. ***p < 0.001 by unpaired Student’s t-test. Data are represented as mean ± SD. See also Figures S5–S7.

Comment in

References

    1. Akiyama T, Carstens MI, and Carstens E (2010). Facial injections of pruritogens and algogens excite partly overlapping populations of primary and second-order trigeminal neurons in mice. Journal of neurophysiology 104, 2442–2450. - PMC - PubMed
    1. Altinok Ersoy N, and Akyar I (2019). Multidimensional pruritus assessment in hemodialysis patients. BMC nephrology 20, 42. - PMC - PubMed
    1. Andoh T, and Kuraishi Y (1998). Intradermal leukotriene B-4, but not prostaglandin E-2, induces itch-associated responses in mice. Eur J Pharmacol 353, 93–96. - PubMed
    1. Benditt EP, Wong RL, Arase M, and Roeper E (1955). 5-Hydroxytryptamine in mast cells. Proc Soc Exp Biol Med 90, 303–304. - PubMed
    1. Benoist C, Lanier L, Merad M, Mathis D, and Immunological Genome P (2012). Consortium biology in immunology: the perspective from the Immunological Genome Project. Nature reviews Immunology 12, 734–740. - PubMed

Publication types

MeSH terms

LinkOut - more resources