

Towards Providing Effective Data-Driven Responses to Predict the Covid-19 in São Paulo and Brazil
- PMID: 33451092
- PMCID: PMC7828507
- DOI: 10.3390/s21020540
Towards Providing Effective Data-Driven Responses to Predict the Covid-19 in São Paulo and Brazil
Abstract
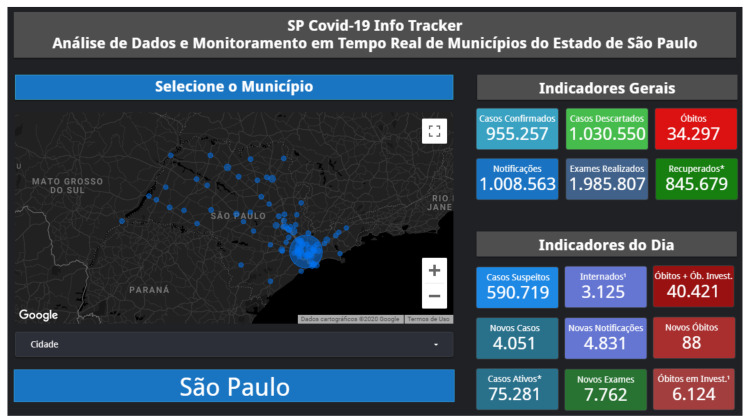
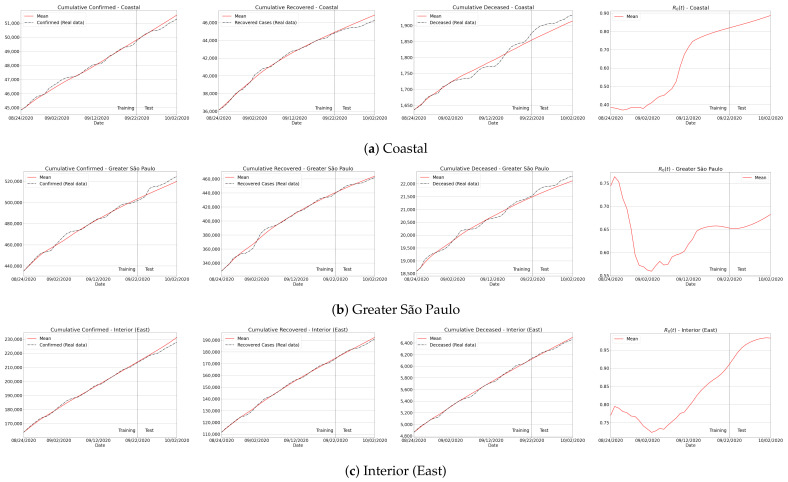
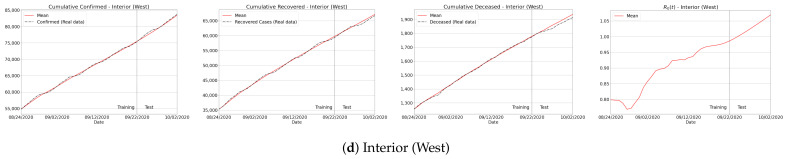
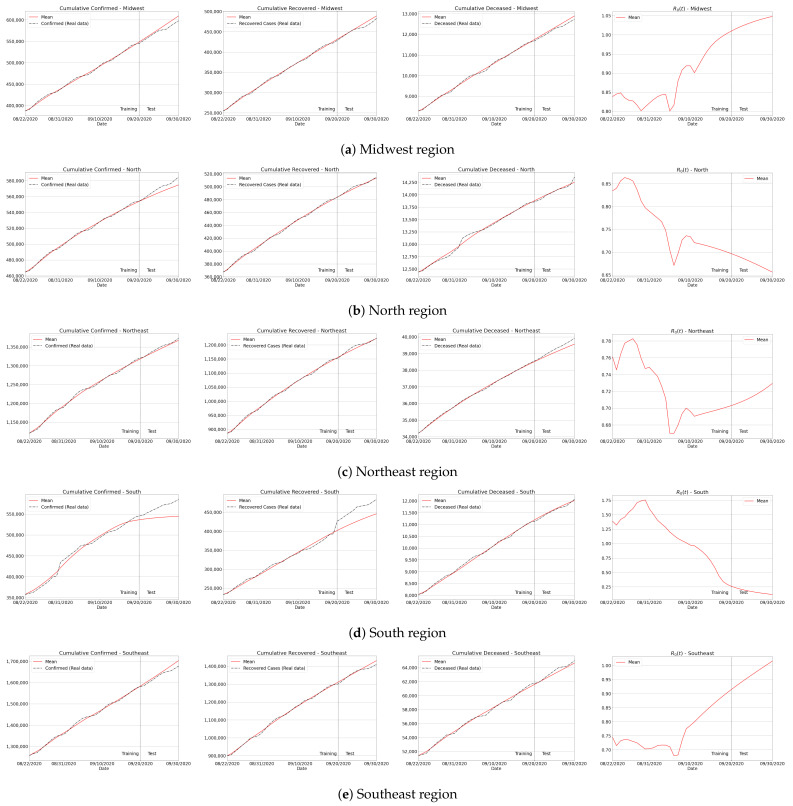
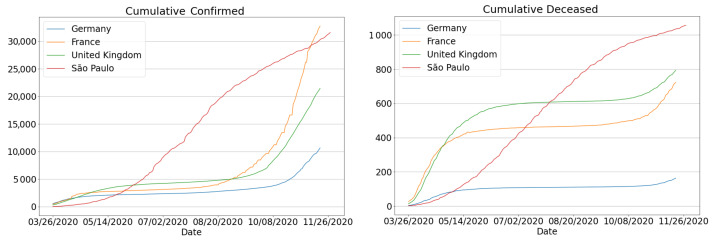
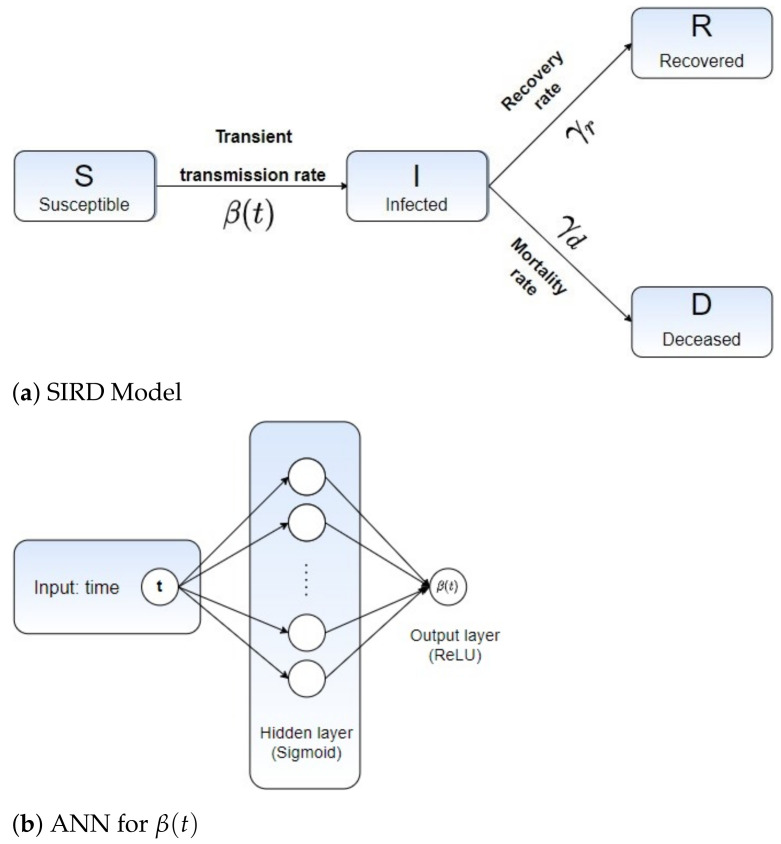
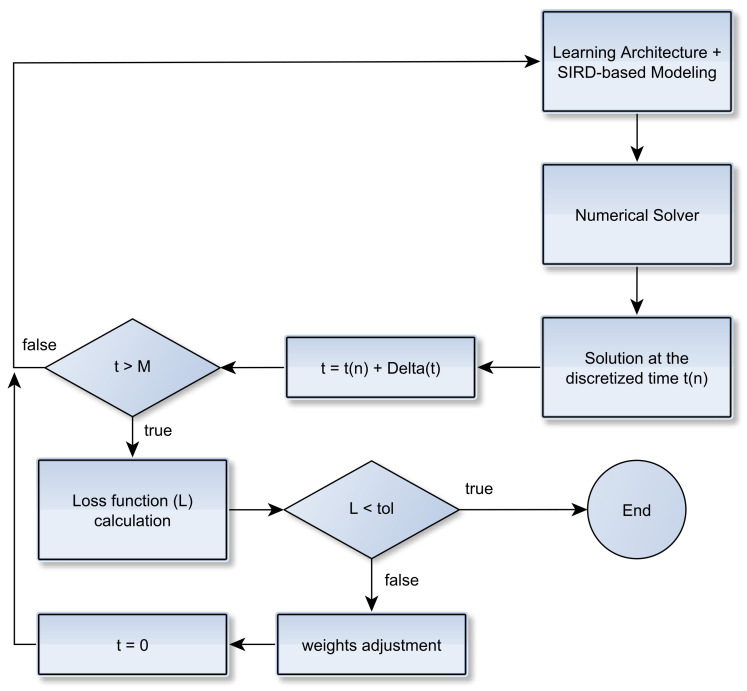
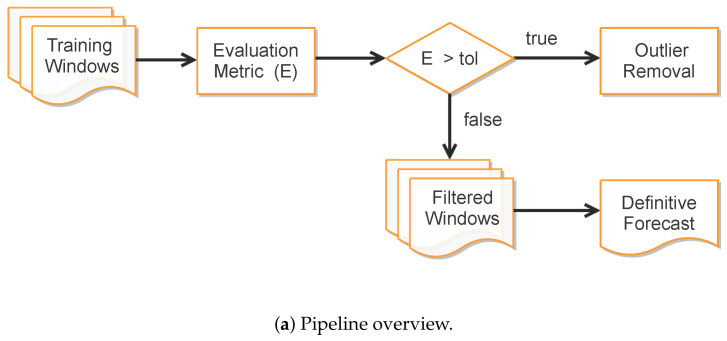
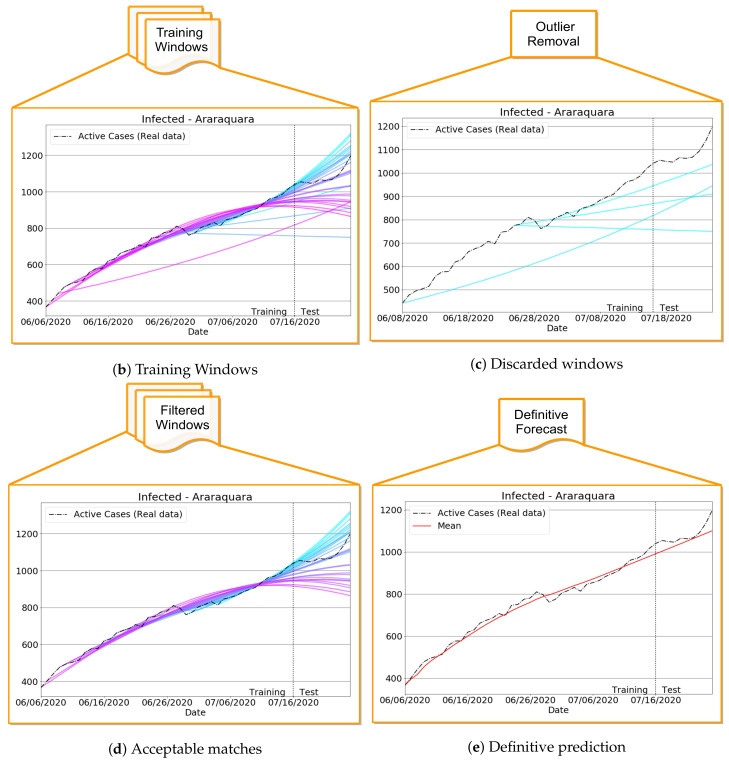
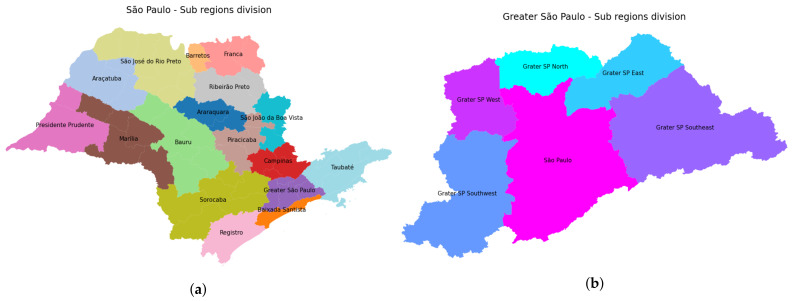
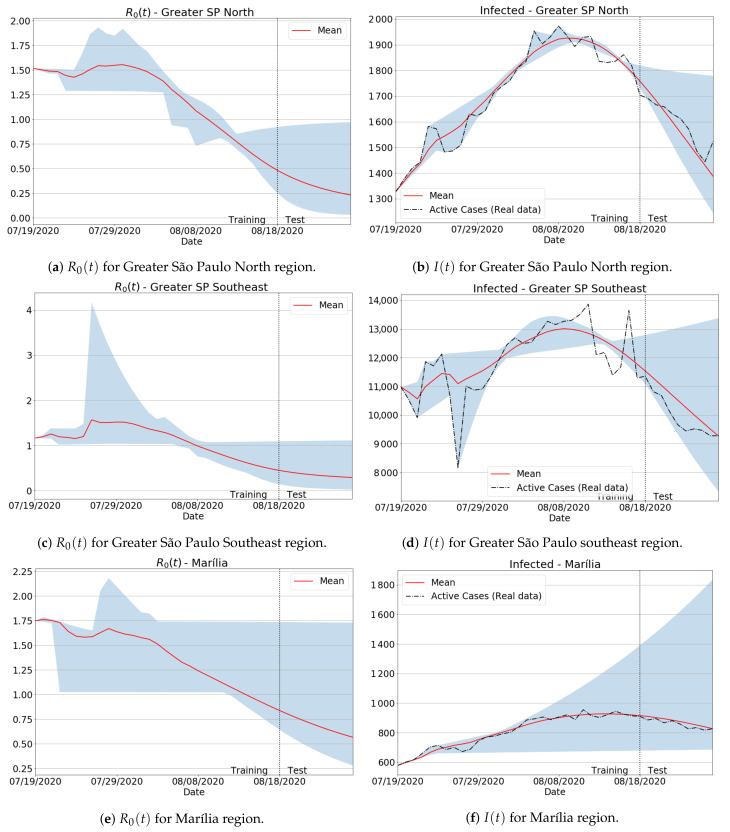
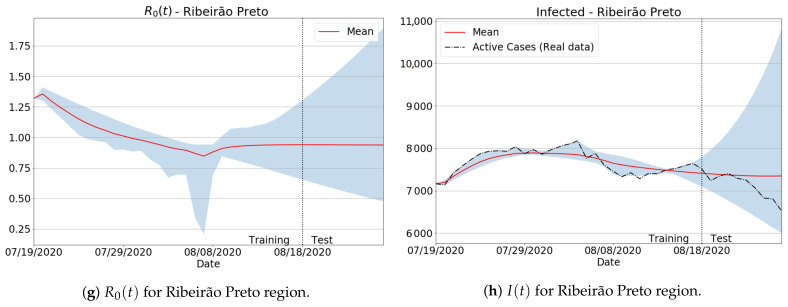
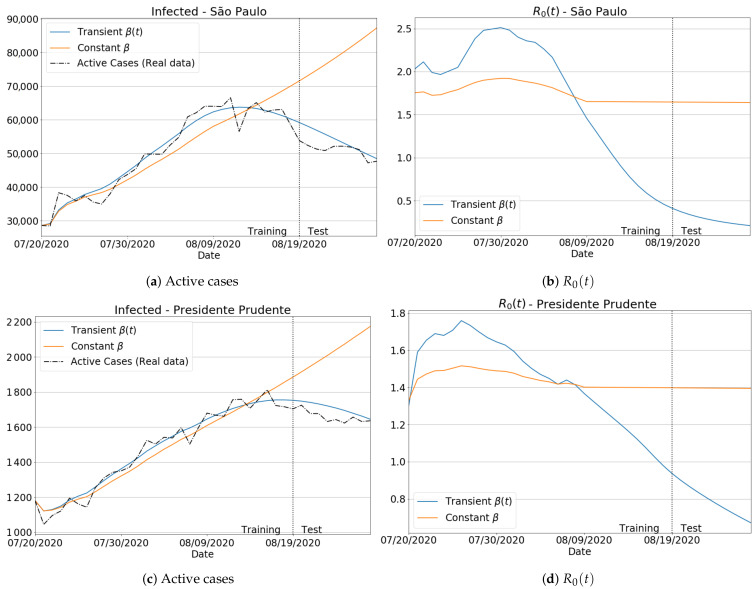
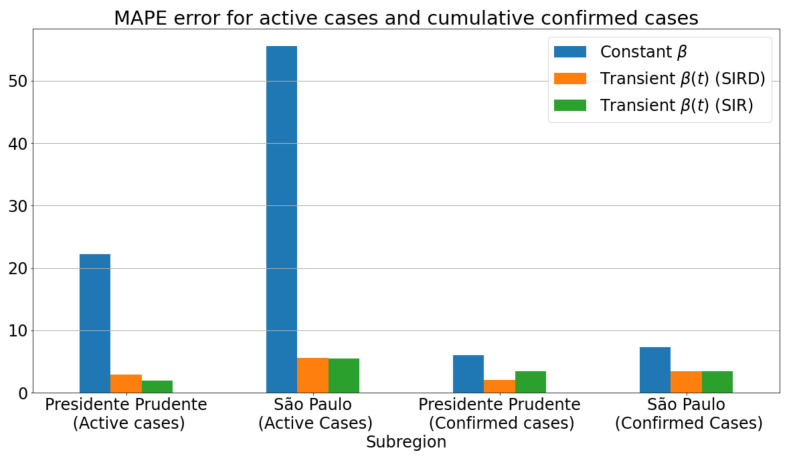
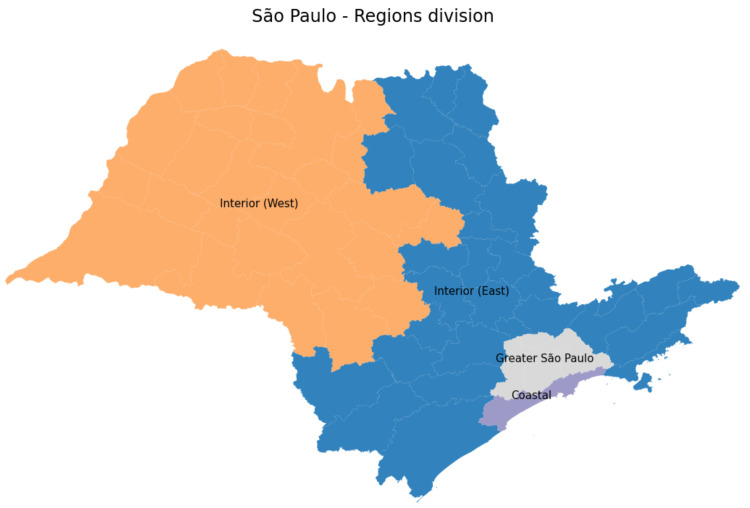
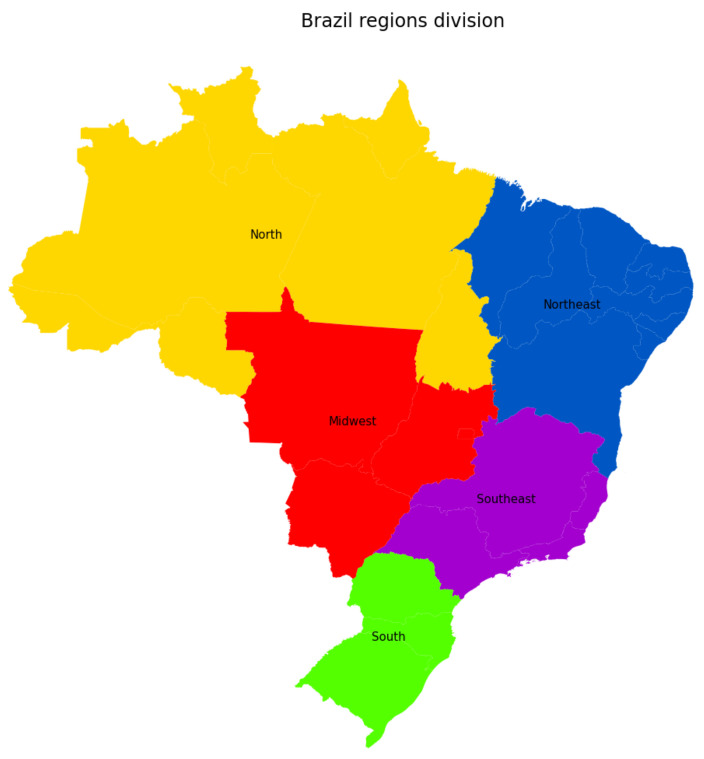
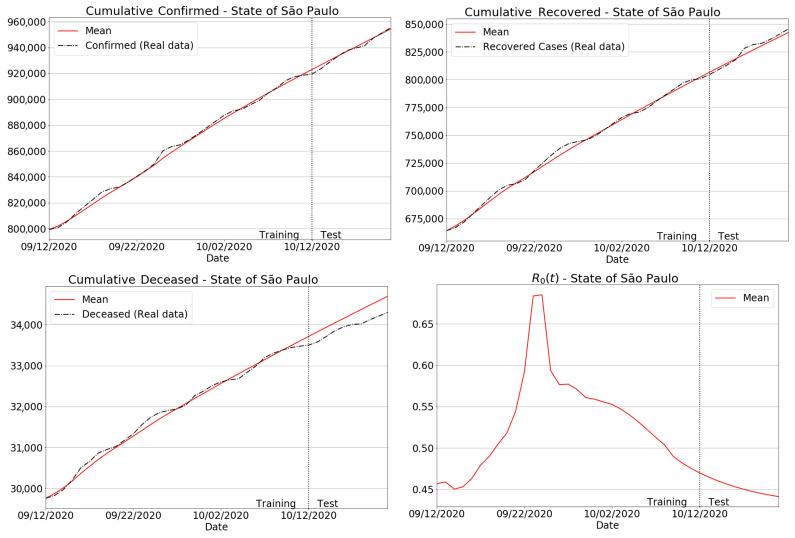
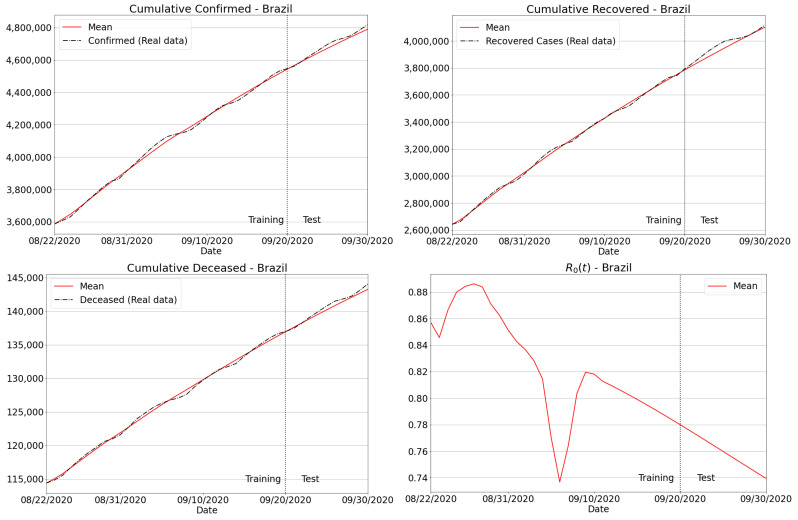
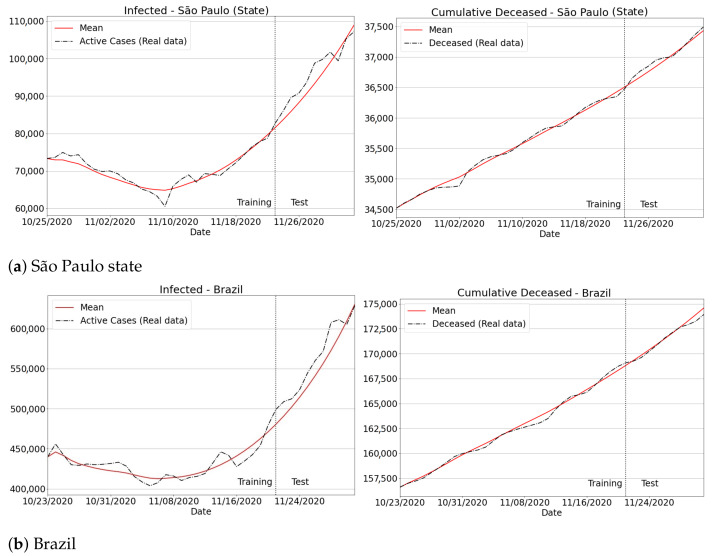
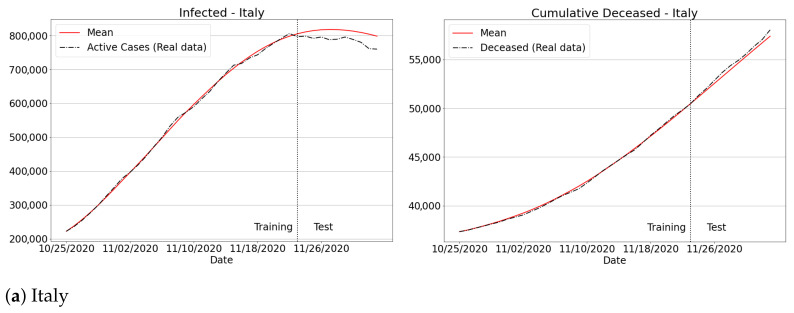
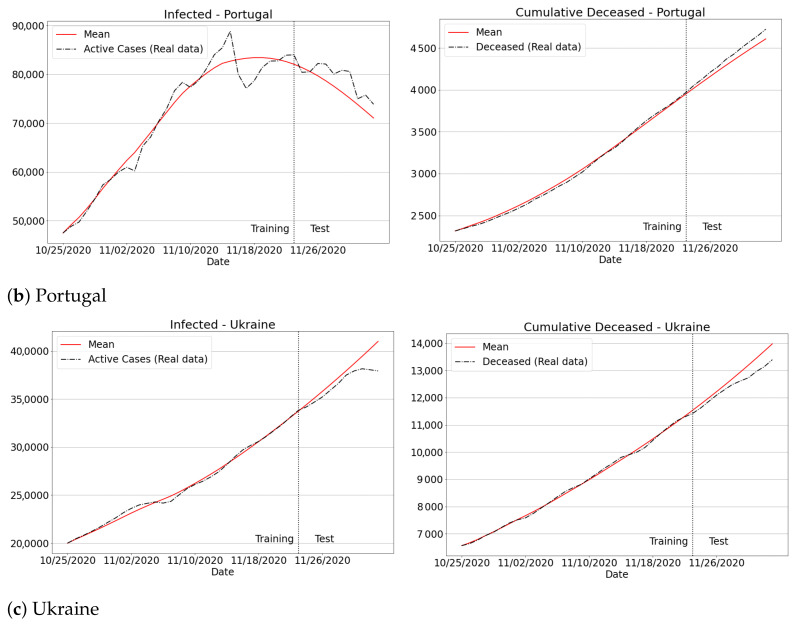
São Paulo is the most populous state in Brazil, home to around 22% of the country's population. The total number of Covid-19-infected people in São Paulo has reached more than 1 million, while its total death toll stands at 25% of all the country's fatalities. Joining the Brazilian academia efforts in the fight against Covid-19, in this paper we describe a unified framework for monitoring and forecasting the Covid-19 progress in the state of São Paulo. More specifically, a freely available, online platform to collect and exploit Covid-19 time-series data is presented, supporting decision-makers while still allowing the general public to interact with data from different regions of the state. Moreover, a novel forecasting data-driven method has also been proposed, by combining the so-called Susceptible-Infectious-Recovered-Deceased model with machine learning strategies to better fit the mathematical model's coefficients for predicting Infections, Recoveries, Deaths, and Viral Reproduction Numbers. We show that the obtained predictor is capable of dealing with badly conditioned data samples while still delivering accurate 10-day predictions. Our integrated computational system can be used for guiding government actions mainly in two basic aspects: real-time data assessment and dynamic predictions of Covid-19 curves for different regions of the state. We extend our analysis and investigation to inspect the virus spreading in Brazil in its regions. Finally, experiments involving the Covid-19 advance in other countries are also given.
Keywords: Covid-19; SIRD; data-driven models; interactive platform; machine learning.
Conflict of interest statement
The authors declare no conflict of interest.
Figures
Similar articles
-
Forecasting Covid-19 Dynamics in Brazil: A Data Driven Approach.Int J Environ Res Public Health. 2020 Jul 15;17(14):5115. doi: 10.3390/ijerph17145115. Int J Environ Res Public Health. 2020. PMID: 32679861 Free PMC article.
-
Mathematical modeling of the transmission of SARS-CoV-2-Evaluating the impact of isolation in São Paulo State (Brazil) and lockdown in Spain associated with protective measures on the epidemic of CoViD-19.PLoS One. 2021 Jun 15;16(6):e0252271. doi: 10.1371/journal.pone.0252271. eCollection 2021. PLoS One. 2021. PMID: 34129608 Free PMC article.
-
Mathematical model describing CoViD-19 in São Paulo, Brazil - evaluating isolation as control mechanism and forecasting epidemiological scenarios of release.Epidemiol Infect. 2020 Jul 20;148:e155. doi: 10.1017/S0950268820001600. Epidemiol Infect. 2020. PMID: 32684175 Free PMC article.
-
Genomic monitoring of the SARS-CoV-2 B1.1.7 (WHO VOC Alpha) in the Sao Paulo state, Brazil.Virus Res. 2022 Jan 15;308:198643. doi: 10.1016/j.virusres.2021.198643. Epub 2021 Nov 27. Virus Res. 2022. PMID: 34848213 Free PMC article.
-
[The social geography of AIDS in Brazil].Rev Saude Publica. 1995 Feb;29(1):52-62. doi: 10.1590/s0034-89101995000100009. Rev Saude Publica. 1995. PMID: 8525314 Review. Portuguese.
Cited by
-
Local protection bubbles: an interpretation of the slowdown in the spread of coronavirus in the city of São Paulo, Brazil, in July 2020.Cad Saude Publica. 2023 Dec 15;39(11):e00109522. doi: 10.1590/0102-311XEN109522. eCollection 2023. Cad Saude Publica. 2023. PMID: 38126417 Free PMC article.
-
Space-Distributed Traffic-Enhanced LSTM-Based Machine Learning Model for COVID-19 Incidence Forecasting.Comput Intell Neurosci. 2022 Nov 18;2022:4307708. doi: 10.1155/2022/4307708. eCollection 2022. Comput Intell Neurosci. 2022. PMID: 36438691 Free PMC article.
-
Using machine learning models to predict the duration of the recovery of COVID-19 patients hospitalized in Fangcang shelter hospital during the Omicron BA. 2.2 pandemic.Front Med (Lausanne). 2022 Nov 2;9:1001801. doi: 10.3389/fmed.2022.1001801. eCollection 2022. Front Med (Lausanne). 2022. PMID: 36405610 Free PMC article.
-
Interpretable Temporal Attention Network for COVID-19 forecasting.Appl Soft Comput. 2022 May;120:108691. doi: 10.1016/j.asoc.2022.108691. Epub 2022 Mar 9. Appl Soft Comput. 2022. PMID: 35281183 Free PMC article.
-
Dual attention-based sequential auto-encoder for Covid-19 outbreak forecasting: A case study in Vietnam.Expert Syst Appl. 2022 Oct 1;203:117514. doi: 10.1016/j.eswa.2022.117514. Epub 2022 May 13. Expert Syst Appl. 2022. PMID: 35607612 Free PMC article.
References
-
- World Health Organization WHO Coronavirus Disease (COVID-19) Dashboard. [(accessed on 8 November 2020)];2020 Available online: https://covid19.who.int/region/amro/country/br.
-
- Ministry of Health (Brazil) Brazilian Coronavirus Disease (COVID-19) Dashboard. [(accessed on 8 October 2020)];2020 Available online: https://covid.saude.gov.br.
-
- Worldometers COVID-19 Coronavirus Pandemic. [(accessed on 9 October 2020)];2020 Available online: https://www.worldometers.info/coronavirus.
-
- Johns Hopkins University COVID-19 Data Repository by the Center for Systems Science and Engineering (CSSE) at Johns Hopkins University. [(accessed on 20 November 2020)];2020 Available online: https://github.com/CSSEGISandData/COVID-19.
-
- de Salles Neto L.L., Martins C.B., Chaves A.A., Konstantyner T.C.R.D.O.K., Yanasse H.H., Campos C.B.L.D., Bellini A.J.A.D.O., Butkeraites R.B., Correia L., Magro I.L., et al. Forecast UTI: Application for predicting intensive care unit beds in the context of the COVID-19 pandemic. Epidemiol. Serviços de Saúde. 2020;29:e2020391. doi: 10.1590/s1679-49742020000400023. - DOI - PubMed
MeSH terms
Grants and funding
LinkOut - more resources
Full Text Sources
Other Literature Sources
Medical
