. 2021 Jan 13;14(2):367.
doi: 10.3390/ma14020367.

Advanced Constitutive Modeling of the Thixotropic Elasto-Visco-Plastic Behavior of Blood: Steady-State Blood Flow in Microtubes

Affiliations

Advanced Constitutive Modeling of the Thixotropic Elasto-Visco-Plastic Behavior of Blood: Steady-State Blood Flow in Microtubes

Konstantinos Giannokostas et al. Materials (Basel). .

Abstract

The present work focuses on the in-silico investigation of the steady-state blood flow in straight microtubes, incorporating advanced constitutive modeling for human blood and blood plasma. The blood constitutive model accounts for the interplay between thixotropy and elasto-visco-plasticity via a scalar variable that describes the level of the local blood structure at any instance. The constitutive model is enhanced by the non-Newtonian modeling of the plasma phase, which features bulk viscoelasticity. Incorporating microcirculation phenomena such as the cell-free layer (CFL) formation or the Fåhraeus and the Fåhraeus-Lindqvist effects is an indispensable part of the blood flow investigation. The coupling between them and the momentum balance is achieved through correlations based on experimental observations. Notably, we propose a new simplified form for the dependence of the apparent viscosity on the hematocrit that predicts the CFL thickness correctly. Our investigation focuses on the impact of the microtube diameter and the pressure-gradient on velocity profiles, normal and shear viscoelastic stresses, and thixotropic properties. We demonstrate the microstructural configuration of blood in steady-state conditions, revealing that blood is highly aggregated in narrow tubes, promoting a flat velocity profile. Additionally, the proper accounting of the CFL thickness shows that for narrow microtubes, the reduction of discharged hematocrit is significant, which in some cases is up to 70%. At high pressure-gradients, the plasmatic proteins in both regions are extended in the flow direction, developing large axial normal stresses, which are more significant in the core region. We also provide normal stress predictions at both the blood/plasma interface (INS) and the tube wall (WNS), which are difficult to measure experimentally. Both decrease with the tube radius; however, they exhibit significant differences in magnitude and type of variation. INS varies linearly from 4.5 to 2 Pa, while WNS exhibits an exponential decrease taking values from 50 mPa to zero.

Keywords: CFL; aggregation; amp; blood flow; blood thixotropy; blood viscoelasticity; fåhraeus effect; hemodynamics; interfacial shear & microtubes; normal stresses; personalized hemorheology; plasma viscoelasticity; relaxation time; rouleaux; wall shear &.


Conflict of interest statement

The authors declare no conflict of interest.

Figures

Figure A1
Figure A1
(a) The predictions of our proposed expression (Equation (20)) for relative apparent viscosity against experimental data reported by Pries and Secomb [73]. (b) Cell-free layer variation with respect to the tube radius and different values of core hematocrit based on Equation (20) for two different constitutive models applied in the core-annular flow problem described in Section 2.
Figure A2
Figure A2
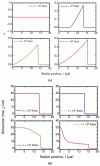
Time evolution of (a) axial velocity Uz, and (b) structure parameter λ from fully structured state to steady-state.
Figure 1
Figure 1
Schematic representation of a microtube of a radius R. It consists of a central RBC-rich region of radius δ, and an annular layer full of plasma and adjacent to the tube wall of thickness w=Rδ.
Figure 2
Figure 2
Validation of our model predictions with experimental data. Blue solid lines are steady-state simulation results of our model while open circles and cubes are experimental measurements for (a) velocity profile for R = 20 μm under the hemorheological conditions reported in Bugliarello and Sevilla [76], (b) velocity profile for R = 35 μm under the hemorheological conditions reported in Bugliarello and Sevilla [76], (c) Normalized thickness of CFL from various experimental investigations [5,77,78] accompanied with the predictions of a Newtonian model [26], the model of Casson [63] and Moyers-Gonzalez and Owens [46], (d) Total flow rate for the flow conditions reported in Bugliarello and Sevilla [76] for R = 20 μm, (e) Comparison of wall shear stress predictions with respect to pseudo shear rate γ˙¯ between TEVP and experimental observations from [79]. Comparison of relative wall shear stress WSSrel for various pseudo shear rates γ˙¯ between TEVP, Casson models and the experimental data from [80] for (f) R=15 μm and (g) R=50 μm.
Figure 2
Figure 2
Validation of our model predictions with experimental data. Blue solid lines are steady-state simulation results of our model while open circles and cubes are experimental measurements for (a) velocity profile for R = 20 μm under the hemorheological conditions reported in Bugliarello and Sevilla [76], (b) velocity profile for R = 35 μm under the hemorheological conditions reported in Bugliarello and Sevilla [76], (c) Normalized thickness of CFL from various experimental investigations [5,77,78] accompanied with the predictions of a Newtonian model [26], the model of Casson [63] and Moyers-Gonzalez and Owens [46], (d) Total flow rate for the flow conditions reported in Bugliarello and Sevilla [76] for R = 20 μm, (e) Comparison of wall shear stress predictions with respect to pseudo shear rate γ˙¯ between TEVP and experimental observations from [79]. Comparison of relative wall shear stress WSSrel for various pseudo shear rates γ˙¯ between TEVP, Casson models and the experimental data from [80] for (f) R=15 μm and (g) R=50 μm.
Figure 3
Figure 3
Comparison between the TEVP model with the inelastic model of Casson [63] regarding the velocity profiles within a microtube for (a) R =10 μm and (b) R =40 μm, (c) Interfacial axial velocity Uint as a function of the tube radius and (d) Wall Shear Stress (WSS) with respect to the radius of the microtube. Here, Hc =45% and Umean =1 mm/s.
Figure 4
Figure 4
(a) Normal viscoelastic stress τve,zz, and (b) Shear viscoelastic stress τve,rz for R = 20 μm, J = 5×10⁵ Pa/m, and Hc=0.45.
Figure 5
Figure 5
Axial velocity profile, Uzr, along the radial position for the tube radius equal to 10 μm, 20 μm, 50 μm, and 80 μm, for J = 104 Pa/m and Hc=0.45.
Figure 6
Figure 6
Distribution of the structure parameter λ along the radial position for tube radius equal to 10 μm, 20 μm, 50 μm, and 80 μm, for J = 104 Pa/m and Hc=0.45.
Figure 7
Figure 7
Variation of the bluntness parameter β with the tube radius, for J = 104 Pa/m.
Figure 8
Figure 8
Normal viscoelastic stress τve,zz along the radial position r for the tube radius R equal to 10 μm,  20 μm, 50 μm, and 80 μm for J = 104 Pa/m and Hc=0.45.
Figure 9
Figure 9
Shear viscoelastic stress τve,rz along the radial position r for tube radius R equal to 10 μm,  20 μm, 50 μm, and 80 μm for J = 104 Pa/m and Hc=0.45.
Figure 10
Figure 10
Distribution of (a) Parameter φ and (b) Relaxation time χ along the radial position r for tube radius of 10 μm,  20 μm, 50 μm, and 80 μm for J = 104 Pa/m and Hc=0.45.
Figure 11
Figure 11
(a) Mean structure parameter λ¯, (b) Fully structured region rf as a percentage of the radius of the tube R, (c) Normalized plug velocity size rc along with the experimental data of Gupta and Seshadri [89] for the same quantity and (d) Mean relaxation time χ¯ as a function of the microtube radius. In all cases J = 104 Pa/m and Hc=0.45.
Figure 11
Figure 11
(a) Mean structure parameter λ¯, (b) Fully structured region rf as a percentage of the radius of the tube R, (c) Normalized plug velocity size rc along with the experimental data of Gupta and Seshadri [89] for the same quantity and (d) Mean relaxation time χ¯ as a function of the microtube radius. In all cases J = 104 Pa/m and Hc=0.45.
Figure 12
Figure 12
(a) Interfacial (ISS) and Wall (WSS) Shear Stresses and (b) Interfacial (INS ) and Wall (WNS) Normal Stresses as a function of the tube radius R for Umean = 1 mm/s and Hc=0.45.
Figure 13
Figure 13
(a) Maximum axial velocity Umax, and (b) Interfacial axial velocity Uint as a function of tube radius R for J = 104 Pa/m and Hc=0.45.
Figure 14
Figure 14
(a) Cell-free layer thickness w, (b) discharged hematocrit Hd, and (c) the relative apparent viscosity ηrel, as a function of tube radius R for J = 104 Pa/m and Hc=0.45.
Figure 15
Figure 15
Axial velocity profile along the radial position for pressure gradient J equal to 102 Pa/m, 103 Pa/m, 104 Pa/m, and 105 Pa/m for R = 20 μm and Hc=0.45.
Figure 16
Figure 16
Distribution of the structure parameter λ along the radial position for different pressure gradients J equal to 102 Pa/m, 103 Pa/m, 104 Pa/m, and 105 Pa/m, for R = 20 μm and Hc=0.45.
Figure 17
Figure 17
Normal viscoelastic stress τve,zz along the radial position for pressure gradient J equal to 102 Pa/m, 103 Pa/m, 104 Pa/m, and 105 Pa/m, for R = 20 μm and Hc=0.45.
Figure 18
Figure 18
Shear viscoelastic stress τve,rz along the radial position for different pressure gradients J equal to 102 Pa/m, 103 Pa/m, 104 Pa/m, and 105 Pa/m for R = 20 μm and Hc=0.45.
Figure 19
Figure 19
(a) Parameter φ along the radial position and (b) Relaxation time χ for different pressure gradients J equal to 102 Pa/m, 103 Pa/m, 104 Pa/m, and 105 Pa/m for R = 20 μm and Hc=0.45.
Figure 20
Figure 20
Prediction of (a) shear (ISS & WSS) and (b) normal (INS & WNS) interfacial and wall viscoelastic stresses as a function of the pressure gradient J for R = 20 μm and Hc=0.45.
Figure 21
Figure 21
Maximum Umax and interfacial velocity Uint as a function of pressure gradient J for R = 20 μm and Hc=0.45.
Figure 22
Figure 22
(a) Mean structure parameter λ¯, (b) Normalized plug-flow radius rc as a function of the pressure gradient J for R = 20 μm and Hc=0.45.

Similar articles

Cited by

References

    1. Varga Z., Flammer A.J., Steiger P., Haberecker M., Andermatt R., Zinkernagel A.S., Mehra M.R., Schuepbach R.A., Ruschitzka F., Moch H. Endothelial Cell Infection and Endotheliitis in COVID-19. Lancet. 2020;395:1417–1418. doi: 10.1016/S0140-6736(20)30937-5. - DOI - PMC - PubMed
    1. Zatz R., Brenner B.M. Pathogenesis of Diabetic Microangiopathy. The Hemodynamic View. Am. J. Med. 1986;80:443–453. doi: 10.1016/0002-9343(86)90719-9. - DOI - PubMed
    1. Pries A.R., Secomb T.W. Rheology of the Microcirculation. Clin. Hemorheol. Microcirc. 2003;29:143–148. - PubMed
    1. Giannokostas K., Moschopoulos P., Varchanis S., Dimakopoulos Y., Tsamopoulos J. Advanced Constitutive Modeling of the Thixotropic Elasto-Visco-Plastic Behavior of Blood: Description of the Model and Rheological Predictions. Materials. 2020;13:E4184. doi: 10.3390/ma13184184. - DOI - PMC - PubMed
    1. Reinke W., Gaehtgens P., Johnson P.C. Blood Viscosity in Small Tubes: Effect of Shear Rate, Aggregation, and Sedimentation. Am. J. Physiol. Heart Circ. Physiol. 1987;253:540–547. doi: 10.1152/ajpheart.1987.253.3.H540. - DOI - PubMed

LinkOut - more resources