

Multi-trait GWAS using imputed high-density genotypes from whole-genome sequencing identifies genes associated with body traits in Nile tilapia
- PMID: 33451291
- PMCID: PMC7811220
- DOI: 10.1186/s12864-020-07341-z
Multi-trait GWAS using imputed high-density genotypes from whole-genome sequencing identifies genes associated with body traits in Nile tilapia
Abstract
Background: Body traits are generally controlled by several genes in vertebrates (i.e. polygenes), which in turn make them difficult to identify through association mapping. Increasing the power of association studies by combining approaches such as genotype imputation and multi-trait analysis improves the ability to detect quantitative trait loci associated with polygenic traits, such as body traits.
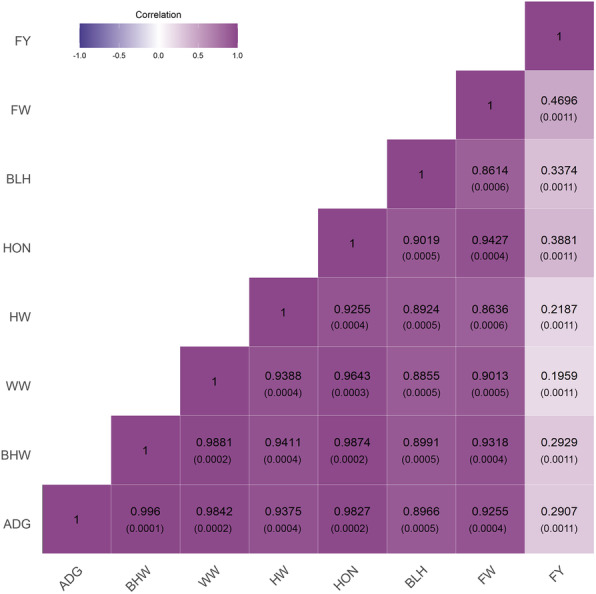
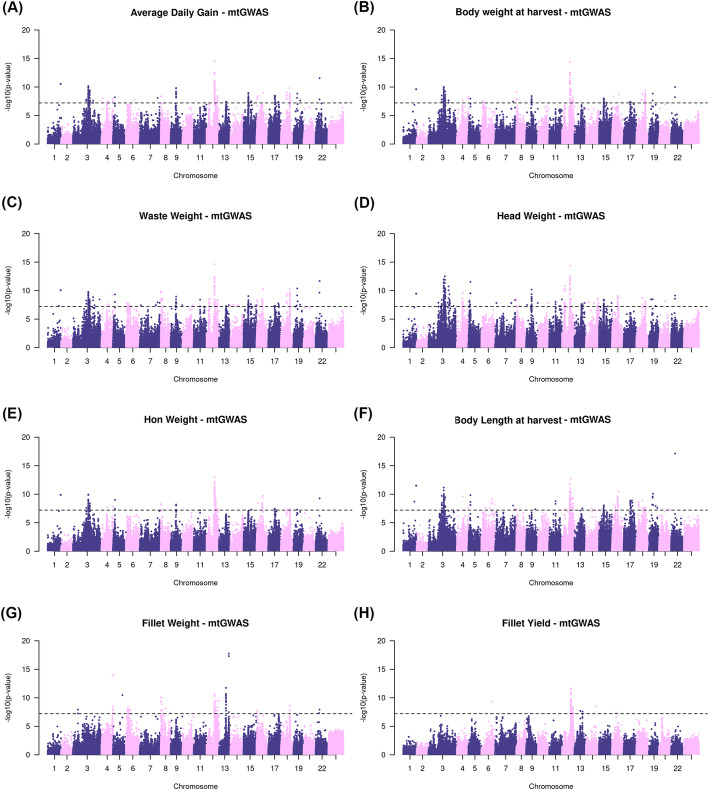
Results: A multi-trait genome-wide association study (mtGWAS) was performed to identify quantitative trait loci (QTL) and genes associated with body traits in Nile tilapia (Oreochromis niloticus) using genotypes imputed to whole-genome sequences (WGS). To increase the statistical power of mtGWAS for the detection of genetic associations, summary statistics from single-trait genome-wide association studies (stGWAS) for eight different body traits recorded in 1309 animals were used. The mtGWAS increased the statistical power from the original sample size from 13 to 44%, depending on the trait analyzed. The better resolution of the WGS data, combined with the increased power of the mtGWAS approach, allowed the detection of significant markers which were not previously found in the stGWAS. Some of the lead single nucleotide polymorphisms (SNPs) were found within important functional candidate genes previously associated with growth-related traits in other terrestrial species. For instance, we identified SNP within the α1,6-fucosyltransferase (FUT8), solute carrier family 4 member 2 (SLC4A2), A disintegrin and metalloproteinase with thrombospondin motifs 9 (ADAMTS9) and heart development protein with EGF like domains 1 (HEG1) genes, which have been associated with average daily gain in sheep, osteopetrosis in cattle, chest size in goats, and growth and meat quality in sheep, respectively.
Conclusions: The high-resolution mtGWAS presented here allowed the identification of significant SNPs, linked to strong functional candidate genes, associated with body traits in Nile tilapia. These results provide further insights about the genetic variants and genes underlying body trait variation in cichlid fish with high accuracy and strong statistical support.
Keywords: Body traits; Genome-wide association study; Genotype imputation; Multi-trait; Oreochromis niloticus; Quantitative trait loci.
Conflict of interest statement
The authors declare that they have no competing interests.
Figures
References
-
- FAO . Fisheries and aquaculture software. FishStatJ - Software for Fishery and Aquaculture Statistical Time Series. 2019.
-
- Gjedrem T. Genetic improvement for the development of efficient global aquaculture: a personal opinion review. Aquaculture. 2012;344–349:12–22. doi: 10.1016/j.aquaculture.2012.03.003. - DOI
-
- Bentsen HB, Gjerde B, Nguyen NH, Rye M, Ponzoni RW, Palada de Vera MS, et al. Genetic improvement of farmed tilapias: Genetic parameters for body weight at harvest in Nile tilapia (Oreochromis niloticus) during five generations of testing in multiple environments. Aquaculture. 2012;338–341:56–65. doi: 10.1016/J.AQUACULTURE.2012.01.027. - DOI
-
- Khaw HL, Bovenhuis H, Ponzoni RW, Rezk MA, Charo-Karisa H, Komen H. Genetic analysis of Nile tilapia (Oreochromis niloticus) selection line reared in two input environments. Aquaculture. 2009;294:37–42. doi: 10.1016/J.AQUACULTURE.2009.05.025. - DOI
-
- Ponzoni RW, Hamzah A, Tan S, Kamaruzzaman N. Genetic parameters and response to selection for live weight in the GIFT strain of Nile Tilapia (Oreochromis niloticus) Aquaculture. 2005;247:203–210. doi: 10.1016/J.AQUACULTURE.2005.02.020. - DOI
MeSH terms
Grants and funding
LinkOut - more resources
Full Text Sources
Other Literature Sources
