

The product of trunk muscle area and density on the CT image is a good indicator of energy expenditure in patients with or at risk for COPD
- PMID: 33451329
- PMCID: PMC7811265
- DOI: 10.1186/s12931-021-01621-2
The product of trunk muscle area and density on the CT image is a good indicator of energy expenditure in patients with or at risk for COPD
Abstract
Background: Physical inactivity due to cachexia and muscle wasting is well recognized as a sign of poor prognosis in chronic obstructive pulmonary disease (COPD). However, there have been no reports on the relationship between trunk muscle measurements and energy expenditure parameters, such as the total energy expenditure (TEE) and physical activity level (PAL), in COPD. In this study, we investigated the associations of computed tomography (CT)-derived muscle area and density measurements with clinical parameters, including TEE and PAL, in patients with or at risk for COPD, and examined whether these muscle measurements serve as an indicator of TEE and PAL.
Methods: The study population consisted of 36 male patients with (n = 28, stage 1-4) and at risk for (n = 8) COPD aged over 50 years. TEE was measured by the doubly labeled water method, and PAL was calculated as the TEE/basal metabolic rate estimated by the indirect method. The cross-sectional areas and densities of the pectoralis muscles, rectus abdominis muscles, and erector spinae muscles were measured. We evaluated the relationship between these muscle measurements and clinical outcomes, including body composition, lung function, muscle strength, TEE, and PAL.
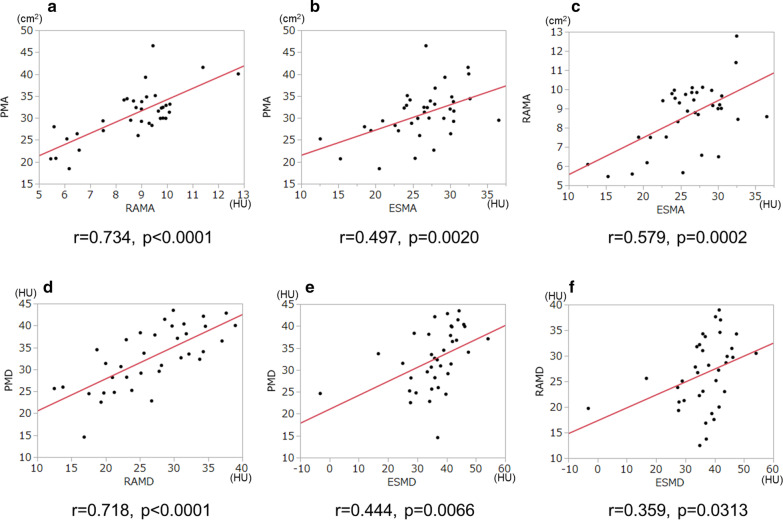
Results: All the muscle areas were significantly associated with TEE, severity of emphysema, and body composition indices such as body mass index, fat-free mass, and trunk muscle mass. All trunk muscle densities were correlated with PAL. The product of the rectus abdominis muscle area and density showed the highest association with TEE (r = 0.732) and PAL (r = 0.578). Several trunk muscle measurements showed significant correlations with maximal inspiratory and expiratory pressures, indicating their roles in respiration.
Conclusions: CT-derived measurements for trunk muscles are helpful in evaluating physical status and function in patients with or at risk for COPD. Particularly, trunk muscle evaluation may be a useful marker reflecting TEE and PAL.
Keywords: Chronic obstructive pulmonary disease; Computed tomography; Energy expenditure; Physical activity level; Trunk muscle.
Conflict of interest statement
The authors declare that they have no competing interests.
Figures


References
MeSH terms
Grants and funding
LinkOut - more resources
Full Text Sources
Other Literature Sources
Medical
