. 2021 Jan 15;22(1):85.
doi: 10.1186/s12891-021-03958-7.

HEMGN and SLC2A1 might be potential diagnostic biomarkers of steroid-induced osteonecrosis of femoral head: study based on WGCNA and DEGs screening

Affiliations

HEMGN and SLC2A1 might be potential diagnostic biomarkers of steroid-induced osteonecrosis of femoral head: study based on WGCNA and DEGs screening

Zhixin Wu et al. BMC Musculoskelet Disord. .

Abstract

Background: Steroid-induced osteonecrosis of the femoral head (SONFH) is a chronic and crippling bone disease. This study aims to reveal novel diagnostic biomarkers of SONFH.

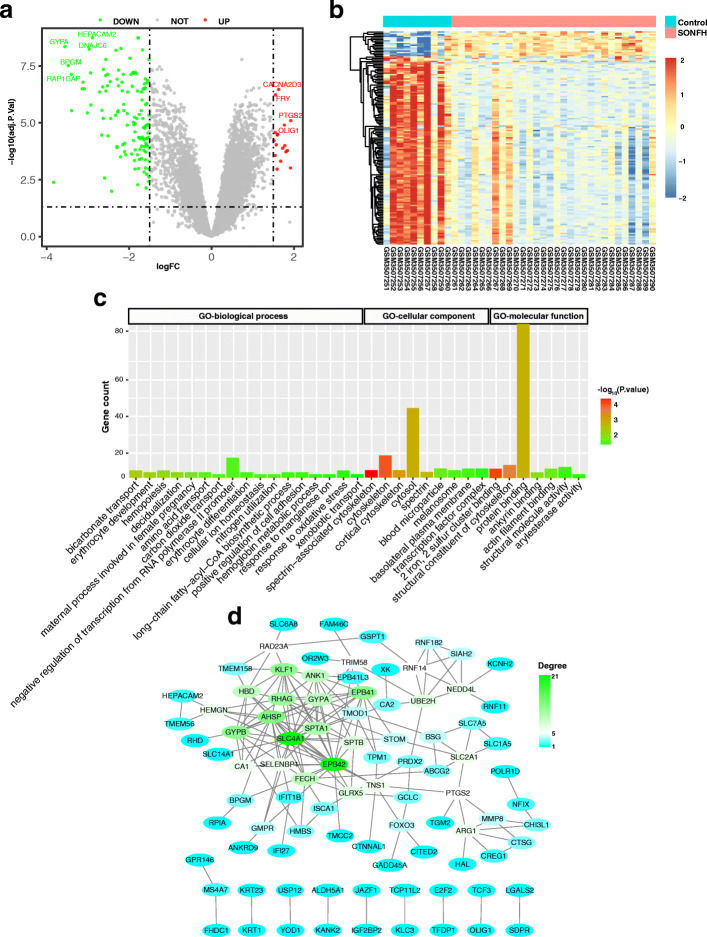
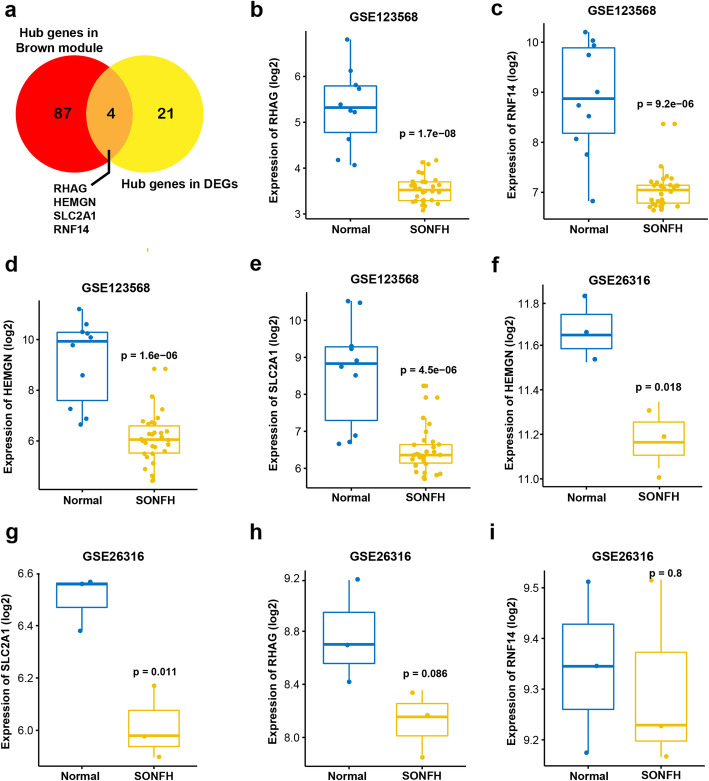
Methods: The GSE123568 dataset based on peripheral blood samples from 10 healthy individuals and 30 SONFH patients was used for weighted gene co-expression network analysis (WGCNA) and differentially expressed genes (DEGs) screening. The genes in the module related to SONFH and the DEGs were extracted for Gene Ontology (GO) and Kyoto Encyclopedia of Genes and Genomes (KEGG) pathway enrichment analysis. Genes with |gene significance| > 0.7 and |module membership| > 0.8 were selected as hub genes in modules. The DEGs with the degree of connectivity ≥5 were chosen as hub genes in DEGs. Subsequently, the overlapping genes of hub genes in modules and hub genes in DEGs were selected as key genes for SONFH. And then, the key genes were verified in another dataset, and the diagnostic value of key genes was evaluated by receiver operating characteristic (ROC) curve.

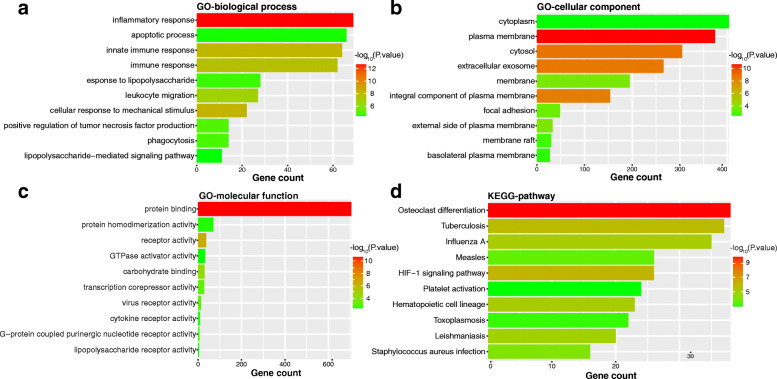
Results: Nine gene co-expression modules were constructed via WGCNA. The brown module with 1258 genes was most significantly correlated with SONFH and was identified as the key module for SONFH. The results of functional enrichment analysis showed that the genes in the key module were mainly enriched in the inflammatory response, apoptotic process and osteoclast differentiation. A total of 91 genes were identified as hub genes in the key module. Besides, 145 DEGs were identified by DEGs screening and 26 genes were identified as hub genes of DEGs. Overlapping genes of hub genes in the key module and hub genes in DEGs, including RHAG, RNF14, HEMGN, and SLC2A1, were further selected as key genes for SONFH. The diagnostic value of these key genes for SONFH was confirmed by ROC curve. The validation results of these key genes in GSE26316 dataset showed that only HEMGN and SLC2A1 were downregulated in the SONFH group, suggesting that they were more likely to be diagnostic biomarkers of SOFNH than RHAG and RNF14.

Conclusions: Our study identified that two key genes, HEMGN and SLC2A1, might be potential diagnostic biomarkers of SONFH.

Keywords: Diagnostic biomarkers; Differentially expressed genes; Peripheral blood; Steroid-induced osteonecrosis of the femoral head; Weighted gene correlation network analysis.


Conflict of interest statement

The authors declare that they have no competing interests.

Figures

Fig. 1
Fig. 1
Flowchart used in the present study. GEO, Gene Expression Omnibus; MAD, median absolute deviation; WGCNA, weighted gene co-expression network analysis; DEGs, differentially expressed genes; PPI, protein-protein interaction; abs, absolute value; GS, gene significance; MM, module membership; ROC, receiver operating characteristic
Fig. 2
Fig. 2
Sample clustering and soft threshold screening. a Sample clustering to detect outliers and the trait heatmap to display the sample traits. b Analysis of the scale-free fit index for various soft-thresholding powers (β). c Analysis of the mean connectivity for different soft-thresholding powers. d Histogram of the connectivity distribution when β = 4. e Verification of the scale-free topology when β = 4. WGCNA, weighted gene co-expression network analysis
Fig. 3
Fig. 3
WGCNA of samples. a The cluster dendrogram of genes. b Module–trait relationships. Each cell consists of the corresponding correlation and P-value, which are color-coded by correlated according to the color legend. c Distribution of average gene significance and errors in the modules associated with SONFH status. d Visualizing all genes from the network using a heatmap plot to depict the TOM among the genes in the analysis. e The combination of eigengene dendrogram and heatmap. f A scatter plot of the GS for SONFH versus the MM in the brown module. WGCNA, weighted gene co-expression network analysis; TOM, topological overlap matrix; SONFH, steroid-induced osteonecrosis of the femoral head; GS, gene significance; MM, module membership
Fig. 4
Fig. 4
Functional enrichment analysis of genes related to SONFH. a The top 10 functional terms of GO-BP enrichment analysis. b The top 10 functional terms GO-CC enrichment analysis. c The top 10 functional terms GO-MF enrichment analysis. d The top 10 pathways of KEGG enrichment analysis. SONFH, steroid-induced osteonecrosis of the femoral head; GO, Gene Ontology; BP, biological process; CC, cellular component; MF, molecular function; KEGG, Kyoto Encyclopedia of Genes and Genomes
Fig. 5
Fig. 5
Analysis of DEGs. a, b Volcano and heatmap of DEGs between healthy individuals and SONFH patients. The adjusted P-value < 0.05 and |log2(fold change| > 1.5 and were used as the cut-off threshold. c The GO-BP, GO-CC and GO-MF functional terms identified after functional enrichment analysis of the DEGs. d PPI network analysis of DEGs. DEGs, differentially expressed genes; SONFH, steroid-induced osteonecrosis of the femoral head; GO, Gene Ontology; BP, biological process; CC, cellular component; MF, molecular function; PPI, protein-protein interaction network
Fig. 6
Fig. 6
Analysis of key genes. a The Venn diagram of hub genes in the brown module and hub genes in DEGs. b-e Expression of RHAG, RNF14, HEMGN, SLC2A1 in the GSE123568 data set. f-i Expression of RHAG, RNF14, HEMGN, SLC2A1 in the GSE26316 dataset. P < 0.05 is considered statistically significant
Fig. 7
Fig. 7
The ROC curve of key genes in SONFH. a RHAG. b RNF14. c HEMGN. d SLC2A1. The x-axis shows specificity, and the y-axis shows sensitivity. ROC, receiver operating characteristic; AUC: area under the ROC curve

Similar articles

Cited by

References

    1. Mont MA, Cherian JJ, Sierra RJ, Jones LC, Lieberman JR. Nontraumatic osteonecrosis of the femoral head: where do we stand today? A ten-year update. J Bone Joint Surg Am. 2015;97(19):1604–1627. doi: 10.2106/JBJS.O.00071. - DOI - PubMed
    1. Barney J, Piuzzi NS, Akhondi H. Femoral Head Avascular Necrosis. StatPearls. https://www.ncbi.nlm.nih.gov/books/NBK546658/#article-76242.s14. Accessed 6 July 2020. - PubMed
    1. Zhao DW, Yu M, Hu K, Wang W, Yang L, Wang BJ, Gao XH, Guo YM, Xu YQ, Wei YS, et al. Prevalence of nontraumatic osteonecrosis of the femoral head and its associated risk factors in the Chinese population: results from a nationally representative survey. Chin Med J. 2015;128(21):2843–2850. doi: 10.4103/0366-6999.168017. - DOI - PMC - PubMed
    1. Ikeuchi K, Hasegawa Y, Seki T, Takegami Y, Amano T, Ishiguro N. Epidemiology of nontraumatic osteonecrosis of the femoral head in Japan. Mod Rheumatol. 2015;25(2):278–281. doi: 10.3109/14397595.2014.932038. - DOI - PubMed
    1. Moya-Angeler J, Gianakos AL, Villa JC, Ni A, Lane JM. Current concepts on osteonecrosis of the femoral head. World J Orthop. 2015;6(8):590–601. doi: 10.5312/wjo.v6.i8.590. - DOI - PMC - PubMed

LinkOut - more resources