. 2021 Jan 15;13(1):27.
doi: 10.1186/s13195-020-00765-5.

Longitudinal amyloid and tau accumulation in autosomal dominant Alzheimer's disease: findings from the Colombia-Boston (COLBOS) biomarker study

Affiliations

Longitudinal amyloid and tau accumulation in autosomal dominant Alzheimer's disease: findings from the Colombia-Boston (COLBOS) biomarker study

Justin S Sanchez et al. Alzheimers Res Ther. .

Abstract

Background: Neuroimaging studies of autosomal dominant Alzheimer's disease (ADAD) enable characterization of the trajectories of cerebral amyloid-β (Aβ) and tau accumulation in the decades prior to clinical symptom onset. Longitudinal rates of regional tau accumulation measured with positron emission tomography (PET) and their relationship with other biomarker and cognitive changes remain to be fully characterized in ADAD.

Methods: Fourteen ADAD mutation carriers (Presenilin-1 E280A) and 15 age-matched non-carriers from the Colombian kindred underwent 2-3 sessions of Aβ (11C-Pittsburgh compound B) and tau (18F-flortaucipir) PET, structural magnetic resonance imaging, and neuropsychological evaluation over a 2-4-year follow-up period. Annualized rates of change for imaging and cognitive variables were compared between carriers and non-carriers, and relationships among baseline measurements and rates of change were assessed within carriers.

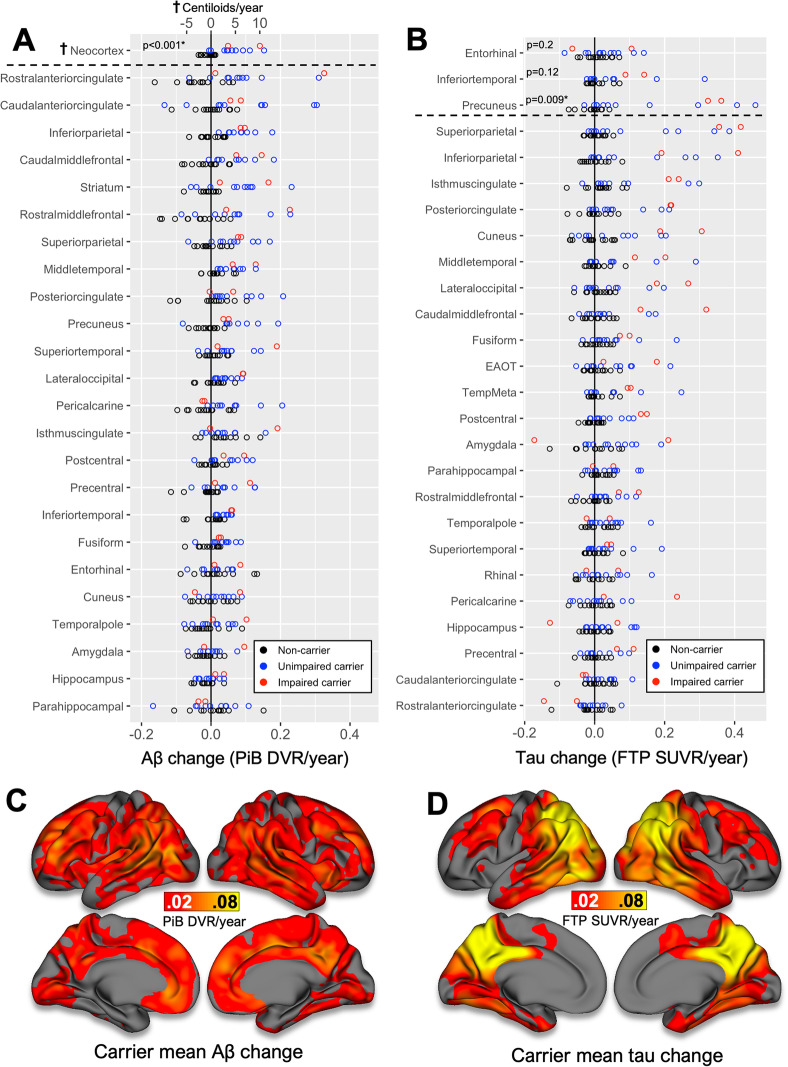
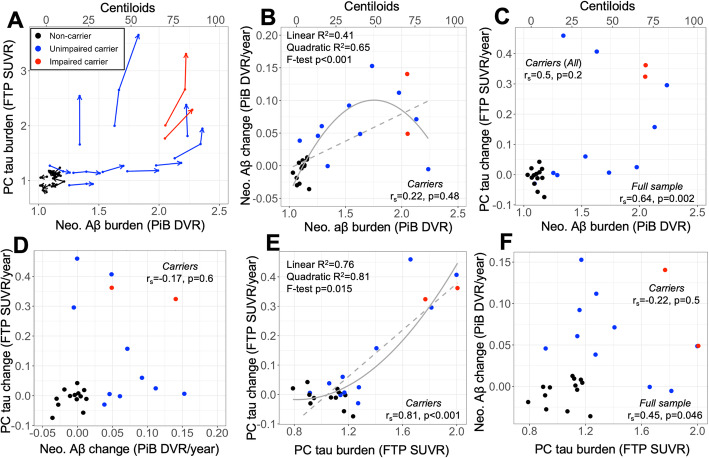
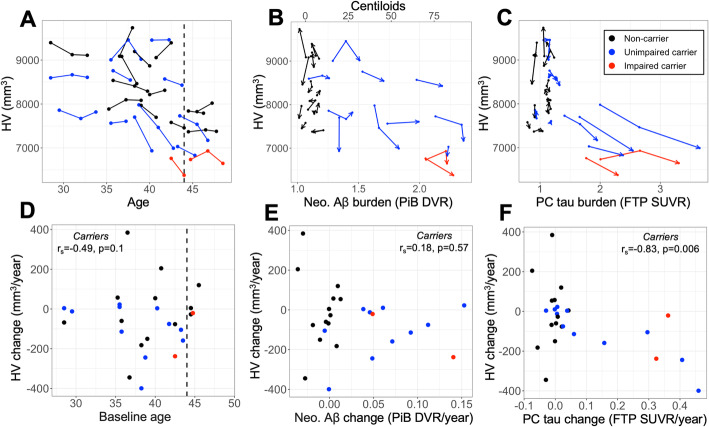
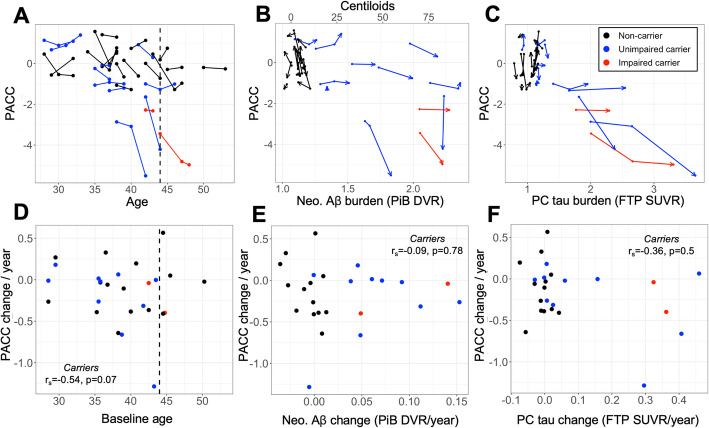
Results: Longitudinal measurements were consistent with a sequence of ADAD-related changes beginning with Aβ accumulation (16 years prior to expected symptom onset, EYO), followed by entorhinal cortex (EC) tau (9 EYO), neocortical tau (6 EYO), hippocampal atrophy (6 EYO), and cognitive decline (4 EYO). Rates of tau accumulation among carriers were most rapid in parietal neocortex (~ 9%/year). EC tau PET signal at baseline was a significant predictor of subsequent neocortical tau accumulation and cognitive decline within carriers.

Conclusions: Our results are consistent with the sequence of biological changes in ADAD implied by cross-sectional studies and highlight the importance of EC tau as an early biomarker and a potential link between Aβ burden and neocortical tau accumulation in ADAD.

Keywords: Alzheimer’s; Amyloid; Autosomal-Dominant; Imaging; Longitudinal; Tau.


Conflict of interest statement

Dr. Reiman reports receiving personal fees as a Scientific Advisor to Roche Diagnostics (travel expenses only), MagQ, Avid Radiopharmaceuticals, and is a share-holding co-founder of ALZPath, outside the submitted work. In addition, he is the inventor of a patent issued to Banner Health, which involves the use of biomarker endpoints in at-risk persons to accelerate the evaluation of Alzheimer’s disease prevention therapies and is outside the submitted work. Drs. Reiman and Lopera are principal investigators of the Alzheimer’s Prevention Initiative (API) Autosomal Dominant AD Trial, which is supported by NIA, philanthropy, Genentech, and Roche. Dr. Sperling is a site principal investigator or coinvestigator for Avid, Bristol-Myers Squibb, Pfizer, and Janssen Alzheimer Immunotherapy clinical trials. She receives travel funding and honoraria from AC Immune, Janssen, and Roche. She consults for Biogen, Roche, AC Immune, Eisai, Takeda, Neurocentria, and Janssen. Spouse consults for Novartis, AC Immune, and Janssen. Dr. Johnson has provided consulting services for Novartis, Biogen, and Eli Lilly. All other co-authors have no competing interests or disclosures relevant to the manuscript.

Figures

Fig. 1
Fig. 1
PSEN1 E280A mutation carriers show greater rates of tau and Aβ increase compared to non-carriers. Upper, dot plots of Aβ (a, left) and tau (b, right) PET change rates, expressed as annualized change in PiB DVR and FTP SUVR respectively, in all regions of interest (ROIs). Dots are color-encoded by carrier and cognitive status according to inset legend (lower right). Primary ROIs for each modality are shown above horizontal dashed line; other ROIs below the dashed line are ordered from top to bottom by highest to lowest mean change rate within all carriers. Neocortical Aβ change rates were normalized to the Centiloid scale, shown at top (); note that the Centiloid scale does not apply to any other ROI. Adjusted p values for group difference (Mann-Whitney, Bonferroni-Holms correction) between all carriers and non-carriers are given for primary ROIs (*p < 0.05 after multiple comparisons correction); other regions are shown for comparison with other studies but were not included in statistical analyses. EAOT = aggregate (unweighted average) of bilateral entorhinal, amygdala, occipital, and inferior temporal ROIs (Mishra et al. [33]); TempMeta = aggregate of bilateral entorhinal, amygdala, parahippocampal, fusiform, inferior and middle temporal (Jack et al. [20]). Lower, Surface visualization of mean rates of Aβ (c, left) and tau (d, right) change within all carriers, expressed as annualized change in PiB DVR and FTP SUVR, respectively, according to the color bar
Fig. 2
Fig. 2
Longitudinal Aβ and tau PET images in PSEN1 E280A carriers. Top left: Matrix showing baseline Aβ (PiB DVR) and tau (FTP SUVR) PET measures (color bar) for all subjects: Each column is a PET variable, and each row is a subject, separated by PSEN1 E280A carrier status and ordered by age increasing from top to bottom (right labels; expected age at symptom onset in carriers = 44 years, 95% CI [43–45]). Bottom left: Matrix showing annualized Aβ and tau PET change rates (color bar) for all subjects, arranged as above. Horizontal thick black line separates cognitively unimpaired carriers (UC, above line) from cognitively impaired carriers (IC, below line). We assessed Aβ burden in a large neocortical aggregate (Neo.) and tau burden in three primary ROIs: entorhinal cortex (EC), inferior temporal gyrus (IT), and precuneus (PC). Four exemplary cases are labeled (A–D), with corresponding baseline and 2-year follow-up PET slice data shown at right. A–D: Aβ (PiB DVR, left) and tau (FTP SUVR. right) PET images at baseline and 2-year follow-up in coronal (upper) and sagittal (lower) slices for four exemplary cases, labeled in color matrices at left. Age and carrier status are given for each participant (y/o, years old; NC, non-carrier; UC, unimpaired carrier; IC, impaired carrier)
Fig. 3
Fig. 3
Steady Aβ accumulation precedes rapid neocortical tau increase in PSEN1 E280a mutation carriers. Spaghetti plots show Aβ (top, a) and tau (bottom, d–f) PET levels in ROIs vs. age at baseline and 2–4-year follow-up; scatter plot (b) shows rates of Aβ accumulation vs. baseline age. Aβ PET (PiB DVR) was assessed in a neocortical aggregate (Neo., a–b); Neo. Aβ levels were normalized to an approximate Centiloid (CL) scale, shown in A-B at right; horizontal dashed line in a indicates previously-published high-PiB threshold DVR = 1.32 (15). Tau PET (FTP SUVR) was assessed in entorhinal (EC, d), inferior temporal (IT, e), and precuneus (PC, f) cortices. Vertical dashed line indicates expected age of cognitive symptom onset (44 years); horizontal dashed lines in (d–f) indicate two standard deviations above the mean FTP SUVR in non-carriers (EC: 1.26, IT: 1.42, PC: 1.30). Dots and lines are colored by subject group according to inset legend (top, center). c Gives the Spearman correlations between age and annualized change rates (i.e., slopes) in each PET variable (rows) within carriers (N = 12) with p values after adjustment for multiple comparisons
Fig. 4
Fig. 4
Contemporaneous rates of Aβ and tau accumulation are not correlated among PSEN1 E280a mutation carriers. a Longitudinal trajectories of tau and Aβ burden, expressed as precuneus (PC) Flortaucipir (FTP) standardized uptake value ratio (SUVR) and neocortical (Neo.) Pittsburgh Compound B (PiB) distribution volume ratio (DVR), respectively. Lines and dots are colored by subject group according to inset legend, and arrowhead indicates most recent follow-up time point. b Relationship between baseline Aβ and Aβ change rate, which was quadratic in the full sample (inset text, top left). Linear and quadratic regression fits are shown as dashed and solid gray curves, respectively. c Relationship between baseline Aβ and PC tau change rates. d Relationship between Aβ and PC tau and change rates, expressed as annualized PiB DVR or FTP SUVR change, respectively. e Baseline PC tau vs PC tau change rate. Linear and quadratic regression fits are shown as dashed and solid gray curves, respectively. f Baseline PC tau vs Aβ change rate
Fig. 5
Fig. 5
Hippocampal volume loss occurs in temporal proximity to tau accumulation. Top, longitudinal trajectories of hippocampal volume (HV, adjusted for intracranial volume) by a age, b neocortical (Neo.) Aβ burden, and c precuneus (PC) tau. Arrowheads in b, c indicate most recent time point; lines are color-encoded by PSEN1 E280a carrier and clinical status according inset legend at top-right. Bottom, Relationships between annualized change in HV and d age, e neo. Aβ change rate, and f PC tau change rate. Inset text gives Spearman correlation and p value within carriers. HV change was marginally associated with and significantly associated with PC tau change rate, but not neo. Aβ change rate, suggesting that loss of HV occurs in temporal proximity to tau accumulation
Fig. 6
Fig. 6
PACC captures cognitive decline in carriers near expected symptom onset. Top, longitudinal trajectories of Preclinical Alzheimer’s Cognitive Composite (PACC) score by a age, b neocortical (Neo.) Aβ burden, and c precuneus (PC) tau. Arrowheads in b, c indicate most recent time point; lines are color-encoded by PSEN1-E280a carrier and clinical status according to the inset legend at top-right. Bottom, Relationships between annualized change in PACC and d age, e neo. Aβ change rate, and f PC tau change rate. Inset text gives Spearman correlation and p value within carriers. PACC change rate showed negative but non-significant associations with age and PC tau change rate, and no association with neo. Aβ change rate

References

    1. Arriagada PV, Marzloff K, Hyman BT. Distribution of Alzheimer-type pathologic changes in nondemented elderly individuals matches the pattern in Alzheimer’s disease. Neurology. 1992;42(9):1681–1688. doi: 10.1212/WNL.42.9.1681. - DOI - PubMed
    1. Morris JC, Storandt M, McKeel DW, Jr, Rubin EH, Price JL, Grant EA, et al. Cerebral amyloid deposition and diffuse plaques in “normal” aging: evidence for presymptomatic and very mild Alzheimer's disease. Neurology. 1996;46(3):707–719. doi: 10.1212/WNL.46.3.707. - DOI - PubMed
    1. Sperling R, Mormino E, Johnson K. The evolution of preclinical Alzheimer’s disease: implications for prevention trials. Neuron. 2014;84(3):608–622. doi: 10.1016/j.neuron.2014.10.038. - DOI - PMC - PubMed
    1. Clark RF, Hutton M, Fuldner M, Froelich S, Karran E, Talbot C, et al. The structure of the presenilin 1 (S182) gene and identification of six novel mutations in early onset AD families. Nat Genet. 1995;11(2):219–222. doi: 10.1038/ng1095-219. - DOI - PubMed
    1. Lemere CA, Lopera F, Kosik KS, Lendon CL, Ossa J, Saido TC, et al. The E280A presenilin 1 Alzheimer mutation produces increased Aβ42 deposition and severe cerebellar pathology. Nat Med. 1996;2(10):1146–1150. doi: 10.1038/nm1096-1146. - DOI - PubMed

Publication types