. 2020 Jan;19(1):11-30.
doi: 10.1074/mcp.RA119.001677. Epub 2019 Oct 7.

NIST Interlaboratory Study on Glycosylation Analysis of Monoclonal Antibodies: Comparison of Results from Diverse Analytical Methods

Maria Lorna A De Leoz  1 David L Duewer  2 Adam Fung  3 Lily Liu  3 Hoi Kei Yau  3 Oscar Potter  4 Gregory O Staples  4 Kenichiro Furuki  5 Ruth Frenkel  6 Yunli Hu  6 Zoran Sosic  6 Peiqing Zhang  7 Friedrich Altmann  8 Clemens Grunwald-Grube  8 Chun Shao  9 Joseph Zaia  9 Waltraud Evers  10 Stuart Pengelley  10 Detlev Suckau  10 Anja Wiechmann  10 Anja Resemann  10 Wolfgang Jabs  11 Alain Beck  12 John W Froehlich  13 Chuncui Huang  14 Yan Li  14 Yaming Liu  14 Shiwei Sun  15 Yaojun Wang  15 Youngsuk Seo  16 Hyun Joo An  16 Niels-Christian Reichardt  17 Juan Echevarria Ruiz  17 Stephanie Archer-Hartmann  18 Parastoo Azadi  18 Len Bell  19 Zsuzsanna Lakos  20 Yanming An  21 John F Cipollo  21 Maja Pucic-Bakovic  22 Jerko Štambuk  22 Gordan Lauc  23 Xu Li  24 Peng George Wang  24 Andreas Bock  25 René Hennig  25 Erdmann Rapp  26 Marybeth Creskey  27 Terry D Cyr  27 Miyako Nakano  28 Taiki Sugiyama  28 Pui-King Amy Leung  29 Paweł Link-Lenczowski  30 Jolanta Jaworek  30 Shuang Yang  31 Hui Zhang  31 Tim Kelly  32 Song Klapoetke  32 Rui Cao  32 Jin Young Kim  33 Hyun Kyoung Lee  33 Ju Yeon Lee  33 Jong Shin Yoo  33 Sa-Rang Kim  34 Soo-Kyung Suh  34 Noortje de Haan  35 David Falck  35 Guinevere S M Lageveen-Kammeijer  35 Manfred Wuhrer  35 Robert J Emery  36 Radoslaw P Kozak  36 Li Phing Liew  36 Louise Royle  36 Paulina A Urbanowicz  36 Nicolle H Packer  37 Xiaomin Song  37 Arun Everest-Dass  37 Erika Lattová  38 Samanta Cajic  39 Kathirvel Alagesan  40 Daniel Kolarich  40 Toyin Kasali  41 Viv Lindo  41 Yuetian Chen  42 Kudrat Goswami  42 Brian Gau  43 Ravi Amunugama  44 Richard Jones  44 Corné J M Stroop  45 Koichi Kato  46 Hirokazu Yagi  47 Sachiko Kondo  48 C T Yuen  49 Akira Harazono  50 Xiaofeng Shi  51 Paula E Magnelli  51 Brian T Kasper  52 Lara Mahal  52 David J Harvey  53 Roisin O'Flaherty  54 Pauline M Rudd  54 Radka Saldova  54 Elizabeth S Hecht  55 David C Muddiman  55 Jichao Kang  56 Prachi Bhoskar  57 Daniele Menard  57 Andrew Saati  57 Christine Merle  58 Steven Mast  59 Sam Tep  59 Jennie Truong  59 Takashi Nishikaze  60 Sadanori Sekiya  60 Aaron Shafer  61 Sohei Funaoka  62 Masaaki Toyoda  62 Peter de Vreugd  63 Cassie Caron  64 Pralima Pradhan  64 Niclas Chiang Tan  64 Yehia Mechref  65 Sachin Patil  66 Jeffrey S Rohrer  66 Ranjan Chakrabarti  67 Disha Dadke  67 Mohammedazam Lahori  67 Chunxia Zou  68 Christopher Cairo  68 Béla Reiz  69 Randy M Whittal  69 Carlito B Lebrilla  70 Lauren Wu  70 Andras Guttman  71 Marton Szigeti  72 Benjamin G Kremkow  73 Kelvin H Lee  73 Carina Sihlbom  74 Barbara Adamczyk  75 Chunsheng Jin  75 Niclas G Karlsson  75 Jessica Örnros  75 Göran Larson  76 Jonas Nilsson  76 Bernd Meyer  77 Alena Wiegandt  77 Emy Komatsu  78 Helene Perreault  78 Edward D Bodnar  79 Nassur Said  80 Yannis-Nicolas Francois  80 Emmanuelle Leize-Wagner  80 Sandra Maier  81 Anne Zeck  81 Albert J R Heck  82 Yang Yang  82 Rob Haselberg  83 Ying Qing Yu  84 William Alley  84 Joseph W Leone  85 Hua Yuan  85 Stephen E Stein  86
Affiliations

NIST Interlaboratory Study on Glycosylation Analysis of Monoclonal Antibodies: Comparison of Results from Diverse Analytical Methods

Maria Lorna A De Leoz et al. Mol Cell Proteomics. 2020 Jan.

Abstract

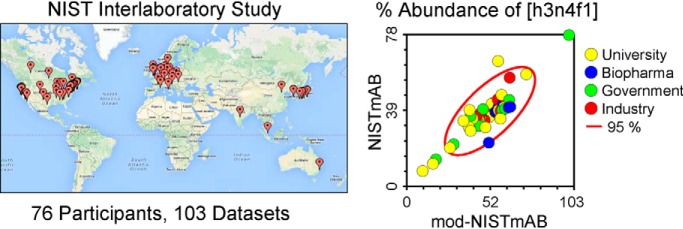
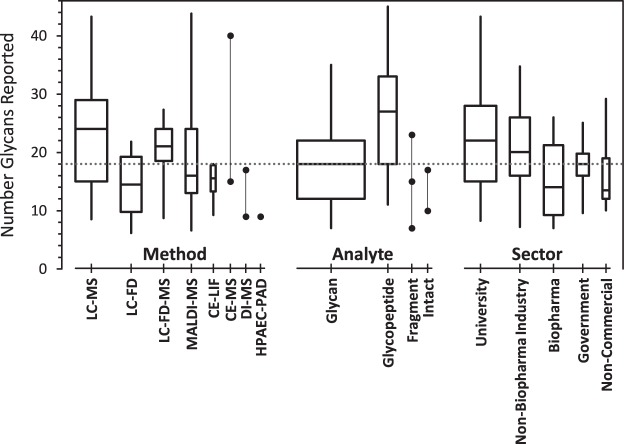
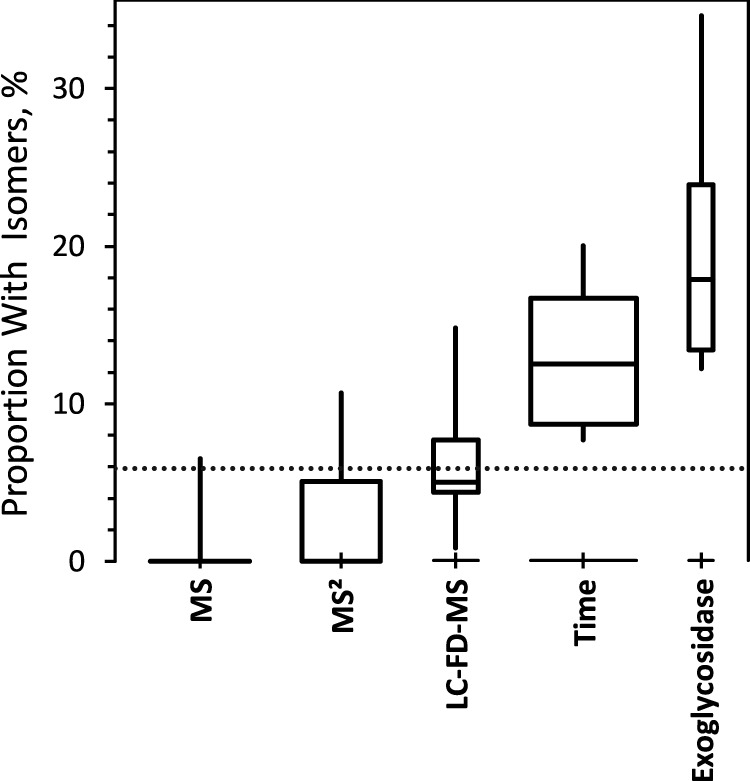
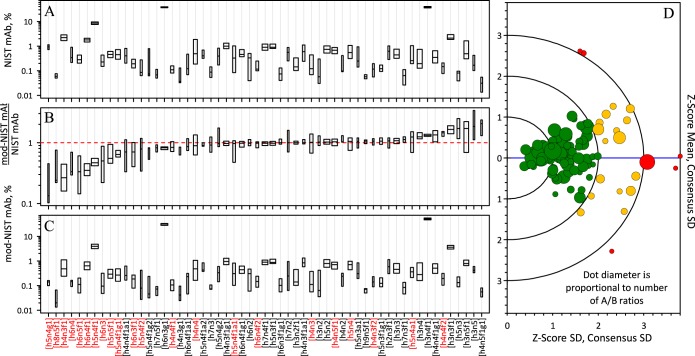
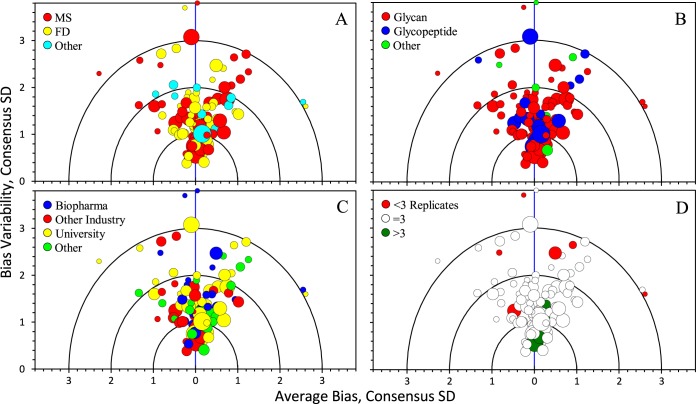
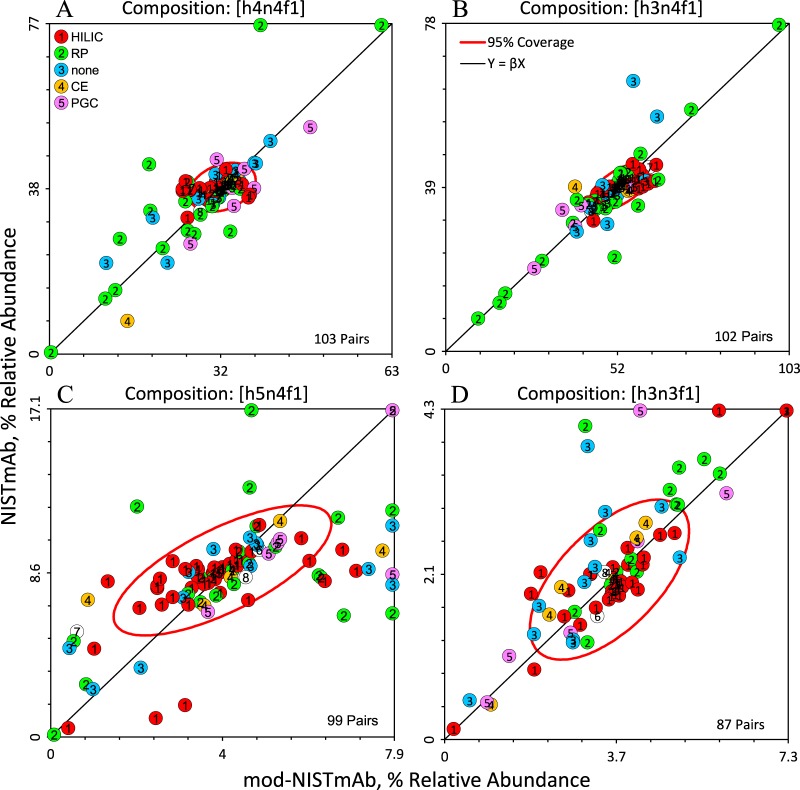
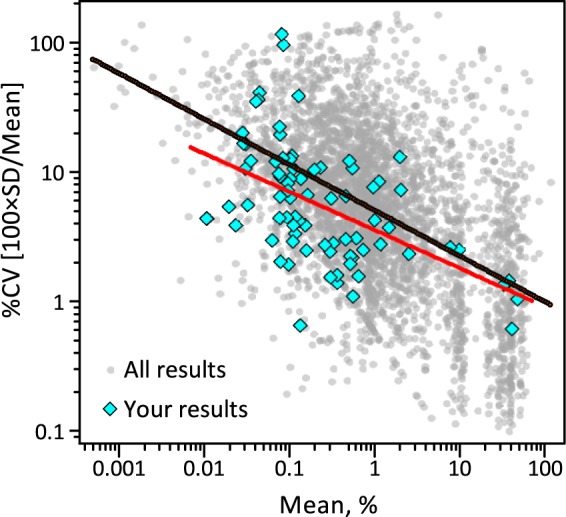
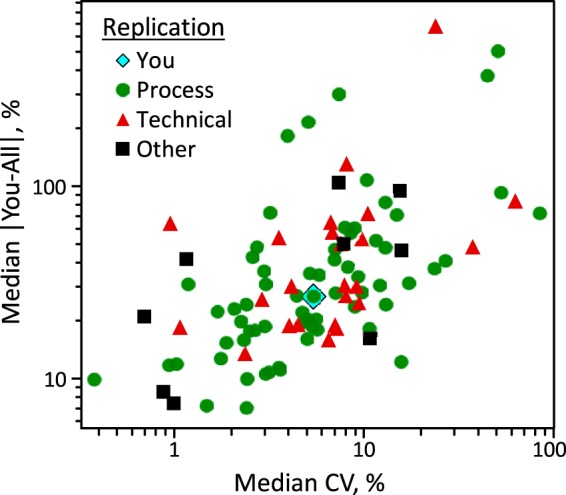
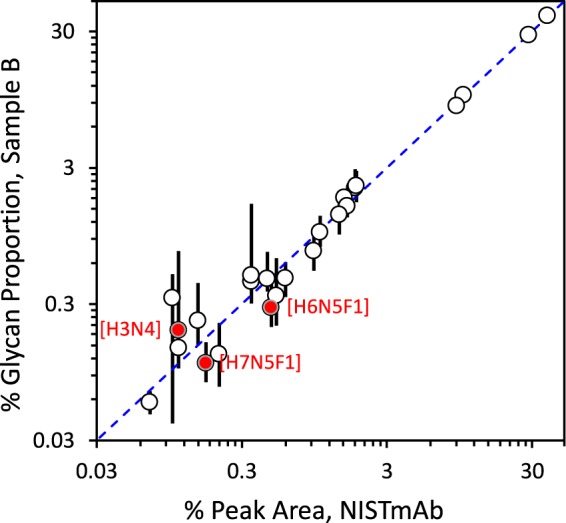
Glycosylation is a topic of intense current interest in the development of biopharmaceuticals because it is related to drug safety and efficacy. This work describes results of an interlaboratory study on the glycosylation of the Primary Sample (PS) of NISTmAb, a monoclonal antibody reference material. Seventy-six laboratories from industry, university, research, government, and hospital sectors in Europe, North America, Asia, and Australia submitted a total of 103 reports on glycan distributions. The principal objective of this study was to report and compare results for the full range of analytical methods presently used in the glycosylation analysis of mAbs. Therefore, participation was unrestricted, with laboratories choosing their own measurement techniques. Protein glycosylation was determined in various ways, including at the level of intact mAb, protein fragments, glycopeptides, or released glycans, using a wide variety of methods for derivatization, separation, identification, and quantification. Consequently, the diversity of results was enormous, with the number of glycan compositions identified by each laboratory ranging from 4 to 48. In total, one hundred sixteen glycan compositions were reported, of which 57 compositions could be assigned consensus abundance values. These consensus medians provide community-derived values for NISTmAb PS. Agreement with the consensus medians did not depend on the specific method or laboratory type. The study provides a view of the current state-of-the-art for biologic glycosylation measurement and suggests a clear need for harmonization of glycosylation analysis methods.

Keywords: Glycomics; NISTmAb; fluorescence; glycan; glycopeptide; glycoproteins; glycosylation; interlaboratory study; mass spectrometry; reference antibody.


Conflict of interest statement

The authors declare that they have no conflicts of interest with the contents of this article. Any mention of commercial products is for information only; it does not imply recommendation or endorsement by any of the participating institutions. The content is solely the responsibility of the authors and does not necessarily represent the official views of any of the participating institutions

Figures

None
Graphical abstract
Fig. 1.
Fig. 1.
Number of unique glycan compositions reported, grouped by method, analyte, and sector. The boxes span the central 50% of reported values, 25% to 75%; the whiskers span the central 90%, 5% to 95%; the central line marks the median, 50%. Box widths are proportional to the number of reports. Groups within each category are presented in order of decreasing number of reports. Solid circles represent individual results within categories of fewer than six reports. The dotted line marks the median number of compositions reported in the 103 reports provided by 76 laboratories.
Fig. 2.
Fig. 2.
Proportion of glycan compositions reported as isomers. The boxes span the central 50% of reported values, 25% to 75%; the whiskers span the central 90%, 5% to 95%; the central line marks the median, 50%. Box widths are proportional to the number of reports. Categories are presented in order of increasing median proportion. The dotted line marks the median proportion of compositions reported as isomers.
Fig. 3.
Fig. 3.
Summary results for the 57 most frequently reported unique glycan compositions. Box plots for A) mod-NISTmAb, B) mod-NISTmAb/NISTmAb ratio, and C) NISTmAb PS 8670. Glycan compositions in red have terminal β1,4-gal as their dominant structure. Each box represents the distribution of the central 50% of the mean of the reported replicate values for one glycan. The horizontal middle line in each box represents the consensus median. The width of each box is proportional to the square root of the number of values defining the distribution. The dashed red line in the display of the Fig. 3B denotes the expected ratio, 1.0, when a glycan result is the same in mod-NISTmAb as it is in NISTmAb. Glycans are sorted in order of increasing mod-NISTmAb/NISTmAb ratio. D) Targetplot summary of mod-NISTmAb/NISTmAb ratios relative to the consensus medians. Each dot represents one set of results. Dot diameter is proportional to number of mod-NISTmAb/NISTmAb ratios reported. The dots are color-coded by distance from the (0, 0) origin: dots within two comparability units are colored green, between two and three units are colored yellow, and greater than three units are colored red. The “Z-score Mean” axis displays the average bias estimated as the mean of the “Z-score” values of the ratios. The “Z-Score SD.” axis displays the variability of individual bias estimates, estimated as the standard deviation of the Z-scores.
Fig. 4.
Fig. 4.
Targetplot summary of mod-NISTmAb/NISTmAb ratios relative to the consensus medians. Each dot represents one set of results. Dot diameter is proportional to number of ratios reported. The “Average Bias” axis displays values estimated as the mean of the “Z-scores” of the ratios. The “Bias Variability axis displays values estimated as the standard deviation of the Z-scores. The subplots are colored by: A) analytical technique, B) analyte, C) laboratory type, and D) number of replicates.
Fig. 5.
Fig. 5.
Youden two-sample plots for the four most abundant glycan compositions in NISTmAb. Each panel displays the bivariate distribution for one composition. A) [h4n4f1], B) [h3n4f1], C) [h5n4f1], and D) [h3n3f1] (see Materials and Methods for key). The panels are centered on the univariate medians and scaled to display all values from 0 to twice the median. Values that are greater than twice the median are assigned a value of twice the median. The ellipse includes about 68% of the pairs (≈ 1 SD). The diagonal line represents the expected relationship when measurement systems have the same bias for both samples. Each symbol represents the (mod-NISTmAb, NISTmAb) pair for one data set. Symbols are coded and labeled by separation technique.
Fig. 6.
Fig. 6.
Scatterplot of the relationship between measurement repeatability, estimated as the CV, and glycan amount, estimated as the mean of the replicates. The black line represents a consensus power curve fit to all available (mean of replicates, relative standard deviation) pairs, denoted by the light gray dots: CV = 5.0 × Mean−0.35 (or SD = 0.050 × Mean0.65). The red line is the power curve fit to the pairs, denoted by the blue diamonds, reported in one data set. The measurement repeatability or this data set is somewhat better than average.
Fig. 7.
Fig. 7.
Scatterplot of the closeness to consensus of the reported values as a function of measurement repeatability estimated as CV. The symbols are coded by the user-stated nature of the reported replicates. The plot shows the data point, in blue diamond, of one data set.
Fig. 8.
Fig. 8.
Comparison Consensus Medians to Published Peak Areas22. Each symbol represents this interlaboratory study's consensus median % proportion as a function of the published peak areas for one composition or defined group of compositions. The bars span the central 50% of the distribution of reported values. The solid red circles denote compositions where the central 50% of the values does not include the published peak area. The dashed line represents equality between the two estimates.

References

    1. Yang S., Li Y., Shah P., and Zhang H. (2013) Glycomic analysis using glycoprotein immobilization for glycan extraction. Anal. Chem. 85, 5555–5561 - PMC - PubMed
    1. Vreeker G. C. M., and Wuhrer M. (2017) Reversed-phase separation methods for glycan analysis. Anal. Bioanal. Chem. 409, 359–378 - PMC - PubMed
    1. Ruhaak L. R., Zauner G., Huhn C., Bruggink C., Deelder A. M., and Wuhrer M. (2010) Glycan labeling strategies and their use in identification and quantification. Anal. Bioanal. Chem. 397, 3457–3481 - PMC - PubMed
    1. Dotz V., Haselberg R., Shubhakar A., Kozak R. P., Falck D., Rombouts Y., Reusch D., Somsen G. W., Fernandes D. L., and Wuhrer M. (2015) Mass spectrometry for glycosylation analysis of biopharmaceuticals. Trac-Trend Anal. Chem. 73, 1–9
    1. O'Flaherty R., Muniyappa M., Walsh I., Stockmann H., Hutson R., Saldova R., and Rudd P. M. (2016) High-throughput sequential glycoprofiling of six abundant glycoproteins IgG, IgA, IgM, transferrin, haptoglobin and alpha-1-antitrypsin in ovarian cancer. Glycobiology 26, 1430–1431

Publication types