. 2021 Mar;31(3):359-371.
doi: 10.1101/gr.265637.120. Epub 2021 Jan 15.

Allele-specific alternative splicing and its functional genetic variants in human tissues

Affiliations

Allele-specific alternative splicing and its functional genetic variants in human tissues

Kofi Amoah et al. Genome Res. 2021 Mar.

Abstract

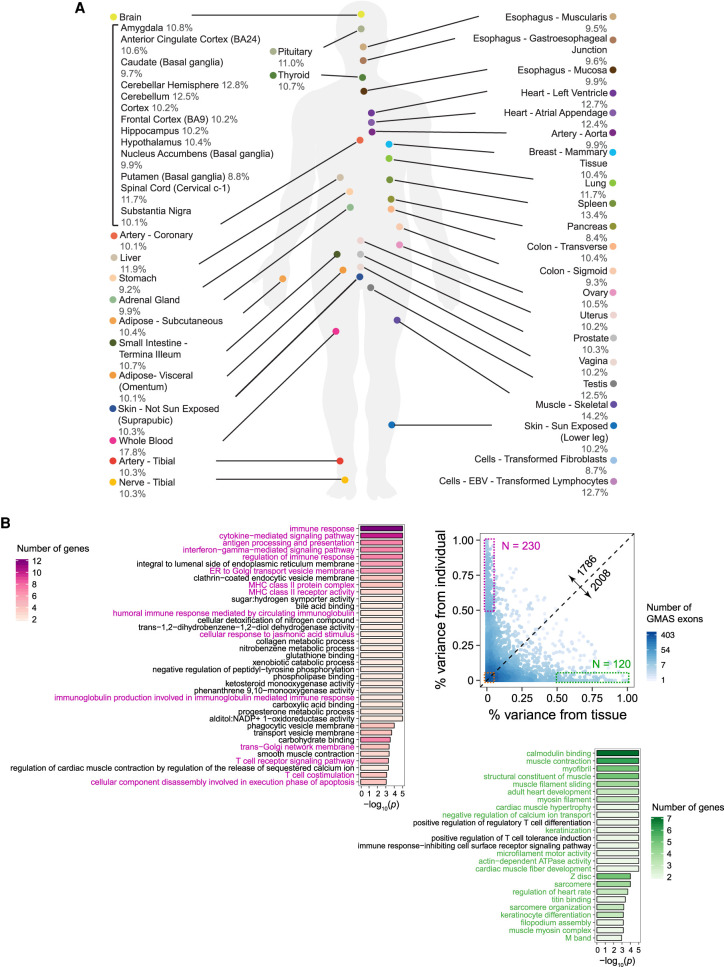
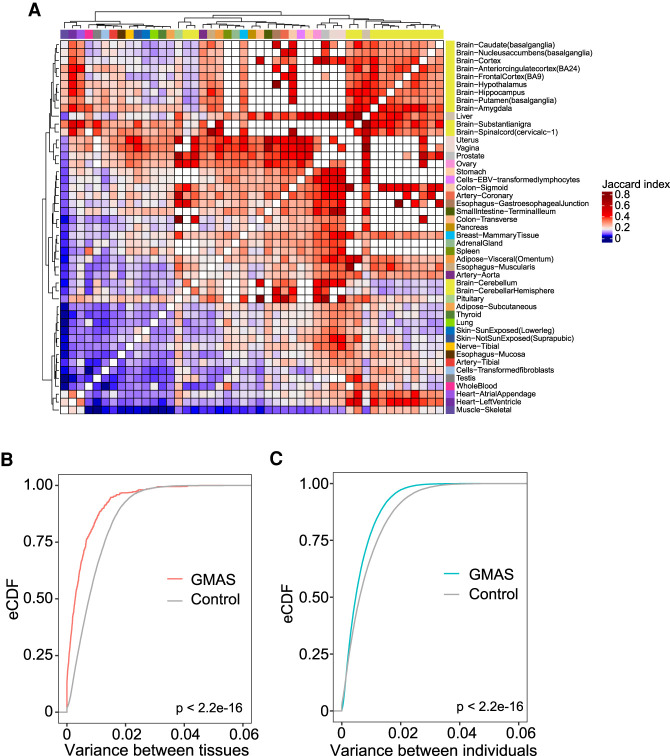
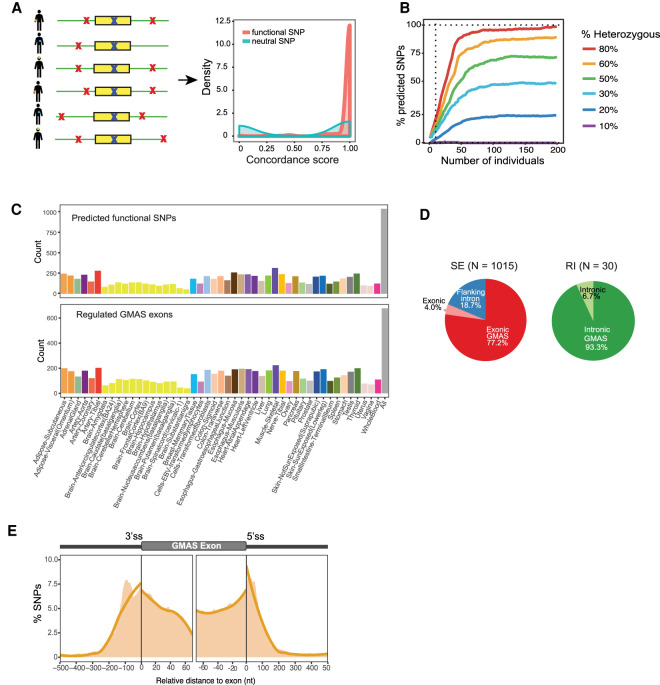
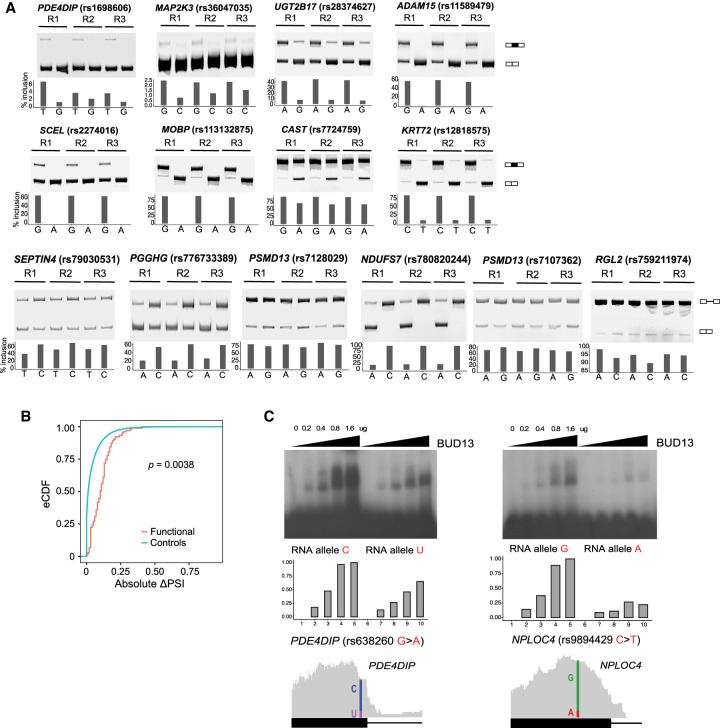
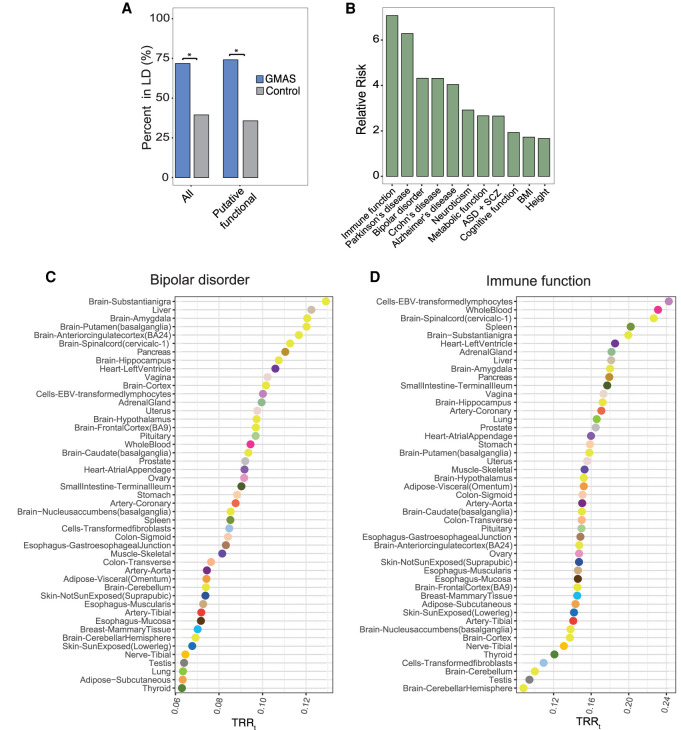
Alternative splicing is an RNA processing mechanism that affects most genes in human, contributing to disease mechanisms and phenotypic diversity. The regulation of splicing involves an intricate network of cis-regulatory elements and trans-acting factors. Due to their high sequence specificity, cis-regulation of splicing can be altered by genetic variants, significantly affecting splicing outcomes. Recently, multiple methods have been applied to understanding the regulatory effects of genetic variants on splicing. However, it is still challenging to go beyond apparent association to pinpoint functional variants. To fill in this gap, we utilized large-scale data sets of the Genotype-Tissue Expression (GTEx) project to study genetically modulated alternative splicing (GMAS) via identification of allele-specific splicing events. We demonstrate that GMAS events are shared across tissues and individuals more often than expected by chance, consistent with their genetically driven nature. Moreover, although the allelic bias of GMAS exons varies across samples, the degree of variation is similar across tissues versus individuals. Thus, genetic background drives the GMAS pattern to a similar degree as tissue-specific splicing mechanisms. Leveraging the genetically driven nature of GMAS, we developed a new method to predict functional splicing-altering variants, built upon a genotype-phenotype concordance model across samples. Complemented by experimental validations, this method predicted >1000 functional variants, many of which may alter RNA-protein interactions. Lastly, 72% of GMAS-associated SNPs were in linkage disequilibrium with GWAS-reported SNPs, and such association was enriched in tissues of relevance for specific traits/diseases. Our study enables a comprehensive view of genetically driven splicing variations in human tissues.


Figures

Figure 1.
Figure 1.
The landscape of GMAS exons in human tissues. (A) % of GMAS exons among all testable exons in each tissue (averaged across individuals). (B) The variability of GMAS patterns across tissues and individuals (Methods). Each dot represents an exon, and the colors represent the number of overlapping dots. This analysis only included GMAS exons that exist in ≥2 individuals per tissue and ≥2 tissues per individual. The numbers along the diagonal line show the number of GMAS exons above and below the line, respectively. GO terms enriched among genes in the high variability groups (boxed) are shown. Color intensity represents the number of genes associated with each significant GO term. The P-values were estimated based on 10,000 randomizations of control genes (i.e., genes hosting alternatively spliced exons that were tested for GMAS) matching gene length and GC content of the test genes (Hsiao et al. 2016a). The significant cutoff of the P-value was set to be 1/(number of total GO terms considered).
Figure 2.
Figure 2.
Comparison of GMAS patterns across tissues or individuals. (A) Heat map of the Jaccard indices of GMAS exons between each pair of tissues (Methods). White boxes correspond to tissue pairs with <10 common testable exons. (B) Empirical cumulative distribution function (eCDF) of variances across tissues in the allelic biases of tag SNPs of GMAS exons for all individuals. Controls were included for comparison purposes (Methods). The P-value was calculated using the Kolmogorov–Smirnov test. (C) Similar to B but for variance across individuals per tissue.
Figure 3.
Figure 3.
Prediction of functional SNPs for GMAS events. (A) Functional SNPs are predicted by considering candidate SNPs (red crosses) in the vicinity of a GMAS exon, including the tag SNP itself (blue crosses). Concordance among the allelic ratios of the tag SNP in all samples is calculated as described in Methods (with hypothetical distributions shown). (B) The percentage of SNPs predicted given the number of individuals in the simulated testing cohort (Methods). Different percentages of individuals with the heterozygous genotype were simulated. Vertical dotted line marks 10 individuals. (C) Top: Number of predicted functional SNPs per tissue. Bottom: Number of GMAS exons with predicted functional SNPs per tissue. The rightmost bar (All) corresponds to predictions made by pooling samples from all tissues. (D) Left pie chart: predicted functional SNPs in the exonic or intronic regions of SE (skipped exons). Exonic GMAS: the functional SNP is also the exonic GMAS tag SNP. The rest of the functional SNPs were classified into the “Exonic” or “Flanking intron” group. Right pie chart: for retained introns (RI). Intronic GMAS: the functional SNP is also the GMAS tag SNP. N refers to the number of functional SNPs for each group. No functional SNPs were predicted for alternative 5′ or 3′ ss exons. (E) Densities of predicted functional SNPs near the exon-intron boundaries of their associated GMAS exons (SEs only). The number of functional SNPs was normalized by the total number of testable SNPs at each nucleotide position. Orange curve is the fitted trend line of the shaded area that represents the SNP density at single-nucleotide resolution.
Figure 4.
Figure 4.
Experimental support of predicted functional SNPs. (A) Minigene experiments validating predicted functional SNPs for GMAS in triplicates (R1–3). The inclusion levels (% inclusion) of the skipped exons or retained introns were estimated from the band intensities of the PAGE gel. Note that, for illustration purposes, the y-axis scales are different for different genes. (B) eCDF of the absolute changes in the PSI values of GMAS exons upon KD of splicing factors associated with putative functional SNPs (based on motif analysis or eCLIP overlap). All splicing factors in Supplemental Figure S9A with ENCODE KD RNA-seq data are included here. The P-value was calculated using the Kolmogorov–Smirnov test. (C) EMSA validating allele-specific binding of BUD13 to putative functional SNPs. The amount of BUD13 protein used in the experiment is illustrated above the gel. BUD13 eCLIP reads (gray) are shown below the gel, where the locations of the SNPs are labeled with vertical colored lines. The fraction of reads supporting either allele at the functional SNP position is delineated.
Figure 5.
Figure 5.
Functional relevance of GMAS events. (A) Proportions of all GMAS SNPs and putative functional SNPs in LD with (and within 200 kb of) GWAS SNPs. Controls were random dbSNPs in genes that do not harbor GMAS SNPs. (*) P < 2.2 × 10⁻¹⁶ (Fisher's exact test). (B) Relative risk of GMAS SNPs in LD with selected trait/disease, defined as the ratio between the values in A of the GMAS and control groups for all GMAS SNPs. (ASD) Autism spectrum disorder, (SCZ) schizophrenia, (BMI) body mass index. All P-values < 2.2 × 10⁻¹⁶ (Fisher's exact test). (C,D) Trait-relevance ratio of each tissue (TRRt) defined as the proportion of GMAS SNPs identified in each tissue that were in LD with GWAS SNPs, for bipolar disorder and immune function, respectively.

Similar articles

Cited by

References

    1. Adamson SI, Zhan L, Graveley BR. 2018. Vex-seq: high-throughput identification of the impact of genetic variation on pre-mRNA splicing efficiency. Genome Biol 19: 71. 10.1186/s13059-018-1437-x - DOI - PMC - PubMed
    1. Aguirre-Gamboa R, Joosten I, Urbano PCM, van der Molen RG, van Rijssen E, van Cranenbroek B, Oosting M, Smeekens S, Jaeger M, Zorro M, et al. 2016. Differential effects of environmental and genetic factors on T and B cell immune traits. Cell Rep 17: 2474–2487. 10.1016/j.celrep.2016.10.053 - DOI - PMC - PubMed
    1. Barash Y, Calarco JA, Gao W, Pan Q, Wang X, Shai O, Blencowe BJ, Frey BJ. 2010. Deciphering the splicing code. Nature 465: 53–59. 10.1038/nature09000 - DOI - PubMed
    1. Barbosa-Morais NL, Irimia M, Pan Q, Xiong HY, Gueroussov S, Lee LJ, Slobodeniuc V, Kutter C, Watt S, Çolak R, et al. 2012. The evolutionary landscape of alternative splicing in vertebrate species. Science 338: 1587–1593. 10.1126/science.1230612 - DOI - PubMed
    1. Bretschneider H, Gandhi S, Deshwar AG, Zuberi K, Frey BJ. 2018. COSSMO: predicting competitive alternative splice site selection using deep learning. Bioinformatics 34: i429–i437. 10.1093/bioinformatics/bty244 - DOI - PMC - PubMed

Publication types