. 2021 Jan 15;6(55):eabe3702.
doi: 10.1126/sciimmunol.abe3702.

Inhibitory signaling sustains a distinct early memory CD8+ T cell precursor that is resistant to DNA damage

Affiliations

Inhibitory signaling sustains a distinct early memory CD8+ T cell precursor that is resistant to DNA damage

Jonathan B Johnnidis et al. Sci Immunol. .

Abstract

The developmental origins of memory T cells remain incompletely understood. During the expansion phase of acute viral infection, we identified a distinct subset of virus-specific CD8+ T cells that possessed distinct characteristics including expression of CD62L, T cell factor 1 (TCF-1), and Eomesodermin; relative quiescence; expression of activation markers; and features of limited effector differentiation. These cells were a quantitatively minor subpopulation of the TCF-1+ pool and exhibited self-renewal, heightened DNA damage surveillance activity, and preferential long-term recall capacity. Despite features of memory and somewhat restrained proliferation during the expansion phase, this subset displayed evidence of stronger TCR signaling than other responding CD8+ T cells, coupled with elevated expression of multiple inhibitory receptors including programmed cell death 1 (PD-1), lymphocyte activating gene 3 (LAG-3), cytotoxic T-lymphocyte-associated protein 4 (CTLA-4), CD5, and CD160. Genetic ablation of PD-1 and LAG-3 compromised the formation of this CD62Lhi TCF-1+ subset and subsequent CD8+ T cell memory. Although central memory phenotype CD8+ T cells were formed in the absence of these cells, subsequent memory CD8+ T cell recall responses were compromised. Together, these results identify an important link between genome integrity maintenance and CD8+ T cell memory. Moreover, the data indicate a role for inhibitory receptors in preserving key memory CD8+ T cell precursors during initial activation and differentiation. Identification of this rare subpopulation within the memory CD8+ T cell precursor pool may help reconcile models of the developmental origin of long-term CD8+ T cell memory.


Figures

Fig. 1.
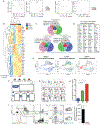
Fig. 1.. Identification and characterization of a CD62Lhi CD8+ T cell subset during the expansion phase of acute viral infection.
(A) Heterogeneity of CD62L expression in LCMV-specific P14 CD8+ T cell subsets defined by KLRG1 and IL-7Rα at d8 post-infection (pi) LCMV-Arm (spleen). Naive cells (CD44lo CD62Lhi) are depicted in grey; LCMV-specific CD62Lhi KLRG1lo IL-7Rαhi (“CD62Lhi subset”) in blue; LCMV-specific CD62Llo KLRG1lo IL-7Rαhi cells (“IL-7Rαhi subset”) in green; LCMV-specific CD62Llo KLRG1hi IL-7Rαlo cells (“KLRG1hi subset”) in red. (B) Percent of CD62Lhi CD8+ T cells (among total P14 cells) in indicated tissues at d8 pi. (C) Expression of selected differentiation markers and transcription factors for each subset of P14 cells, indicated in blue, green and red. Polyclonal naive cells shown in grey. (D) Heatmap depicting relative protein expression (row-normalized) determined by flow cytometry for indicated markers; red indicates higher expression, whereas blue indicates lower expression. (E) Expression of Granzyme B in the three P14 subsets and polyclonal naive cells. (F) Expression of cytokines after ex vivo re-stimulation with DbGP33-41 peptide in the three P14 CD8+ T cell subsets and polyclonal naive CD8+ T cells. (G-I) scRNA-seq of P14 CD8+ T cells from d7 LCMV-Arm infected mice(42). (G) UMAP projection of P14 CD8+ T cell scRNA-seq data, colored by Louvain cluster ID. (H) UMAP projection of P14 CD8+ T cell scRNA-seq data, colored by expression of representative genes. (I) Violin plots depicting expression of representative genes within clusters defined in G. See also Figs. S1, S2, and S3. Data in each panel are representative of two or more independent experiments (4-5 mice per experiment). Asterisks indicate statistical significance (p < 0.05) determined by one-way ANOVA (using Tukey’s multiple comparisons test). Error bars depict mean ± SEM. Error bars depict mean ± SEM.
Fig. 2.
Fig. 2.. Transcriptional signatures and functional properties of the CD62Lhi subset of virus-specific expansion phase CD8+ T cells.
(A) PCA of normalized RNAseq profiles, including naive CD8+ T cells (left) of sorted CD62Lhi, IL-7Rαhi and only expansion phaseKLRG1hi P14 CD8+ T cells (right) from d8 LCMV-Arm infection. Each dot represents an independent experiment. (B) Heatmap showing gene expression. Genes and samples were ordered by hierarchical clustering. Each column represents an independent experiment. (C) Venn diagram displaying overlaps between DEGs from indicated pairwise comparisons. Gene expression signatures for each subset are shown: CD62Lhi (blue), IL-7Rαhi (green), and KLRG1hi (red). (D) List of core genes in the CD62Lhi transcriptional signature. (E) UMAP projection of scRNAseq of P14 CD8+ T cells from d7 LCMV-Arm infected mice(42), for CD62Lhi (blue), IL-7Rαhi (green), and KLRG1hi (red) transcriptional signatures. (F) Cell division profile of LCMV-specific CD8+ T cell subsets. Mice containing naive, CTV-labeled P14 cells were infected with LCMV-Arm. CTV dilution was examined at d8 pi in the total splenic P14 population (large, upper panel) and the CD62Lhi (lower left, blue), IL-7Rαhi (lower middle, green), and KLRG1hi (lower right, red) subsets (n = 4 per group). (G) Proliferation analyzed at d8 in the three LCMV-specific CD8+ T cell subsets and in naive CD8+ T cells: BrdU incorporation (top), Ki-67 expression (middle), and cell cycle reporter Fucci-mAG expression (bottom). (H) Abundance of cells in each of the three LCMV-specific subsets at d8 pi in the spleen. (I) Expression of TCF-1 at d8 pi LCMV-Arm, depicted as histograms and as bivariate plots versus expression of CD62L. (J) Impact of conditional genetic knockout (cKO) of Tcf7 on the abundance of the CD62Lhi subset. The CD62Lhi subset was identified in WT and cKO cells using the gating scheme previously established (left and middle). All WT P14 cells are shown. Because Tcf7 deletion is not 100% efficient using this Cd4cre approach, cKO P14 cells were first gated on cells that did not stain for TCF-1 protein (~88% of all P14 cells derived from the cKO donor). Bar plot shows absolute count of CD62Lhi subset in the spleen (right). Data in each panel are representative of two or more independent experiments (3-5 mice per experiment). Asterisks indicate statistical significance (p < 0.05) determined by paired Student’s t test. Error bars depict mean ± SEM. See also Fig. S5.
Fig. 3.
Fig. 3.. Genome surveillance and maintenance in virus-specific expansion phase CD8+ T cell subsets.
(A) Alkaline comet assay identifies DNA damage in the indicated subsets of CD8+ T cells isolated at d8 post LCMV-Arm infection. (B) Basal phosphorylation of H2AX (γH2AX) measured directly ex vivo in the indicated LCMV-specific CD8+ T cell subsets at d8 pi LCMV-Arm or naive CD8+ T cells. (C) Histograms (left) depict the extent of basal (black lines) and irradiation-induced (red lines) γH2AX. Bar graph depicts the difference between the basal and irradiation-induced γH2AX values. (D) Telomerase activity assessed by qTRAP assay (see methods) for the indicated LCMV-specific CD8+ T cell subsets at d8 pi LCMV-Arm or naive CD8+ T cells measured directly ex vivo. (E) Experimental design for in vivo doxorubicin (dxr) treatment (top). The frequency of donor P14 cells (CD45.1+) as a function of dxr dose at d8 pi LCMV-Arm (bottom). (F) Fold change enrichment or reduction in abundance (top) and frequency (bottom) of each of the three LCMV-specific CD8+ T cell subsets out of total P14 cells at d8 pi with LCMV-Arm in mice treated with dxr (8 mg/kg or 16 mg/kg) versus PBS. Data in panel A are from an experiment using 4 mice. Data in panels B-F are representative of two or more independent experiments (1-5 mice per experiment). Asterisks indicate statistical significance (p < 0.05) determined by one-way ANOVA (using Tukey’s multiple comparisons test). Error bars depict mean ± SEM.
Fig. 4.
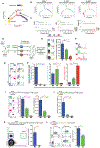
Fig. 4.. Self-renewal and lineage relationships of expansion phase virus-specific CD8+ T cell subsets and contributions to CD8+ T cell memory.
(A) Pseudotime analysis of scRNAseq of P14 CD8+ T cells from d7 post LCMV-Arm infection (42), using Monocle-2. (B) Pseudotime trajectory, colored by expression of CD62Lhi (blue), IL-7Rαhi (green) and KLRG1hi (red) transcriptional signatures. (C) Expression of CD62Lhi (blue), IL-7Rαhi (green) and KLRG1hi (red) transcriptional signatures, and Tcf7, Il7r and Havcr2 (black lines) plotted over pseudotime. (D) Schematic of experimental design. (E) Representative flow cytometric plots from recipient mice (left) and quantification of absolute number of recovered donor P14 cells for the indicated subsets (right). (F) CTV dilution in donor-derived, LCMV-specific CD8+ T cell subsets from E, relative to a control, co-transferred population of unrelated OT-I cells (light grey). (G) Expression of IL-7Rα and CD62L from P14 donor cells (left) and cells recovered after adoptive transfer (right) of the indicated populations. (H) Summary of phenotypes of P14 cells recovered after adoptive transfer as outlined in part D. (I) Recall capacity of the CD62Lhi and IL-7Rαhi subsets. P14 subsets were sorted at d8 pi and adoptively transferred to congenically disparate naive recipient mice. One month later recipient mice were challenged with LCMV clone 13. Bar plots showing the number of donor P14 cell was assessed in spleens on d7 pi. (J) CD62Lhi, IL-7Rαhi and KLRG1hi P14 subsets were sorted at d8 pi LCMV and equal numbers transferred into congenically disparate naive recipient mice followed by infection with LCMV clone 13. Bar plots showing the frequency of the abundance of donor cells evaluated in PBMC at day 23 pi. (K) CD62Lhi and IL-7Rαhi P14 subsets were sorted at d8 pi LCMV from congenically disparate donor mice and equal numbers were co-transferred into naive recipient mice and challenged with LCMV clone 13. Bar plot shows abundance of donor cells in spleens at day 9 pi. (L) P14 subsets were sorted at d8 pi and transferred into congenically disparate naive recipient mice. Bar plot shows the frequency of CD62Lhi memory donor P14 cells in recipient spleens after 6 months. Data are representative of two or more independent experiments (n= 4-5 mice per group). Asterisks indicate statistical significance (p < 0.05) determined by one-way ANOVA (using Tukey’s multiple comparisons test) (E, H, I, J) or unpaired Student’s t test (K, L). Error bars depict mean ± SEM. See also Fig. S6.
Fig. 5.
Fig. 5.. Anatomical localization, signaling, and requirement of inhibitory receptor signaling for optimal generation of the CD62Lhi subset.
(A) Accessibility to the splenic blood compartment (i.e. red pulp) for the three LCMV-specific CD8+ T cell subsets and polyclonal naive CD8+ T cells assessed by i.v. antibody staining at d8 pi with LCMV-Arm. (B-C) Expression of CD69 (B) and CXCR5 (C) at d8 pi by the three LCMV-specific subsets and polyclonal naive CD8+ T cells. (D) Expression of Nur77 at d8 pi with LCMV-Arm. (E) Expression of PD-1, LAG-3, and CTLA-4 at d8 pi LCMV. (F) Heatmap (row-normalized) depicting relative expression of signaling factors at d8 pi with LCMV-Arm; red indicates higher expression, and blue indicates lower expression. (G-L) The effect of combined genetic deletion of PD-1 and LAG-3 on generation of the CD62Lhi subset and CD8+ T cell memory development. (G and J) Experimental design. (H) Abundance of WT and dKO P14 cells in PBMC at d8 pi with LCMV-Arm (left bar graph) and frequency of the IL-7Rαhi and CD62Lhi subsets (center flow cytometry plots and right bar graph). (I) Abundance of WT and dKO P14 cells in PBMC at d30 pi with LCMV-Arm (left bar graph) and abundance of the IL-7Rαhi and CD62Lhi subsets (center flow cytometry plots and right bar graph). (K) Abundance of WT and dKO P14 cells in PBMC at d8 post-secondary LCMV-Arm infection (left bar graph) and abundance of the CD62Lhi subset (center concatenated flow cytometry plots and right bar graph summarizing individual mice). (L) Abundance of WT and dKO P14 cells in PBMC at d8 post tertiary LCMV-Arm infection (left bar graph) and abundance of the CD62Lhi subset (center concatenated flow cytometry plots and right bar graph summarizing individual mice). Data in panel A are from an experiment comprising 5 mice. Data in panels B-E are representative of two or more independent experiments (4-10 mice per experiment). Data in panels H-I are representative of two or more independent experiments (5 mice per experiment). Data in panel K are representative of two independent experiments (5-10 mice per experiment). Data in panel L are from one experiment (20 mice per experiment). Asterisks indicate statistical significance (p < 0.05) determined by one-way ANOVA (using Tukey’s multiple comparisons test) (A-E) or unpaired Student’s t test (H, I, K, L). Error bars depict mean ± SEM.

References

    1. Kaech SM, Cui W, Transcriptional control of effector and memory CD8+ T cell differentiation. Nat Rev Immunol 12, 749–761 (2012). - PMC - PubMed
    1. Chang JT, Wherry EJ, Goldrath AW, Molecular regulation of effector and memory T cell differentiation. Nat Immunol 15, 1104–1115 (2014). - PMC - PubMed
    1. Jacob J, Baltimore D, Modelling T-cell memory by genetic marking of memory T cells in vivo. Nature 399, 593–597. (1999). - PubMed
    1. Opferman JT, Ober BT, Ashton-Rickardt PG, Linear differentiation of cytotoxic effectors into memory T lymphocytes. Science 283, 1745–1748 (1999). - PubMed
    1. Kaech SM, Tan JT, Wherry EJ, Konieczny BT, Surh CD, Ahmed R, Selective expression of the interleukin 7 receptor identifies effector CD8 T cells that give rise to long-lived memory cells. Nat Immunol 4, 1191–1198 (2003). - PubMed

Publication types

MeSH terms

Substances