. 2021 Jan 19;118(3):e2011342118.
doi: 10.1073/pnas.2011342118.

The harsh microenvironment in early breast cancer selects for a Warburg phenotype

Affiliations

The harsh microenvironment in early breast cancer selects for a Warburg phenotype

Mehdi Damaghi et al. Proc Natl Acad Sci U S A. .

Abstract

The harsh microenvironment of ductal carcinoma in situ (DCIS) exerts strong evolutionary selection pressures on cancer cells. We hypothesize that the poor metabolic conditions near the ductal center foment the emergence of a Warburg Effect (WE) phenotype, wherein cells rapidly ferment glucose to lactic acid, even in normoxia. To test this hypothesis, we subjected low-glycolytic breast cancer cells to different microenvironmental selection pressures using combinations of hypoxia, acidosis, low glucose, and starvation for many months and isolated single clones for metabolic and transcriptomic profiling. The two harshest conditions selected for constitutively expressed WE phenotypes. RNA sequencing analysis of WE clones identified the transcription factor KLF4 as potential inducer of the WE phenotype. In stained DCIS samples, KLF4 expression was enriched in the area with the harshest microenvironmental conditions. We simulated in vivo DCIS phenotypic evolution using a mathematical model calibrated from the in vitro results. The WE phenotype emerged in the poor metabolic conditions near the necrotic core. We propose that harsh microenvironments within DCIS select for a WE phenotype through constitutive transcriptional reprogramming, thus conferring a survival advantage and facilitating further growth and invasion.

Keywords: DCIS; Warburg Effect; adaptation; clonal selection; tumor evolution.


Conflict of interest statement

The authors declare no competing interest.

Figures
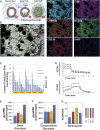
Fig. 1.
Fig. 1.
Early DCIS conditions can select for glycolytic phenotype. (A) Schematic of early and late DCIS progression. (B) Multiplex IHC staining of DCIS patient sample with markers of glycolysis (Glut1 [green]), acid adaptation (LAMP2b [orange]), hypoxia (CA9 [purple]), lactate production (MCT4 [cyan]), vasculature marked (CD138 [red]), and nuclei (DAPI [blue]). (C) Lactate production rate of clones grown out from cells selected under conditions of being selected through multiple rounds of the following conditions: unfed for 1 mo (UF); low glucose (G); low glucose, oxygen, and pH (GOP); low oxygen and pH (OP); and growth in rich media (Control). (D) Seahorse glycolytic rate assay to measure ECAR and OCR following addition of glucose. Basal glycolysis was higher in UF cells (E), but compensatory glycolysis showed no difference between control clones and overall UF clones (F). (G) UF clones have higher WE phenotype (expressed as ECAR/OCR ratio) than control.
Fig. 2.
Fig. 2.
RNA sequencing analysis of selected clones reveals the molecular mechanism of switch to WE phenotype. (A) Heatmap showing the top 500 most variable genes, grouped by selection condition. A preliminary analysis of RNA-seq data was performed by linearly regressing gene expression data with lactate production rate and filtered for significantly correlated or anti-correlated genes. Unsupervised clustering (SI Appendix, Fig. S3) of these data showed that the 1,000 most highly correlated and anticorrelated genes clustered within selection condition. (B) Principal component analysis of gene expression data showed separation of the UF and GOP groups compared to control. (C) Phenotype evolution trajectory alignment of single-clone RNA-seq for evolving breast cancer cell populations. Cell fate analysis with Palantir was applied to the single-clone RNA-seq dataset to determine differentiation potential from an initial, unselected, parental lineage to selected, phenotypic terminal states of G, OP, and UF. UMAP projections were used to visualize the high-dimensional dataset and known identity of each clones was colored on the UMAP projections. Unselected clones were indicated in red, UF clones were indicated in purple, G clones were indicated in green, OP clones were indicated in mint, and GOP clones were indicated in blue.
Fig. 3.
Fig. 3.
Computational modeling of the emergence of the WE phenotype. (AD) A previously published two-dimensional hybrid discrete-continuum homeostatic cancer metabolism model (42, 43) shows the evolution of acid resistance (blue to green) and WE (blue to pink) phenotypes over time. The model simulates growth into ductal structure (A) where increased acidity in the center of the duct promotes acid resistance phenotypes (blue). After depletion of glucose, the WE phenotype emerges in harsh conditions near the center of the duct, on the edge of the necrotic core. (B) A Muller plot shows phenotypic selection and lineage over time. Vertical axis indicates size of clones, colored by its acid-resistance/WE phenotype shown in C. Final distributions of oxygen, glucose, and acid are shown in D. (EI) An in vitro version of the model simulated for identical conditions as Fig. 2A confirms that WE phenotype (E) emerges in harsh conditions (“unfed”). Furthermore, these cells have enhanced efficiency in producing ATP from nutrients (F). Model simulated barcode proportions are shown for three timepoints: 0 d (G), 60 d (H), and 120 d (I). Barcodes are colored by average final phenotype with dead clones colored in black. Control and glucose-depleted conditions have low turnover, leading to slowed evolution. OP and UF conditions have increased turnover, selecting for WE phenotypes. Parameters are as follows (Eq. 1): S = 0.08, ko = 0.005, kg = 0.3, kg0 = 2.5, and V0 = 0.93.
Fig. 4.
Fig. 4.
Clinical validation of KLF4 expression in breast cancer patients’ samples. (A) Enrichment analysis of 388 genes positively associated with LPR using oPOSSUM revealed KLF4 as the top regulator of LPR genes. (B and C) ICC analysis of UF and parental MCF7 and DCIS validates the higher expression and nuclear localization of KLF4 in UF cells. (D) Harsh condition in DCIS selects for aggressive cells that can invade other organs. One million of MCF7 parental, UF9, and UF18 clones were injected to tail vein of NSG mice and looked for possible metastasis. The figure shows the metastasis in the lung of the UF group. (E) There was only one metastasis in the control group of 12 mice compared to 100% metastasis in both UF cells. (F) TMA analysis of 204 breast biopsies of Moffitt Cancer Center patients for KLF4 expression shows higher expression of this protein in DCIS compared to adjacent normal tissues. The expression of KLF4 stays high with higher grade of breast cancer. (G) Representative images of the TMA analysis done in A. The box is zoomed in the center of the duct to show spatial correlation of KLF4 in DCIS samples. Cells with high KLF4 expression are located to the center of the duct in DCIS samples that proves our hypotheses that harsh condition selects the cells with glycolytic phenotype through a transcriptional factor switch.

References

    1. Gatenby R. A., Gillies R. J., Why do cancers have high aerobic glycolysis? Nat. Rev. Cancer 4, 891–899 (2004). - PubMed
    1. Bertout J. A., Patel S. A., Simon M. C., The impact of O2 availability on human cancer. Nat. Rev. Cancer 8, 967–975 (2008). - PMC - PubMed
    1. Thomlinson R. H., Gray L. H., The histological structure of some human lung cancers and the possible implications for radiotherapy. Br. J. Cancer 9, 539–549 (1955). - PMC - PubMed
    1. Damaghi M., et al. , Chronic acidosis in the tumour microenvironment selects for overexpression of LAMP2 in the plasma membrane. Nat. Commun. 6, 8752 (2015). - PMC - PubMed
    1. Rohani N., et al. , Acidification of tumor at stromal boundaries drives transcriptome alterations associated with aggressive phenotypes. Cancer Res. 79, 1952–1966 (2019). - PMC - PubMed

Publication types

MeSH terms

Substances

LinkOut - more resources