. 2021 Jan 19;118(3):e2015803118.
doi: 10.1073/pnas.2015803118.

Systematic analysis of differential rhythmic liver gene expression mediated by the circadian clock and feeding rhythms

Affiliations

Systematic analysis of differential rhythmic liver gene expression mediated by the circadian clock and feeding rhythms

Benjamin D Weger et al. Proc Natl Acad Sci U S A. .

Abstract

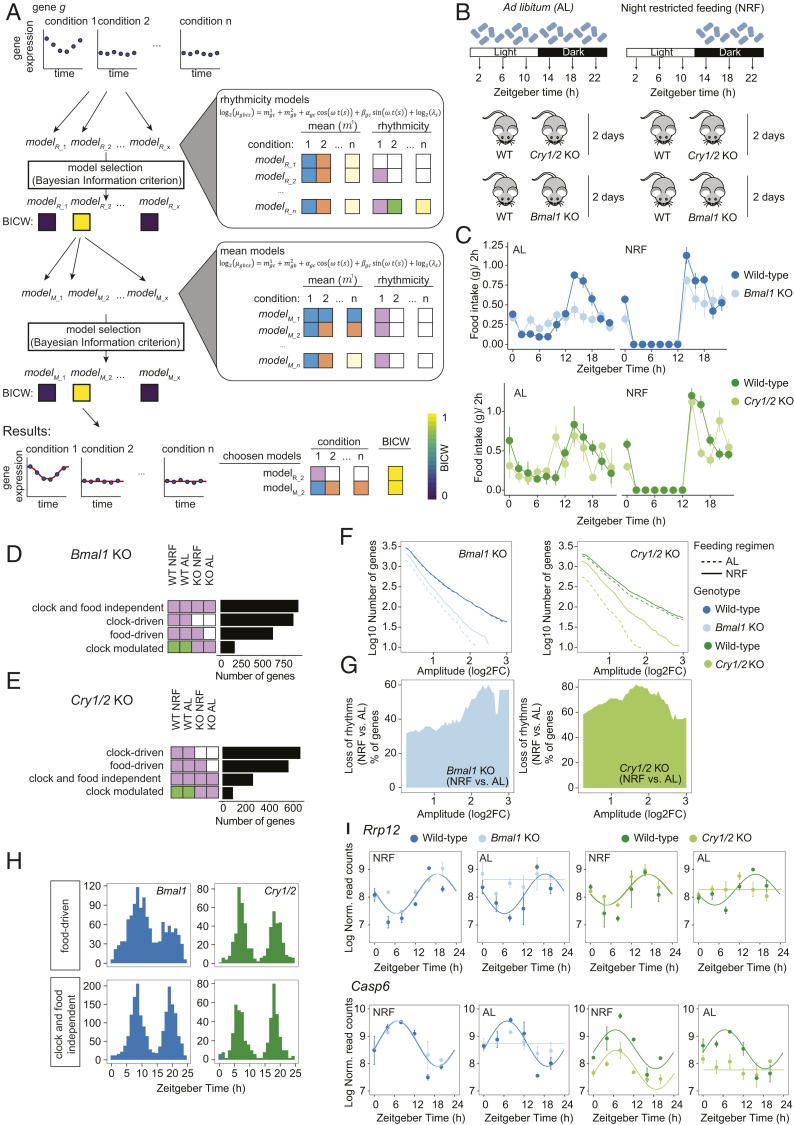
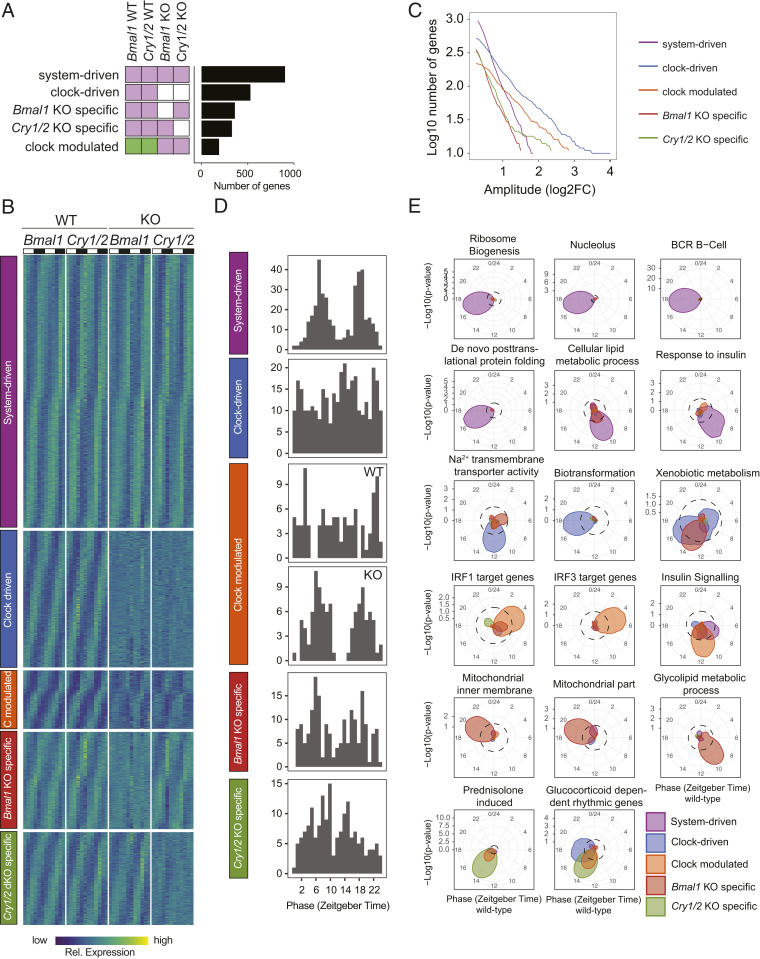
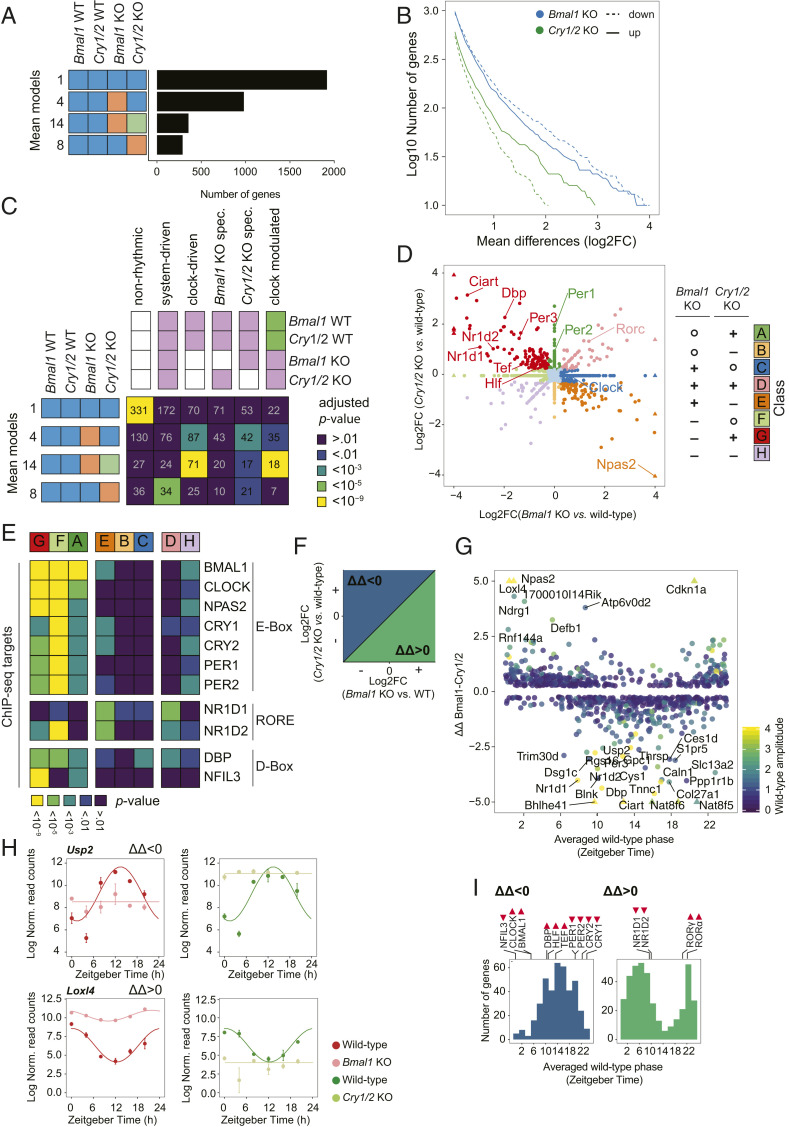
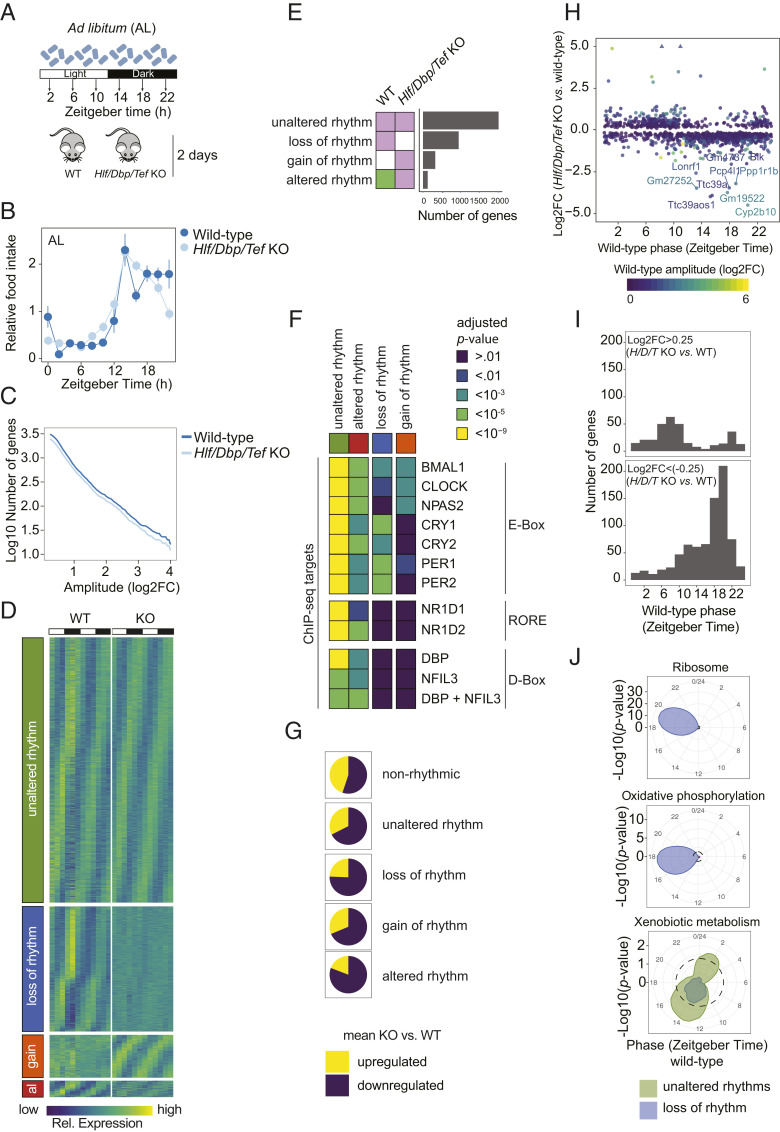
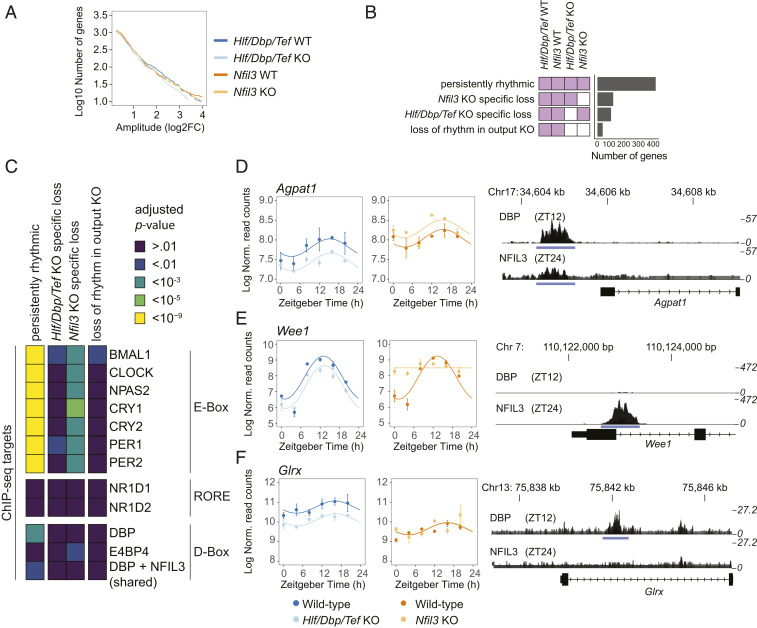
The circadian clock and feeding rhythms are both important regulators of rhythmic gene expression in the liver. To further dissect the respective contributions of feeding and the clock, we analyzed differential rhythmicity of liver tissue samples across several conditions. We developed a statistical method tailored to compare rhythmic liver messenger RNA (mRNA) expression in mouse knockout models of multiple clock genes, as well as PARbZip output transcription factors (Hlf/Dbp/Tef). Mice were exposed to ad libitum or night-restricted feeding under regular light-dark cycles. During ad libitum feeding, genetic ablation of the core clock attenuated rhythmic-feeding patterns, which could be restored by the night-restricted feeding regimen. High-amplitude mRNA expression rhythms in wild-type livers were driven by the circadian clock, but rhythmic feeding also contributed to rhythmic gene expression, albeit with significantly lower amplitudes. We observed that Bmal1 and Cry1/2 knockouts differed in their residual rhythmic gene expression. Differences in mean expression levels between wild types and knockouts correlated with rhythmic gene expression in wild type. Surprisingly, in PARbZip knockout mice, the mean expression levels of PARbZip targets were more strongly impacted than their rhythms, potentially due to the rhythmic activity of the D-box-repressor NFIL3. Genes that lost rhythmicity in PARbZip knockouts were identified to be indirect targets. Our findings provide insights into the diurnal transcriptome in mouse liver as we identified the differential contributions of several core clock regulators. In addition, we gained more insights on the specific effects of the feeding-fasting cycle.

Keywords: circadian clock; differential rhythmicity analysis; feeding–fasting cycle; liver metabolism; transcriptomics.


Conflict of interest statement

Competing interest statement: B.D.W., C.G., F.A., E.M, A.C., and F.G. were employees of Société des Produits Nestlé SA.

Figures

Fig. 1.
Fig. 1.
Regulation of liver rhythmic gene expression by the circadian clock and feeding rhythms analyzed with dryR. (A) Schematic illustrating the workflow of the statistical framework used in dryR. BICW is color-coded as indicated in the ramp (Lower Right). The same color for the remaining boxes indicates shared mean levels and rhythmic parameters between the indicated conditions for mean and rhythmic models, respectively. (B) Experimental design. (C) Rhythmic feeding in WT, Bmal1 KO, and Cry1/2 KO mice under AL and NRF. The Zeitgebertime (ZT) defines the timing of entrainment by light (ZT0 lights on; ZT12: lights off). (D and E) Number of genes classified in rhythmic models in Bmal1 KO (D) and Cry1/2 KO (E). White indicates no rhythm detected, and the same color indicates shared rhythmic parameters (amplitudes and phase) between the indicated conditions. (F) Cumulative number of rhythmic genes in the liver of WT, Bmal1 KO, and Cry1/2 KO in function of minimal amplitude. NRF partially restores rhythmicity in KOs. (G) Relative number of genes that lose rhythmicity under the AL compared with NRF regimen in KO in function of minimal amplitude. (H) Phase distribution of rhythmic genes classified as food-driven and clock- and food-independent. (I) Temporal expression pattern of Rrp12 and Casp6.
Fig. 2.
Fig. 2.
Systemic cues and the circadian clock equally shape rhythmic liver gene expression. (A) Number of genes classified in rhythmic models in Bmal1 KO and Cry1/2 KO under NRF. White indicates no rhythm detected, and the same color indicates shared rhythmic parameters (amplitudes and phase) between samples. (B) Heat maps of normalized rhythmic mRNA levels in the liver of WT, Bmal1 KO, and Cry1/2 KO mice. Genes were classified as system-driven, clock-driven, Bmal1 KO-specific, Cry1/2 KO-specific, and clock-modulated. (C) Cumulative number of genes classified in the indicated rhythmic model in function of minimal amplitude. (D) Phase distribution of indicated models. (E) Examples of functional enrichment around the clock. Enrichment of the indicated functional terms is represented by the radial coordinate at the indicated time point. P values were calculated by comparing the genes within a sliding window of 4 h with all expressed genes.
Fig. 3.
Fig. 3.
Differential mean expression between KOs of the positive and negative limb can predict rhythmic parameters of gene expression. (A) Number of genes classified in mean models under NRF in Bmal1 KO and Cry1/2 KO. The same color indicates shared mean expression levels between samples. (B) Cumulative number of genes that are up-regulated and down-regulated in mean expression with a log2 fold-change larger than the value on the x axis between the indicated KO and WT. (C) Number of genes corresponding to the indicated mean and rhythm model. Genes that show constant mean expression levels in both KO models are more likely to display no rhythmicity. Genes with differences in mean levels in Bmal1 KO or Cry1/2 KO are more likely to also be rhythmically expressed. (D) Scatterplot of log2 fold-changes in mean levels in Bmal1 KO vs. Cry1/2 KO. The color represents classes that group genes according to their differential expression pattern in the two KOs (+, up-regulation; −, down-regulation; o, not differentially expressed). (E) Enrichment analysis of clock gene targets for differentially expressed genes in the indicated class. (F) Schematic of log2 fold-changes in mean levels in Bmal1 KO/WT vs. Cry1/2 KO/WT to indicate the meaning of a positive or negative ΔΔBmal1/Cry1/2 (ΔΔ). (G) Scatterplot of phase in WT mice in function of the difference of log2 fold-changes in mean levels of Bmal1 KO vs. WT and log2 fold-changes in mean levels of Cry1/2 KO vs. WT (ΔΔBmal1/Cry1/2). (H) Example of rhythmic genes expression patterns with differing mean levels. (I) Phase histogram of genes with a positive or negative ΔΔBmal1/Cry1/2. Time of peak (▲) or trough (▼) of clock protein levels in liver nuclei (43) are indicated as triangles above the histograms.
Fig. 4.
Fig. 4.
PARbZip target genes have reduced expression in KO animals but maintain rhythmicity. (A) Experimental design. (B) Rhythmic-feeding patterns in WT and Hlf/Dbp/Tef KO mice under an AL feeding regimen. (C) Cumulative number of genes classified in the indicated rhythmic model in function of minimal amplitude. (D) Heat maps of normalized rhythmic mRNA levels in the liver of WT and Hlf/Dbp/Tef KO mice. Genes were classified according to their temporal expression pattern in Hlf/Dbp/Tef KO compared with WT mice: unaltered rhythm, loss of rhythm, gain of rhythm (gain), and altered rhythm (al). (E) Number of genes classified in models according to their hepatic temporal gene expression pattern in Hlf/Dbp/Tef KO and WT mice. White indicates no rhythm detected, and the same color indicates shared rhythmic parameters (i.e., amplitudes and phase) between the indicated conditions. (F) Enrichment analysis of clock gene targets for differentially expressed genes in the indicated class (for details, see D). (G) Ratio of mean differential gene expression in the liver of the indicated rhythm model. (H) Scatterplot of phase in WT mice in function of log2 fold-changes in mean levels in Hlf/Dbp/Tef KO vs. WT mice. (I) Phase distribution of genes that are up-regulated (Top) or down-regulated (Bottom) in their mean expression in Hlf/Dbp/Tef KO compared with WT mice. (J) Enrichment of the indicated functional terms is represented by the radial coordinate at the indicated time point. P values were calculated by comparing the genes within a sliding window of 4 h with all expressed genes.
Fig. 5.
Fig. 5.
Comparative analysis of differential liver expression in Hlf/Tef/Dbp KO and Nfil3 KO mice. (A) Cumulative number of rhythmic genes with amplitudes larger than the value on the x axis in the indicated genotype. (B) Number of genes classified in models according to their liver gene expression profile in Hlf/Dbp/Tef WT, Nfil3 WT, Hlf/Dbp/Tef KO, and Nifl3 KO mice. White indicates no rhythm detected, and the same color indicates shared rhythmic parameters (i.e., amplitudes and phase) between indicated conditions. (C) Enrichment analysis of core clock targets for genes classified into the indicated rhythmic model. Target genes have been identified using published ChIP-Seq data in mouse liver (see SI Appendix, SI Materials and Methods for details). (DF) Gene expression over time (Left) and ChIP-Seq profiles of DBP and NFIL3 at the promotor region of Agpat1 (D), Wee1 (E), and Glrx (F) (Right) in mouse liver. ChIP-Seq profiles are derived from published datasets in mouse liver (9).

References

    1. Atger F., Mauvoisin D., Weger B., Gobet C., Gachon F., Regulation of mammalian physiology by interconnected circadian and feeding rhythms. Front. Endocrinol. (Lausanne) 8, 42 (2017). - PMC - PubMed
    1. Rijo-Ferreira F., Takahashi J. S., Genomics of circadian rhythms in health and disease. Genome Med. 11, 82 (2019). - PMC - PubMed
    1. Astiz M., Heyde I., Oster H., Mechanisms of communication in the mammalian circadian timing system. Int. J. Mol. Sci. 20, 343 (2019). - PMC - PubMed
    1. Schibler U., et al. , Clock-talk: Interactions between central and peripheral circadian oscillators in mammals. Cold Spring Harb. Symp. Quant. Biol. 80, 223–232 (2015). - PubMed
    1. Takahashi J. S., Transcriptional architecture of the mammalian circadian clock. Nat. Rev. Genet. 18, 164–179 (2017). - PMC - PubMed

Publication types

MeSH terms