. 2021 Jan;9(1):e001136.
doi: 10.1136/jitc-2020-001136.

CXCL13 shapes immunoactive tumor microenvironment and enhances the efficacy of PD-1 checkpoint blockade in high-grade serous ovarian cancer

Affiliations

CXCL13 shapes immunoactive tumor microenvironment and enhances the efficacy of PD-1 checkpoint blockade in high-grade serous ovarian cancer

Moran Yang et al. J Immunother Cancer. 2021 Jan.

Abstract

Background: Most patients with high-grade serous ovarian cancer (HGSC) lack an effective response to immune checkpoint blockade, highlighting the need for more knowledge about what is required for successful treatment. As follicular cytotoxic CXCR5+CD8+ T cells are maintained by reinvigoration by immune checkpoint blockade in tumors, we attempted to reveal the relationship between CXCR5+CD8+ T cells and the tumor microenvironment to predict immunotherapy responses in HGSC.

Methods: 264 patients with HGSC from two cohorts and 340 HGSC cases from The Cancer Genome Atlas cohort were enrolled. Ex vivo and in vivo studies were conducted with human HGSC tumors and murine tumor models. The spatial correlation between CXC-chemokine ligand 13 (CXCL13), CXCR5, CD8, and CD20 was evaluated by immunohistochemistry and immunofluorescence. Survival was compared between different subsets of patients using Kaplan-Meier analysis. The therapeutic effect of CXCL13 and programmed cell death-1 (PD-1) blockade was validated using human HGSC tumors and murine models.

Results: High CXCL13 expression was associated with prolonged survival. Tumors with high CXCL13 expression exhibited increased infiltration of activated and CXCR5-expressing CD8+ T cells. Incubation with CXCL13 facilitated expansion and activation of CXCR5+CD8+ T cells ex vivo. CXCR5+CD8+ T cells appeared in closer proximity to CXCL13 in tumors and chemotaxis towards CXCL13 in vitro. The combination of CXCL13, CXCR5, and CD8+ T cells was an independent predictor for survival. In addition, CXCL13 was associated with clusters of CD20+ B cells. CD20+ B cells predicted better patient survival in the presence of CXCL13. Histological evaluation highlighted colocalization of CXCL13 with tertiary lymphoid structures (TLSs). TLSs carried prognostic benefit only in the presence of CXCL13. CXCL13 in combination with anti-PD-1 therapy retarded tumor growth in a CD8+ T-cell-dependent manner, resulting in increased infiltration of cytotoxic CD8+ T cells and CXCR5+CD8+ T cells.

Conclusions: These data define a critical role of CXCL13 in shaping antitumor microenvironment by facilitating the maintenance of CXCR5+CD8+ T cells in TLSs and support a clinical investigation for a combination of CXCL13 and PD-1 blockade therapy in HGSC.

Keywords: biomarkers; cytokines; tumor; tumor microenvironment.


Conflict of interest statement

Competing interests: None declared.

Figures
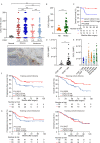
Figure 1
Figure 1
CXCL13 is associated with improved survival in patients with HGSC. (A) H score of CXCL13 expression in normal ovarian tissue and stroma, and intratumor of HGSC tissues (n=185). Bar=100 µm. Results are expressed as mean±SD. (B) Concentration of CXCL13 of peripheral blood was compared between healthy donors (n=16) and patients with HGSC (n=46; Mann-Whitney U test). (C) Kaplan-Meier survival curves for OS of patients with HGSC according to serum CXCL13 concentration (n=26; Gehan-Breslow-Wilcoxon test and p values are shown). (D) CXCL13 expression of CD45 or CD45+ cells was analyzed in HGSC tissues (n=36; Mann-Whitney U test). (E) The mean fluorescence intensity of CXCL13 on different subgroups of lymphocytes (n=20; one-way ANOVA with Bonferroni post hoc test; B cells: CD20+, DC: CD11b+CD11c+, monocytes: CD11b+C11c, and macrophages: CD68+). (F, G) Kaplan-Meier survival curves for PFS and OS of patients with HGSC from the training cohort according to stroma or intratumor CXCL13 expression (n=185; log-rank test and p values are shown). *p<0.05; **p<0.01; ***p<0.001; ns, no significant difference. ANOVA, analysis of variance; CXCL13, CXC-chemokine ligand 13; HD, healthy donors; DC, dendritic cells; HGSC, high-grade serous ovarian cancer; IHC, immunohistochemistry; OS, overall survival; PFS, progression-free survival.
Figure 2
Figure 2
CXCL13 associates with antitumor immune microenvironment. (A) Difference in CD8+ T-cell numbers per 105 cells in HGSC tissues between CXCL13 low group and CXCL13 high group (n=36). (B) Difference in effector cytokines (CD69, IFN-γ, GzmB, and PRF1), proliferation (Ki-67), and immune checkpoint molecule (PD-1, Tim-3, CTLA-4, LAG-3) expression on CD8+ T cells in HGSC tissues between CXCL13 low group and CXCL13 high group (n=36). (C) Pearson’s correlation of messenger RNA expression for CXCL13 with CD8A, LCK, IFNG, GZMB, GZMK, and PRF1 from TCGA. (D) Correlation analysis of CXCR5+CD8+ T-cell percentage with CXCL13+ cell percentage (upper) and CXCL13+CD45+ cell percentage (lower) in HGSC tissues (n=36). (E) Effects of rhCXCL13 on CD8+ T cells from HGSC tissues ex vivo (n=16). (F) Effects of rhCXCL13 on CXCR5+CD8+ T cells from HGSC tissues ex vivo (n=16) (Mann-Whitney U test in (A, B); Pearson’s correlations in (C); linear regression in (D); paired t-test in (E, F)). Bar plots show mean±SD; *p<0.05; **p<0.01; ***p<0.001; ns, no significant difference. CXCL13, CXC-chemokine ligand 13; HGSC, high-grade serous ovarian cancer; IFN-γ, interferon-γ; PD-1, programmed cell death-1; PRF-1, perforin-1; RSEM, accurate quantification of gene and isoform expression from RNA-Seq data; TCGA, The Cancer Genome Atlas.
Figure 3
Figure 3
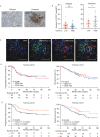
CXCL13-expressing and CXCR5-expressing CD8+ T cells colocalize and are associated with prolonged survival in HGSC. (A) Representative images of CXCR5, CD8, CXCL13 staining and H&E staining in HGSC tissue. Bar=50 µM, H&E stain. (B) Frequency of CXCR5Lo or CD8Lo and CXCR5Hi/CD8Hi patients from the training cohort was compared according to CXCL13 expression (n=185; χ2 test and p value is shown). (C) Spatial relationship map and distance from CXCR5 and CXCR5+ CD8+ T cells to the closest CXCL13+ cell (unpaired t-test). (D) Migration of CD8+ T cells, CD4+ T cells, and CD20+ B cells from single-cell suspension from HGSC towards CXCL13 with or without CXCR5 neutralizing antibody (n=5, one-way ANOVA with Bonferroni post hoc test). (E) Kaplan-Meier survival curves for PFS (left) and OS (right) of patients with HGSC from the training cohort according to CXCR5-CD8 stratification (n=185; log-rank test and p values are shown). (F) Kaplan-Meier survival curves for PFS (left) and OS (right) of patients with HGSC from the training cohort according to CXCL13-CXCR5-CD8 stratification (n=185; log-rank test and p values are shown). Bar plots show mean±SD; *p<0.05; **p<0.01; ***p<0.001; ns, no significant difference. ANOVA, analysis of variance; CXCL13, CXC-chemokine ligand 13; HGSC, high-grade serous ovarian cancer; OS, overall survival; PFS, progression-free survival.
Figure 4
Figure 4
CXCL13 correlates with conglomerated CD20+ B cells and prolongs survival. (A) Representative images of CD20+ B cells in HGSC. Diffused (left) and clustered (right). Bar=50 µM. (B) Numbers of CD20+ B cells were compared between patients with low and high CXCL13 expression. Diffused (n=107, left) and clustered (n=78, right) (Mann-Whitney U test). (C) Representative immunofluorescence staining of HGSC. The sample was stained for CXCL13 (magenta), CXCR5 (red), CD8 (green), and DAPI (blue). Bar=50 µM. (D) Kaplan-Meier survival curves for PFS (left) and OS (right) of patients with HGSC from the training cohort according to CD20+ B-cell density (n=185; log-rank test and p values are shown). (E) Kaplan-Meier survival curves for PFS (left) and OS (right) of patients with HGSC from the training cohort according to CXCL13-CD20 stratification. (n=185; log-rank test and p values are shown). CXCL13, CXC-chemokine ligand 13; DAPI, 4',6-Diamidino-2-Phenylindole, Dihydrochloride; HGSC, high-grade serous ovarian cancer; OS, overall survival; PFS, progression-free survival.
Figure 5
Figure 5
CXCL13 localizes in the context of TLSs and prolongs survival. (A) Representative images of immunostaining with H&E, CD20, CD8, and CXCL13 in HGSC. Bar=50 µM. (B) The frequency of patients with or without TLSs was compared according to CXCL13 expression (n=185, χ2 test). (C) Kaplan-Meier survival curves for OS of patients with HGSC from the training cohort without (n=135, left) or with TLSs (n=50, right) according to CXCL13 expression (log-rank test and p values are shown). (D) Representative images of immunofluorescence staining of HGSC. The sample was stained for CXCL13 (green), CXCR5 (red), CD8 (magenta), CD20 (cyan-blue) and DAPI (blue). Bar=50 µM. (E) The frequency of CXCR5Lo or CD8Lo and CXCR5Hi/CD8Hi patients from the training cohort was compared according to the TLS-CXCL13 group. (n=185; χ2 test and p value is shown). CXCL13, CXC-chemokine ligand 13; HGSC, high-grade serous ovarian cancer; OS, overall survival; DAPI, 4',6-Diamidino-2-Phenylindole, Dihydrochloride; TLSs, tertiary lymphatic structures.
Figure 6
Figure 6
CXCL13 enhances response of anti-PD-1 therapy in subcutaneous ovarian cancer mouse model. (A) Tumor growth curves of subcutaneous tumor model treated with CXCL13 or anti-PD-1 or combination of CXCL13 and anti-PD-1. Dotted lines indicate the time point at which tumor sizes were compared between control and treatment groups (n=8 per group). (B) Tumor weights of subcutaneous tumor among the indicated four groups (n=8 per group). (C) Percentage of CD8+ T cells, CD4+ T cells and Tfh in TILs from subcutaneous tumor among the indicated four groups (n=8 per group). (D) Percentage of effector cytokines (CD44, GzmB, IFN-γ, and IL-2) in CD8+ T cells from subcutaneous tumor among the indicated four groups (n=8 per group). (E) Percentage of CXCR5+CD8+ T cells from spleen, TLN, and subcutaneous tumor among the indicated four groups (n=8 per group). (F) Percentage of transcription factors (TCF1, T-bet) and Ki-67 in CXCR5+CD8+ T cells from subcutaneous tumor among the indicated four groups (n=8 per group). (G) Percentage of CD8+ T-cell percentage in mouse spleens from control and CD8+ T-cell-depleted groups (n=6 per group). (H) Tumor growth curves of subcutaneous tumor model treated by combination therapy with or without CD8+ T-cell depletion. Dotted lines indicate the time point at which tumor sizes were compared between control and treatment groups (n=6 per group). (I) Tumor weights of subcutaneous tumor model treated by combination therapy with or without CD8+ T-cell depletion (two-way ANOVA with Bonferroni post hoc test in (A, H); one-way ANOVA with Bonferroni post hoc test in (B–F) and (I); paired t-test in (G)). Bar plots show mean±SD; *p<0.05; **p<0.01; ***p<0.001; ns, no significant difference. ANOVA, analysis of variance; CXCL13, CXC-chemokine ligand 13; HGSC, high-grade serous ovarian cancer; IFN-γ, interferon-γ; IL-2, interleukin 2; OS, overall survival; PD-1, programmed cell death-1; Tfh, follicular helper T cells; TILs, tumor infiltrated lymphocytes; TLN, tumor-associated lymph nodes.

Similar articles

Cited by

References

    1. Bowtell DD, Böhm S, Ahmed AA, et al. . Rethinking ovarian cancer II: reducing mortality from high-grade serous ovarian cancer. Nat Rev Cancer 2015;15:668–79. 10.1038/nrc4019 - DOI - PMC - PubMed
    1. Hamanishi J, Mandai M, Iwasaki M, et al. . Programmed cell death 1 ligand 1 and tumor-infiltrating CD8+ T lymphocytes are prognostic factors of human ovarian cancer. Proc Natl Acad Sci U S A 2007;104:3360–5. 10.1073/pnas.0611533104 - DOI - PMC - PubMed
    1. Disis ML, Taylor MH, Kelly K, et al. . Efficacy and safety of Avelumab for patients with recurrent or refractory ovarian cancer: phase 1B results from the javelin solid tumor trial. JAMA Oncol 2019;5:393–401. 10.1001/jamaoncol.2018.6258 - DOI - PMC - PubMed
    1. E J, Yan F, Kang Z, et al. . CD8+CXCR5+ T cells in tumor-draining lymph nodes are highly activated and predict better prognosis in colorectal cancer. Hum Immunol 2018;79:446–52. 10.1016/j.humimm.2018.03.003 - DOI - PubMed
    1. He R, Hou S, Liu C, et al. . Follicular CXCR5- expressing CD8(+) T cells curtail chronic viral infection. Nature 2016;537:412–6. 10.1038/nature19317 - DOI - PubMed

Publication types

MeSH terms