. 2021 Jan;9(1):e001313.
doi: 10.1136/jitc-2020-001313.

Identification of neuroblastoma cell lines with uncommon TAZ+/mesenchymal stromal cell phenotype with strong suppressive activity on natural killer cells

Affiliations

Identification of neuroblastoma cell lines with uncommon TAZ+/mesenchymal stromal cell phenotype with strong suppressive activity on natural killer cells

Claudia Canzonetta et al. J Immunother Cancer. 2021 Jan.

Abstract

Background: Neuroblastoma (NB) is the most common, extracranial childhood solid tumor arising from neural crest progenitor cells and is a primary cause of death in pediatric patients. In solid tumors, stromal elements recruited or generated by the cancer cells favor the development of an immune-suppressive microenvironment. Herein, we investigated in NB cell lines and in NB biopsies, the presence of cancer cells with mesenchymal phenotype and determined the immune-suppressive properties of these tumor cells on natural killer (NK) cells.

Methods: We assessed the mesenchymal stromal cell (MSC)-like phenotype and function of five human NB cell lines and the presence of this particular subset of neuroblasts in NB biopsies using flow-cytometry, immunohistochemistry, RT-qPCR, cytotoxicity assays, western blot and silencing strategy. We corroborated our data consulting a public gene-expression dataset.

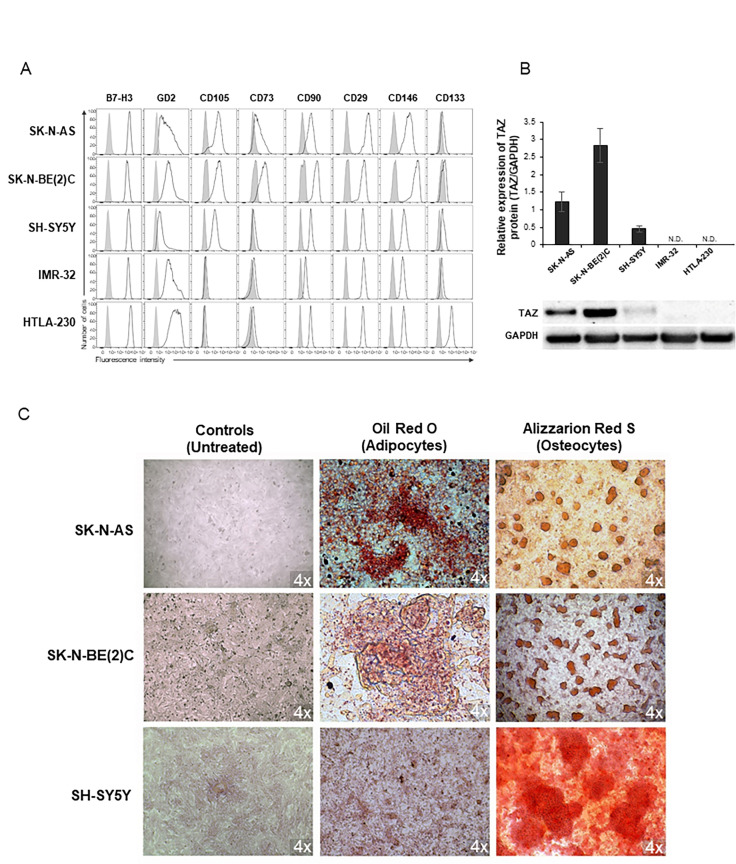
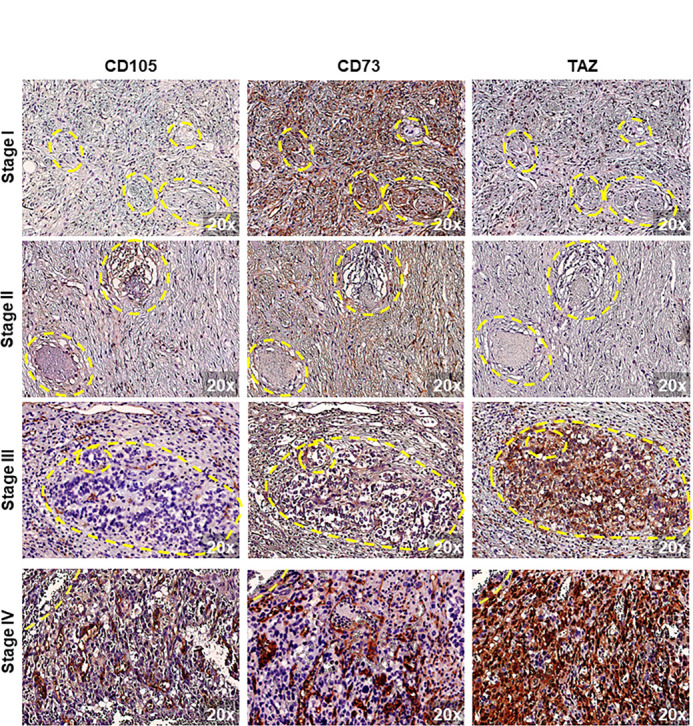
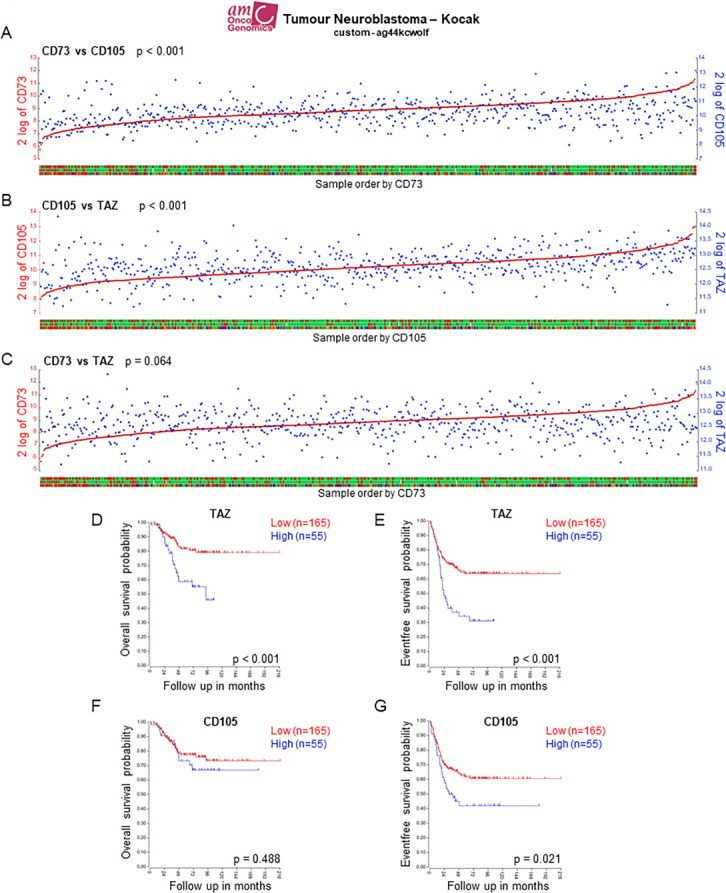
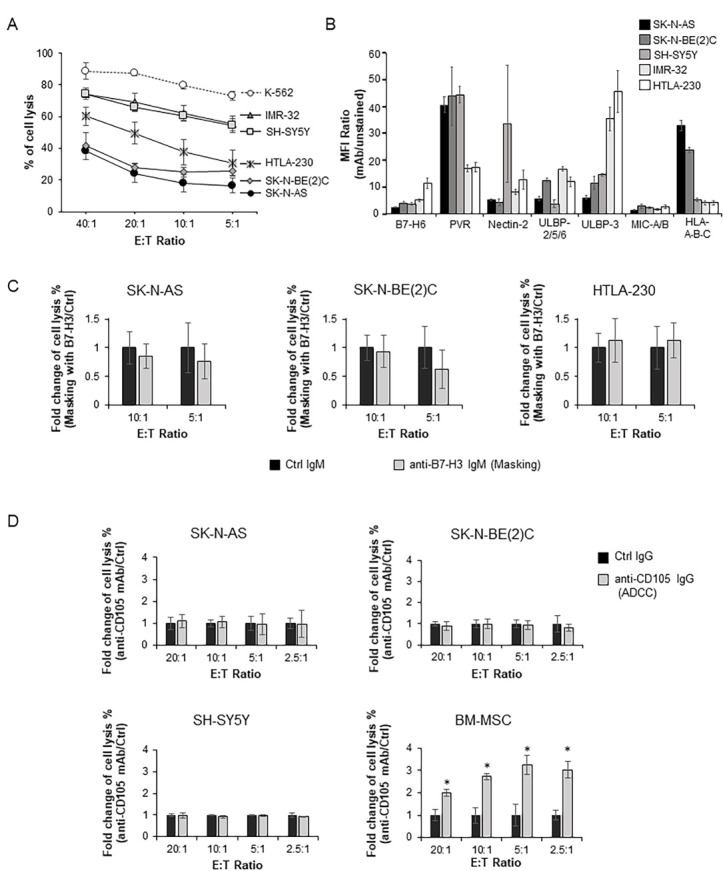
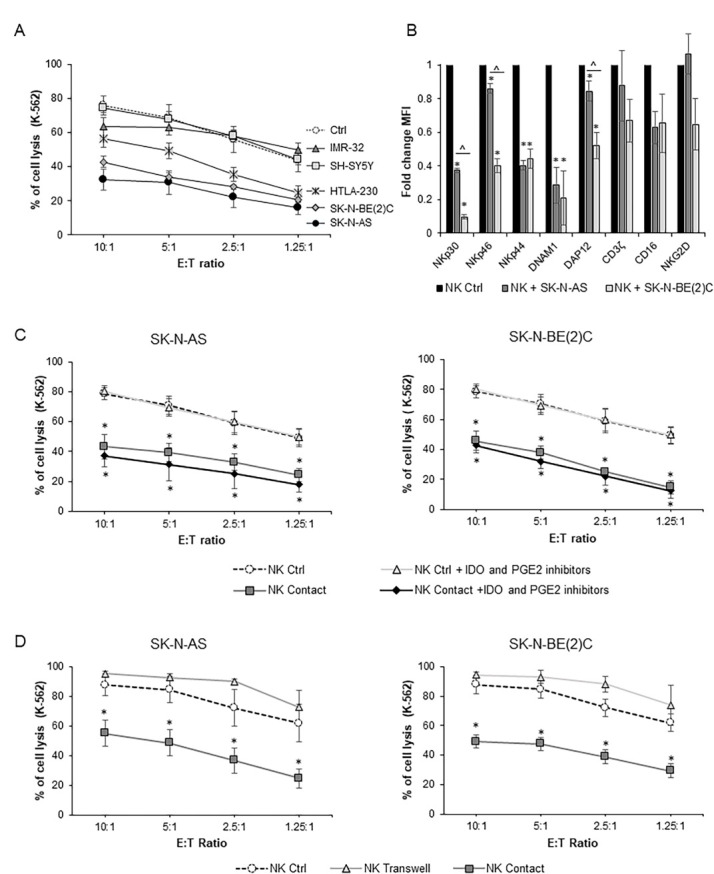
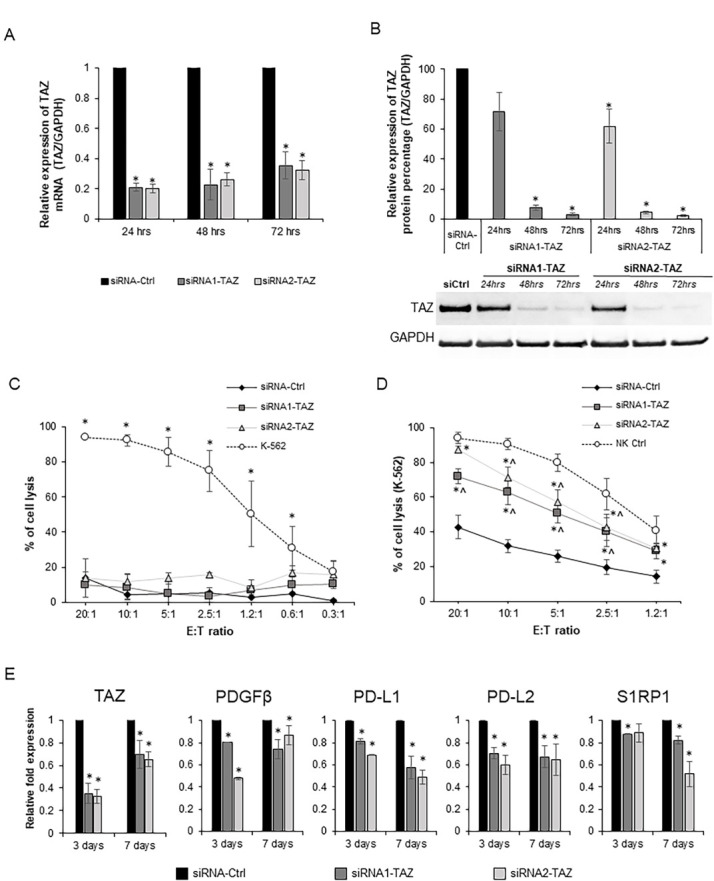
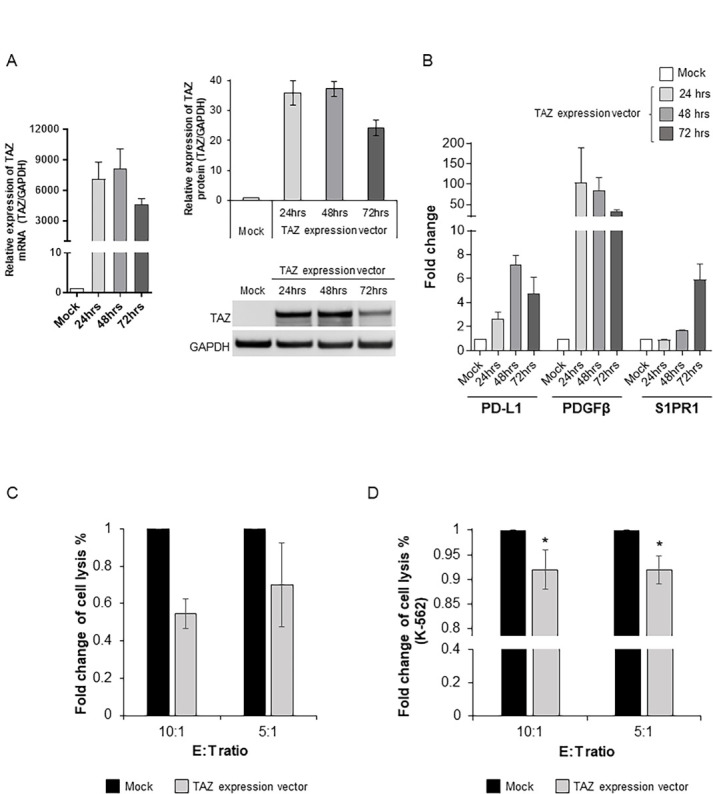
Results: Two NB cell lines, SK-N-AS and SK-N-BE(2)C, exhibited an unprecedented MSC phenotype (CD105+/CD90+/CD73+/CD29+/CD146+/GD2+/TAZ+). In these NB-MSCs, the ectoenzyme CD73 and the oncogenic/immune-regulatory transcriptional coactivator TAZ were peculiar markers. Their MSC-like nature was confirmed by their adipogenic and osteogenic differentiation potential. Immunohistochemical analysis confirmed the presence of neuroblasts with MSC phenotype (CD105+/CD73+/TAZ+). Moreover, a public gene-expression dataset revealed that, in stage IV NB, a higher expression of TAZ and CD105 strongly correlated with a poorer outcome.Among the NB-cell lines analyzed, only NB-MSCs exhibited multifactorial resistance to NK-mediated lysis, inhibition of activating NK receptors, signal adaptors and of NK-cell cytotoxicity through cell-cell contact mediated mechanisms. The latter property was controlled partially by TAZ, since its silencing in NB cells efficiently rescued NK-cell cytotoxic activity, while its overexpression induced opposite effects in non-NB-MSC cells.

Conclusions: We identified a novel NB immunoregulatory subset that: (i) displayed phenotypic and functional properties of MSC, (ii) mediated multifactorial resistance to NK-cell-induced killing and (iii) efficiently inhibited, in coculture, the cytotoxic activity of NK cells against target cells through a TAZ-dependent mechanism. These findings indicate that targeting novel cellular and molecular components may disrupt the immunomodulatory milieu of the NB microenvironment ameliorating the response to conventional treatments as well as to advanced immunotherapeutic approaches, including adoptive transfer of NK cells and chimeric antigen receptor T or NK cells.

Keywords: biomarkers; immune evation; killer cells; natural; neuroblastoma; tumor; tumor escape.


Conflict of interest statement

Competing interests: None declared.

Figures

Figure 1
Figure 1
Evaluation of the mesenchymal phenotype in NB cell lines. (A) Flow-cytometry analysis of the indicated MSCs and NB surface markers in NB cell lines. Gray histograms represent unstained controls, and white histograms represent stained samples. A representative experiment is shown of n=5 experiments performed. (B) WB of TAZ expression in different NB cell lines. GAPDH was used as loading control. Histograms represent the relative quantification of TAZ protein expression normalized for GAPDH. Data are expressed as mean±SD (n=3) (upper panel). A representative WB experiment is shown (lower panel). (C) Optical microscope photographs showing osteogenic and adipogenic differentiation capacity of putative NB-MSCs cell lines. Controls are represented by the NB lines cultured in their own medium. The differentiation into adipocytes is revealed by the formation of lipid droplets stained with Oil Red O. The differentiation into osteoblasts is documented by the detection of calcium depositions positive for Alizarin Red S. Original magnification 4×. The photos are representative of n=3 independent experiments. MSC, mesenchymal stromal cell; NB, neuroblastoma; WB, Western blot.
Figure 2
Figure 2
Expression of CD105, CD73 and TAZ in human NB tissue sections by IHC. Representative images of sections of 6 NB tumors from OPBG’s donors and 27 cases of NB tissue microarrays (n=33) stained for CD105, CD73 and TAZ. 20× magnification was used for each image. Dashed yellow lines indicate the same areas in the different tumor sections analyzed. Vascular structures and rare stromal elements stained positive for CD105 and CD73 markers in all samples. IHC, immunohistochemistry; NB, neuroblastoma.
Figure 3
Figure 3
Negative impact of the high expression of CD73, CD105 and TAZ on stage IV NB Using the public dataset R2 (Kocak, custom ag44kcwolf, n=649 cases) several analyses were performed. A correlation analysis between CD73 versus CD105 (A), CD105 versus TAZ (B) and CD73 versus TAZ (C) has been carried out. OS and EFS probabilities according to the level of expression (high versus low) of TAZ (D-E) and CD105 (F-G) in stage IV MYCN non-amplified NB has been performed using as cut-off the last quartile of the distribution. EFS, event-free survival; NB, neuroblastoma; OS, overall survival.
Figure 4
Figure 4
Susceptibility of NB-cell lines to NK-cell-mediated lysis. (A), Allogeneic aNK cells were used as effector cells against CMFDA-labeled NB cell lines used as targets at different E:T ratios. Data were expressed as mean±SD (n=6) of percent of cell lysis (PI+ cells). (B) Flow-cytometry analysis of surface B7-H6, PVR, Nectin-2, ULBP-2/5/6, ULBP-3, MIC-A/B and HLA class I molecules (HLA-A-B-C) in different NB cell lines. MFI ratio was expressed as mean±SD (n=4). (C) aNK cell-mediated cytotoxicity assays against SK-N-AS, SK-N-BE(2)C and HTLA-230 either in the presence or absence of anti B7-H3 masking mAb. Allogeneic aNK cells were used as effector cells against 51Cr-labeled NB target cells at 10:1 and 5:1 E:T ratios. Anti-B7-H3 IgM (M5B14) or control IgM mAbs (Ctrl) were added to cultures. Data are expressed as fold changes in the percent lysis as compared with controls±SD (n=4). (D) aNK cell-mediated ADCC assays against the NBCD105+ cell lines SK-N-AS, SK-N-BE(2)C, SH-SY5Y or BM-MSC using an anti-CD105 IgG mAb, that induced ADCC, or irrelevant IgG mAb as control. Target cells were labeled with 51Cr and allogeneic aNK cells used as effectors at different E:T ratios as indicated. BM-MSC were used as positive control. Data are expressed as fold changes of the percent lysis as compared with control ±SD (n=3). *P<0.05 vs Ctrl. ADCC, antibody-dependent cellular cytotoxicity; aNK, activated natural killer; BM-MSC, bone marrow-derived mesenchymal stromal cell; NB, neuroblastoma.
Figure 5
Figure 5
Evaluation of NK cell cytotoxic activity after coculture with NB cell lines. (A) NK cytotoxicity assays against CMFDA-labeled K-562 target cells were performed after 4 days coculture of freshly isolated PB NK cells either in the presence of different NB cell lines or alone (NK Ctrl). Percentages of cell lysis were expressed as mean±SD (n=6). (B) Flow-cytometry analysis of the activating or inhibitory receptors on NK cells after 4 days coculture with the indicated NB cells. Controls are NK cells cultured alone (NK Ctrl). Fold change MFI were expressed as mean±SD (n=3). *P<0.05 vs NK only. ∧P<0.05 between NK+SK-N-AS and NK+SK-N-BE(2)C. (C), Percentage of K-562 cells lysis in cytotoxicity assays using freshly isolated NK cells after 4 days coculture with SK-N-AS or SK-N-BE(2)C cell lines either in the presence or in the absence of IDO and PGE2 inhibitors (NK Contact and NK Contact+IDO and PGE2 inhibitors). NK cultured alone with or without inhibitors (NK Ctrl and NK Ctrl+IDO and PGE2 inhibitors) were used as controls. Values are expressed as mean±SD (n=3). *P<0.05 vs NK Ctrl and vs NK Ctrl+IDO and PGE2 inhibitors. (D) NK-cell cytotoxicity assays against CMFDA-labeled K-562 cells after 4 days coculture with SK-N-AS or SK-N-BE(2)C cell lines under transwell or cell-to-cell contact conditions. In this culture setting, freshly isolated NK cells were cultured in contact with SK-N-AS or SK-N-BE(2)C in the lower chamber (NK Contact) or in the upper chamber (NK Transwell). NK cultured alone for 4 days were used as control (NK Ctrl). Percentages of K-562 cells lysis are expressed as mean±SD (n=3). *P<0.05 vs NK Ctrl. IDO, indoleamine 2,3-dioxygenase; NB, neuroblastoma; NK, natural killer.
Figure 6
Figure 6
Effect of TAZ silencing on SK-N-AS cell line mediated inhibition of NK cell cytotoxicity. (A) Relative expression of TAZ mRNA normalized on GAPDH expression in SK-N-AS after transfection with siRNA1-TAZ, siRNA2-TAZ and siRNA-Ctrl, at different time point, by RT-qPCR. Data are expressed as mean±SD (n=3). *P<0.05 vs siRNA-Ctrl. (B) WB of TAZ expression in SK-N-AS after transfection with siRNA1-TAZ, siRNA2-TAZ and siRNA-Ctrl, at different time points. GAPDH was used as loading control. Histograms represent densitometry analysis of TAZ protein normalized on GAPDH protein expression. Data are expressed as mean±SD (n=3) (upper panel). A representative WB experiment is shown (lower panel). *P<0.05 vs siRNA-Ctrl. (C) aNK cell cytotoxicity assays against transfected SK-N-AS or K-562 cells labeled with CMFDA. SK-N-AS were transfected with siRNA1-TAZ, siRNA2-TAZ or siRNA-Ctrl and after 3 days were used as target in a cytotoxicity assay. K-562 cells were used as control target. Percentages of cell lysis are expressed as mean±SD (n=3). *P<0.05 K-562 vs siRNA SK-NAS cells. (D) NK cell cytotoxicity assays on 4 days coculture with SK-N-AS transfected with siRNA1-TAZ, siRNA2-TAZ and siRNA-Ctrl. NK cultured alone used as controls (NK Ctrl). Three days after transfection, SK-N-AS were cultured with freshly isolated NK cells for 4 days. Then, NK cells were analyzed for their cytotoxic capacity against K-562 target cells. Percentage lysis of CMFDA labeled-K-562 cells was expressed as mean±SD (n=3). *P<0.05 vs siRNA-Ctrl; ∧p<0.05 vs NK Ctrl. (E) Expression of the indicated genes in SK-N-AS after transfection with siRNA1-TAZ, siRNA2-TAZ and siRNA-Ctrl, at different time point, is evaluated by RT-qPCR. GAPDH expression is used as reference gene. Data are expressed as fold changes compared with siRNA-Ctrl. Values indicate mean±SD (n=3). *P<0.05 vs siRNA-Ctrl. NK, natural killer.
Figure 7
Figure 7
Effect of TAZ overexpression on immunomodulatory properties of SH-SY5Ycells. (A,) Analysis of TAZ mRNA by RT-qPCR (left panel) and protein expression by WB (right panel) at different time points (24 hours, 48 hours, 72 hours) on transfected SH-SY5Y cells. Cells transfected without TAZ expression vector were used as mock control. Similar results were obtained using transfected cells with a vector encoding GFP only as mock control (data not shown). GAPDH was used as reference gene in RT-qPCR and as loading control in WB analysis. RT- qPCR data are expressed as fold change as compared with control at the same time point. Histograms above WB represent densitometry for the relative quantification of TAZ protein expression normalized for GAPDH. Data are expressed as mean±SD (n=3). A representative WB experiment is shown. (B,) Expression of the indicated genes in SH-SY5Y after transfection with TAZ expression vector compared with Mock control at different time point, is evaluated by RT-qPCR. GAPDH expression is used as reference gene. Data are expressed as fold changes compared with Mock control. Values indicate mean±SD (n=3). (C) aNK cell-mediated cytotoxicity assays against SH-SY5Y labeled with CMFDA. SH-SY5Y were transfected with TAZ expression vector or plasmid vector encoding GFP only (Mock) and after 48 hours was used as target in a cytotoxicity assay at 10:1 and 5:1 E:T ratios. Data are expressed as fold changes of cell lysis percent compared with controls (Mock) ±SE (n=3). (D), NK-cell cytotoxicity assays against CMFDA-labeled K-562 cells on coculture with SH-SY5Y transfected with TAZ expression vector or plasmid vector encoding GFP only (Mock). 24-hour days after transfection, SH-SY5Y were cultured in contact with freshly isolated NK cells for 4 days. Then, NK cells were analyzed for their cytotoxic capacity against K-562 used as control target cells at 10:1 and 5:1 E:T ratios. Percentage lysis of CMFDA labelled-K-562 cells were expressed as fold changes of cell lysis percent compared with controls (Mock)±SE (n=3). *P<0.05 vs Mock. aNK, activated natural killer.

Similar articles

Cited by

References

    1. Maris JM. Recent advances in neuroblastoma. N Engl J Med 2010;362:2202–11. 10.1056/NEJMra0804577 - DOI - PMC - PubMed
    1. Cheung N-KV, Dyer MA. Neuroblastoma: developmental biology, cancer genomics and immunotherapy. Nat Rev Cancer 2013;13:397–411. 10.1038/nrc3526 - DOI - PMC - PubMed
    1. Cohn SL, Pearson ADJ, London WB, et al. . The International neuroblastoma risk group (INRG) classification system: an INRG Task force report. J Clin Oncol 2009;27:289–97. 10.1200/JCO.2008.16.6785 - DOI - PMC - PubMed
    1. Matthay KK, Maris JM, Schleiermacher G, et al. . Neuroblastoma. Nat Rev Dis Primers 2016;2:16078. 10.1038/nrdp.2016.78 - DOI - PubMed
    1. Moreno L, Rubie H, Varo A, et al. . Outcome of children with relapsed or refractory neuroblastoma: a meta-analysis of ITCC/SIOPEN European phase II clinical trials. Pediatr Blood Cancer 2017;64:25–31. 10.1002/pbc.26192 - DOI - PubMed

Publication types

MeSH terms