. 2021 Mar 3;41(9):1850-1863.
doi: 10.1523/JNEUROSCI.1719-20.2020. Epub 2021 Jan 15.

The Cellular Electrophysiological Properties Underlying Multiplexed Coding in Purkinje Cells

Affiliations

The Cellular Electrophysiological Properties Underlying Multiplexed Coding in Purkinje Cells

Yunliang Zang et al. J Neurosci. .

Abstract

Neuronal firing patterns are crucial to underpin circuit level behaviors. In cerebellar Purkinje cells (PCs), both spike rates and pauses are used for behavioral coding, but the cellular mechanisms causing code transitions remain unknown. We use a well-validated PC model to explore the coding strategy that individual PCs use to process parallel fiber (PF) inputs. We find increasing input intensity shifts PCs from linear rate-coders to burst-pause timing-coders by triggering localized dendritic spikes. We validate dendritic spike properties with experimental data, elucidate spiking mechanisms, and predict spiking thresholds with and without inhibition. Both linear and burst-pause computations use individual branches as computational units, which challenges the traditional view of PCs as linear point neurons. Dendritic spike thresholds can be regulated by voltage state, compartmentalized channel modulation, between-branch interaction and synaptic inhibition to expand the dynamic range of linear computation or burst-pause computation. In addition, co-activated PF inputs between branches can modify somatic maximum spike rates and pause durations to make them carry analog signals. Our results provide new insights into the strategies used by individual neurons to expand their capacity of information processing.SIGNIFICANCE STATEMENT Understanding how neurons process information is a fundamental question in neuroscience. Purkinje cells (PCs) were traditionally regarded as linear point neurons. We used computational modeling to unveil their electrophysiological properties underlying the multiplexed coding strategy that is observed during behaviors. We demonstrate that increasing input intensity triggers localized dendritic spikes, shifting PCs from linear rate-coders to burst-pause timing-coders. Both coding strategies work at the level of individual dendritic branches. Our work suggests that PCs have the ability to implement branch-specific multiplexed coding at the cellular level, thereby increasing the capacity of cerebellar coding and learning.

Keywords: Purkinje cell; burst-pause computation; cerebellum; dendritic spikes; linear computation; multiplexed coding.


Figures

Figure 1.
Figure 1.
Bimodal dendritic responses in individual PCs. A, Clustered PF synapses within a branch (green dots). Three recording sites: a on the tip, b on the distal main dendrite, and c on the proximal main dendrite. B, Color-coded voltage response peaks to clustered PF input. C, Decayed spike propagation in somapetal direction. Red circles represent sites on spiny dendrites and blue circles represent sites on the main dendrite. Simulated membrane potentials at sites a and b with increasing PF synapses (from 5 to 50) are shown in D, E, respectively. F, Experimentally measured dendritic responses with increasing stimulation intensity compared with site b in E (data shared by Ede Rancz and Michael Häusser; Rancz and Häusser, 2010). Initial parts of the traces were omitted because of stimulation artifacts. G, Simulated membrane potentials at site c (above) and the soma (bottom, clipped) with increasing PF synapses (from 5 to 50). Note the backpropagated somatic Na+ spikes at site c. H, Bimodal dendritic responses at sites a (gray circles) and b (pink circles) versus synchronously activated synapses. Under each condition (the same synaptic number), 10 trials were simulated with randomly distributed synapses. The spike threshold is circled. I, Membrane potentials at site b with 35 PF synapses activated (n = 10). Some of the traces are overlapped, resulting in seemingly thicker lines.
Figure 2.
Figure 2.
Voltage dependence of dendritic spike threshold. A, A total of 40 PF synapses were distributed in a branch (green dots). Dendritic responses recorded at the tip, where no PF synapses were present, with 0- and −0.2-nA somatic holding currents are shown in B, C, respectively. Top panels show membrane potentials at the dendritic tip, and bottom panels show principal currents under corresponding conditions. The surface area of the segment is 15 μm2. D, Recovery of dendritic spiking after locally blocking Kv4 current by 50% (with −0.2-nA somatic holding current). E, Dendritic responses versus number of synapses with 0- and −0.2-nA somatic holding currents. F, G, Somatic (black) and dendritic (red) responses to a train of 10 PF stimuli at 200 Hz. Ten PF synapses were activated during each stimulus. F, 0-nA somatic holding current. G, −0.2-nA somatic holding current. Vertical bars represent the timing of synchronous PF activation.
Figure 3.
Figure 3.
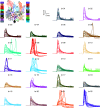
Dendritic responses in individual branches. A total of 22 branches are defined and illustrated by corresponding colors. Black trunk represents the main dendrites. In each panel, traces plot dendritic responses to increasing PF input (from 5 to 70 synapses) in a branch. A repertoire of different response patterns was observed. In branches 8, 12, and 21–22, PF dendric spikes have low thresholds; in branches 1–2, 9–11, and 16–17, spike thresholds are high, making the step increases in input-output curves less obvious; in branches 3–5, 13–15, and 18–20, dendritic spikes cannot be triggered by activating up to 70 PF synapses. In branches 6–7, dendritic spikes occur first in the more excitable distal branch 8 and then trigger spike occurrence in these two branches, as evidenced by delayed spiking.
Figure 4.
Figure 4.
Branch-specific dendritic computation. A, Branch-specific computation and dendritic spike threshold. B, C, Branch-dependent dendritic and somatic responses when the soma was clamped to −71.8 mV. D, Axial currents caused by the sink to other parts when connection segments are clamped with the spike waveform shown in the inset. E, Peak amplitudes of sink-caused axial currents at individual connection segments (bottom) and the surface areas of individual branches (above). Left to right corresponds to branches 1–22. F, Ratios of current sources (branch areas) to current sinks. Except branches 4, 8, 12, 21, and 22, results in other branches were plotted as gray traces in all panels. In A, D–F, there is no holding current in the model.
Figure 5.
Figure 5.
Dendritic branch excitability with segregated clustered PF inputs. The same number of PF synapses in branch 8 and another branch i were simultaneously activated. The PC dendritic tree (Fig. 3) is composed of three main limbs from left to right. Branches 1–8 within the left main limb; branches 9–13 within the middle main limb; branches 14–22 within the right main limb. A–C, Dendritic responses in branch 8. They show how dendritic responses in branch i (1–7, 9–22) regulate the excitability of branch 8. For example, when the number of synapses is 40, “8” means there are 40 synapses only in branch 8; “8&i” means 40 PF synapses distributed in branch 8 and 40 synapses in branch i. A, Co-activated PF inputs are within the same main limb. B, C, Co-activated PF inputs are in different main limbs. D–F, Dendritic responses in branch i (4–7, 11–13, 16, 17, 21, 22). They show how dendritic responses in branch 8 regulate the excitability of branch i. “8&i” has the same meaning as in A–C; “i” means there are only clustered inputs in branch i. For D–F, only branches exhibiting nonlinear responses are shown.
Figure 6.
Figure 6.
Enhanced branch excitability by locally increased channel densities. A–C, Dendritic responses in branches 4, 10, and 15, respectively. The channel densities in each branch are scaled up to two, three, and four times of original values for different traces. Above panels show dendritic responses versus number of synapses. Bottom panels show the localization of dendric responses when channel densities in corresponding branches were increased to four times of original values.
Figure 7.
Figure 7.
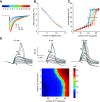
Effect of inhibition on dendritic spike thresholds. A, Dendritic tip IPSPs with increased inhibition. B, IPSP amplitudes linearly increase with inhibition from more stellate cells. In A, B, the model was silenced by somatic holding current, with the soma to −71.8 mV and the dendrite to −67.5 mV. C. Inhibition right shifts dendritic spike thresholds (FFI delay is 1.4 ms). For A–C, color codes the number of activated stellate cells (each stellate cell form 16 synapses onto the PC), defined by the color bar in panel A. D, Preceding inhibition preferentially inhibits spike initiation. Example dendritic responses when inhibition occurs −4.5, 0, and 4.5 ms relative to PF excitation are shown on top from left to right. Numbers represent activated PF synapses with inhibition from eight activated stellate cells. Bottom plot summarizes the relationship between dendritic response amplitudes, inhibition timing and number of activated PF synapses (inhibition from eight stellate cells).
Figure 8.
Figure 8.
Dendritic spikes trigger branch-specific somatic burst-pause sequences. A, B, Membrane potentials at the dendritic tip and the soma, respectively (20 trials randomly selected from 500 simulation trials). C, PSTHs of somatic spiking rate (bin size 2 ms, 500 simulation trials with randomly distributed PF synapses and disturbed somatic spike timing). From left to right in A–C, PF synapses increase from 10 to 70, and simulation results were obtained in branch 12 (Fig. 3). D, Branch-specific somatic maximum spike rates caused by localized dendritic spikes. E, Branch-specific somatic pause durations following bursts.
Figure 9.
Figure 9.
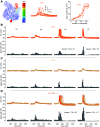
The effect of PF dendritic spikes on somatic output under in vivo condition. A, Localized PF dendric spike in branch 21. Left shows the color-coded dendritic response with 65 PF synapses activated; middle shows dendritic membrane potentials with increasing PF synapses (5–70); right shows dendric responses versus activated PF synapses. B, Dendritic responses (above) and PSTHs of somatic spiking rate (bottom) with increasing PF input in branch 21. C, Dendritic responses (above) and PSTHs of somatic spiking rate (bottom) with increasing PF input in branch 15. D, Dendritic responses (above, orange for branch 21 and wheat for branch 15) and PSTHs of somatic spiking rate (bottom) with the same number of PF synapses in each branch. For dendritic responses in B–D, 20 trials were shown for each condition.
Figure 10.
Figure 10.
Modulation of somatic output by co-activated PF inputs under in vivo condition. Here, branch 15 still linearly integrates PF input with co-activated branch 8. A, Dendritic responses (above) and PSTHs of somatic spiking rate (bottom) with increasing PF input in branch 8. B, Dendritic responses (above) and PSTHs of somatic spiking rate (bottom) with increasing PF input in branch 15. C, Dendritic responses (above, red for branch 8 and wheat for branch 15) and PSTHs of somatic spiking rate (bottom) with the same number of PF inputs in each branch. For dendritic responses under each condition in A–C, 20 trials from 500 simulations were shown.
Figure 11.
Figure 11.
Summary of branch-dependent bimodal computations in PCs depending on factors such as voltage state, channel modulation, co-activation, and inhibition facilitating dendritic excitability, individual branches show either linear dendritic integrations or linear-step-plateau responses. Both dendritic responses decay significantly when propagating to the soma. Two branches were circled in the PC dendritic tree to show individual branch being the unit for both computations, cyan and magenta. In the range of linear coding, dendritic EPSPs only cause somatic bursts (indicated by clustered somatic spikes in PSTHs) and increase the somatic maximum spike rate with input strength; when dendritic spikes occur, they also cause reliable pauses following the bursts.

Similar articles

Cited by

References

    1. Arlt C, Häusser M (2020) Microcircuit rules governing impact of single interneurons on Purkinje cell output in vivo. Cell Rep 30:3020–3035.e3. 10.1016/j.celrep.2020.02.009 - DOI - PMC - PubMed
    1. Benton MD, Raman IM (2009) Stabilization of Ca current in Purkinje neurons during high-frequency firing by a balance of Ca-dependent facilitation and inactivation. Channels (Austin) 3:393–401. 10.4161/chan.3.6.9838 - DOI - PMC - PubMed
    1. Benton MD, Lewis AH, Bant JS, Raman IM (2013) Iberiotoxin-sensitive and -insensitive BK currents in Purkinje neuron somata. J Neurophysiol 109:2528–2541. 10.1152/jn.00127.2012 - DOI - PMC - PubMed
    1. Bower JM (2010) Model-founded explorations of the roles of molecular layer inhibition in regulating purkinje cell responses in cerebellar cortex: more trouble for the beam hypothesis. Front Cell Neurosci 4:27. - PMC - PubMed
    1. Branco T, Häusser M (2010) The single dendritic branch as a fundamental functional unit in the nervous system. Curr Opin Neurobiol 20:494–502. 10.1016/j.conb.2010.07.009 - DOI - PubMed

Publication types

LinkOut - more resources