. 2021 Feb 17;41(7):1597-1616.
doi: 10.1523/JNEUROSCI.2469-20.2020. Epub 2021 Jan 15.

Traumatic Brain Injury Causes Chronic Cortical Inflammation and Neuronal Dysfunction Mediated by Microglia

Affiliations

Traumatic Brain Injury Causes Chronic Cortical Inflammation and Neuronal Dysfunction Mediated by Microglia

Kristina G Witcher et al. J Neurosci. .

Abstract

Traumatic brain injury (TBI) can lead to significant neuropsychiatric problems and neurodegenerative pathologies, which develop and persist years after injury. Neuroinflammatory processes evolve over this same period. Therefore, we aimed to determine the contribution of microglia to neuropathology at acute [1 d postinjury (dpi)], subacute (7 dpi), and chronic (30 dpi) time points. Microglia were depleted with PLX5622, a CSF1R antagonist, before midline fluid percussion injury (FPI) in male mice and cortical neuropathology/inflammation was assessed using a neuropathology mRNA panel. Gene expression associated with inflammation and neuropathology were robustly increased acutely after injury (1 dpi) and the majority of this expression was microglia independent. At 7 and 30 dpi, however, microglial depletion reversed TBI-related expression of genes associated with inflammation, interferon signaling, and neuropathology. Myriad suppressed genes at subacute and chronic endpoints were attributed to neurons. To understand the relationship between microglia, neurons, and other glia, single-cell RNA sequencing was completed 7 dpi, a critical time point in the evolution from acute to chronic pathogenesis. Cortical microglia exhibited distinct TBI-associated clustering with increased type-1 interferon and neurodegenerative/damage-related genes. In cortical neurons, genes associated with dopamine signaling, long-term potentiation, calcium signaling, and synaptogenesis were suppressed. Microglial depletion reversed the majority of these neuronal alterations. Furthermore, there was reduced cortical dendritic complexity 7 dpi, reduced neuronal connectively 30 dpi, and cognitive impairment 30 dpi. All of these TBI-associated functional and behavioral impairments were prevented by microglial depletion. Collectively, these studies indicate that microglia promote persistent neuropathology and long-term functional impairments in neuronal homeostasis after TBI.SIGNIFICANCE STATEMENT Millions of traumatic brain injuries (TBIs) occur in the United States alone each year. Survivors face elevated rates of cognitive and psychiatric complications long after the inciting injury. Recent studies of human brain injury link chronic neuroinflammation to adverse neurologic outcomes, suggesting that evolving inflammatory processes may be an opportunity for intervention. Here, we eliminate microglia to compare the effects of diffuse TBI on neurons in the presence and absence of microglia and microglia-mediated inflammation. In the absence of microglia, neurons do not undergo TBI-induced changes in gene transcription or structure. Microglial elimination prevented TBI-induced cognitive changes 30 d postinjury (dpi). Therefore, microglia have a critical role in disrupting neuronal homeostasis after TBI, particularly at subacute and chronic timepoints.

Keywords: CSF1R antagonist; microglia; neuroinflammation; neurotrauma; traumatic brain injury.


Figures

Figure 1.
Figure 1.
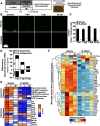
Microglia-dependent and microglia-independent differential gene expression in the cortex changes over 1, 7, and 30 dpi. A, Adult C57BL/6 mice were provided diets formulated with either vehicle (Veh) or a CSF1R antagonist (PLX5622) for 14 d. Next, mice were uninjured (Con) or were subjected to mFPI (TB1; n = 4). Mice were maintained on vehicle or PLX diet for the duration of the experiment. At each endpoint (1, 7, or 30 dpi), mice were perfused, fixed, and cortical tissue was cryosectioned and labeled for Iba1 (microglia). B, Representative images of Iba1 labeling in the lateral cortex. Scale bar: 50 μm. C, Quantification of average number of Iba1+ microglia per 20× field. In a separate experiment, mice were provided diets formulated as above for 14 d before TBI (n = 5–9). Mice were killed 1, 7, or 30 dpi. Brains were flash-frozen fresh and cryosectioned at either 30 or 200 µm. The 30-µm sections were labeled for CD11b and used to identify cortical regions of interest. The 200-µm sections were dissected while frozen and immediately lysed for RNA extraction. RNA copy number was determined using NanoString Neuropathology panel plus. D, The number of differentially expressed genes (increased or decreased) by TBI and influenced by time or PLX5622. E, IPA comparison analysis of canonical pathways and upstream regulators of the differentially expressed genes based on z score (p-adj < 0.05). Orange indicates high relative z score while blue indicates low relative z score. F, Heatmap shows average z score of microglial signature genes that were differentially expressed following PLX5622 administration. Extended Data Figure 1-1 shows (1) representative images of GFAP labeling in the lateral cortex (scale bar: 50 μm); and (2) quantification of average GFAP+ percent-area. Raw and normalized counts are provided in Extended Data Figure 1-2, and IPA results are available in Extended Data Figure 1-3. Bars represent the mean ± SEM. Means with (*) are significantly different from Veh-Con (p < 0.05).
Figure 2.
Figure 2.
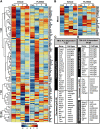
Evolving inflammatory mRNA expression in the cortex 1, 7, and 30 dpi. Adult C57BL/6 mice were provided diets formulated with either vehicle (Veh) or PLX5622 (PLX) for 14 d before TBI (n = 5–9). Mice were maintained on vehicle or PLX diet for the duration of the experiment. Mice were killed 1, 7, or 30 dpi. Brains were flash-frozen fresh and cryosectioned at either 30 or 200 µm. The 30-µm sections were labeled for CD11b and used to identify cortical regions of interest. The 200-µm sections were dissected while frozen and immediately lysed for RNA extraction. RNA copy number was assessed using the NanoString Neuropathology panel. A, Heatmap of average z scores of differentially expressed genes influenced by TBI, time, or PLX5622. B, Table of genes increased or decreased 7 dpi and influenced by PLX5622. C, Table of genes increased or decreased 7 dpi and influenced by PLX5622. D, Table of genes augmented by TBI-PLX compared with TBI-vehicle at 30 dpi. All genes in the tables were differentially expressed (TBI and PLX, p < 0.05).
Figure 3.
Figure 3.
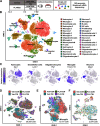
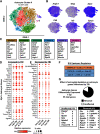
Single-cell RNA sequencing of cortex 7 dpi. A, Adult C57BL/6 mice were provided diets formulated with either vehicle (Veh) or PLX5622 (PLX) for 14 d. Next, mice were uninjured (Con) or were subjected to mFPI (TB1). Mice were maintained on vehicle or PLX diet for the duration of the experiment. Mice were killed 7 dpi, and the cortex was microdissected and enzymatically digested into a single-cell suspension. Cortices from three mice were pooled from each group; data reflect two replicate experiments (n = 6 mice per group). Single cells were run on a 10× genomics chromium controller, mRNA from individual cells was barcoded, and cDNA libraries were generated and sequenced. Sequencing results were aligned to the mouse mm10 genome and doublets and low-quality cells were removed. Clustering and differential expression was generated using Seurat in R. B, tSNE clusters show individual cell types identified based on marker gene expression. C, tSNE plots highlight primary CNS cell types by marker gene expression: astrocytes (Gja1), endothelial cells (Ly6c1), oligodendrocytes (Plp1), microglia (Tmem119), and neurons (Meg3). D, tSNE highlights distribution of all cells across experimental groups. Subclusters of microglia (E) and neurons (F) were selected based on expression of Tmem119 and Meg3, respectively. tSNE plots highlight distribution of experimental groups within subclusters. tSNE plots in Extended Data Figure 3-1 represent distribution of cells across the four experimental groups: (1) Veh-CON, (2) PLX-CON, (3) Veh-TB1, and (4) PLX-TB1. Results from cluster expression analysis and differential expression for cell type subsets is available in Extended Data Figure 3-2.
Figure 4.
Figure 4.
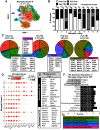
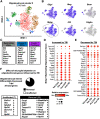
Trauma-associated mRNA signatures and increased type-1 interferon signaling evident in cortical microglia after TB1. Adult C57BL/6 mice were provided diets formulated with either vehicle (Veh) or PLX5622 (PLX) for 14 d. Next, mice were uninjured (control) or were subjected to mFPI (TB1). Mice were maintained on vehicle or PLX diet for the duration of the experiment. Mice were killed 7 dpi, and single cells were isolated and sequenced as described in Figure 3. A, tSNE reflects subclustering of Tmem119+ microglia (12,181 cells) from all samples. B, Distribution of microglia from each experimental condition across the 10 microglial clusters. C, Pie-graphs reflect proportion of each experimental condition in each microglial cluster. Top genes expressed significantly more in a given cluster than in all other microglia are shown. D, Dot plot shows relative and proportional expression of microglial signature (Tgfbr1, P2ry12, Cx3cr1, Tmem119), neurodegenerative-associated (Trem2, Apoe, Clec7a, Cd52), and interferon-related genes (Ifitm3, Irf7, Ifi27l2a, Stat1). E, Subset of genes increased (top) and decreased (bottom) in Veh-TB1 compared with Veh-Con (p-adj < 0.05). F, IPA (upstream regulators) of significantly differentially expressed genes between Con-Veh and TB1-Veh (p-adj < 0.05). G, Clusters enriched in specific experimental groups. Heatmap in Extended Data Figure 4-1 reflects top genes expressed by each Tmem119+ microglia cluster.
Figure 5.
Figure 5.
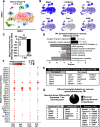
TB1 induced inflammatory and reactive astrocyte signature that was partially prevented by microglial depletion. Adult C57BL/6 mice were provided diets formulated with either vehicle (Veh) or PLX5622 (PLX) for 14 d. Next, mice were uninjured (control) or were subjected to mFPI (TB1). Mice were maintained on vehicle or PLX diet for the duration of the experiment. Mice were killed 7 dpi, and single cells were isolated and sequenced as described in Figure 3. A, tSNE reflects subclustering of Gja+ astrocytes (10,637 cells) from all samples. B, tSNE plots highlight gene expression of astrocytic genes across subclusters, with darker color reflecting higher expression. C, Top genes significantly expressed in a given cluster than in all other astrocytes. Differential gene expression between neurons from Veh-Con and Veh-TBI was determined (p-adj < 0.05). Dot plots reflect genes increased (D) and decreased (E) in Veh-TBI compared with Veh-CON. Differentially expressed genes between Veh-CON and Veh-TBI were used to determine IPA upstream regulators (F). G, Pie-graph reflects the proportion of these genes whose expression pattern was reversed (black) or unaffected (white) by PLX5622 administration. Lists reflect genes with lowest p-adj between Veh-Con and Veh-TBI and arrows reflect expression change after TBI (increased or decreased).
Figure 6.
Figure 6.
Myelinating oligodendrocytes underwent transcriptional changes consistent with myelination and CNS-damage response after TBI that was attenuated by microglial depletion. Adult C57BL/6 mice were provided diets formulated with either vehicle (Veh) or PLX5622 (PLX) for 14 d. Next, mice were uninjured (control) or were subjected to mFPI (TB1). Mice were maintained on vehicle or PLX diet for the duration of the experiment. Mice were killed 7 dpi, and single cells were isolated and sequenced as described in Figure 3. A, tSNE reflects subclustering of Plp1+ oligodendrocytes (2142 cells) from all samples. B, tSNE plots highlight gene expression of oligodendrocyte genes across subclusters, with darker color reflecting higher expression. C, Shows top genes significantly expressed by myelinating oligodendrocytes (Mobp+, clusters 0–4, 6, 8), OPCs (cluster 5), and preoligodendrocytes (cluster 7). Differential gene expression between myelinating oligodendrocytes from Veh-Con and Veh-TB1 was determined (p-adj < 0.05). Dot plots reflect genes increased (D) and decreased (E) in Veh-TB1 compared with Veh-CON. F, Pie-graph reflects the proportion of these genes whose expression pattern was reversed (black) or unaffected (white) by PLX5622 administration. Lists reflect genes with lowest p-adj between Veh-Con and Veh-TB1 and arrows reflect expression change after TB1 (increased or decreased).
Figure 7.
Figure 7.
TB1-associated reduction of neuronal homeostatic gene expression 7 dpi was ameliorated by microglial depletion. Adult C57BL/6 mice were provided diets formulated with either vehicle (Veh) or PLX5622 (PLX) for 14 d. Next, mice were uninjured (control) or were subjected to mFPI (TB1). Mice were maintained on vehicle or PLX diet for the duration of the experiment. Mice were killed 7 dpi, and single cells were isolated and sequenced as described in Figure 3. A, tSNE reflects subclustering of Meg3+ neurons (2878 cells) from all samples. B, tSNE plots highlight gene expression of neuronal markers across subclusters, with darker color reflecting higher expression. Differential gene expression between neurons from Veh-Con and Veh-TB1 was determined (p-adj < 0.05). C, Number of increased and decreased genes. IPA (D, canonical pathways; E, upstream regulators) of differentially expressed genes between Con-Veh and TB1-Veh (p-adj < 0.05). F, Dot plot reflects expression of genes used in top pathways affected by TB1 in neurons. G, Pie-graph reflects the proportion of these genes whose expression pattern was reversed (black), partially reversed (gray), or unaffected (white) by PLX5622 administration. Lists reflect genes with lowest p-adj between Veh-Con and Veh-TB1 and arrows reflect expression change after TB1 (increased or decreased). Heatmap in Extended Data Figure 7-1 reflects top genes expressed by each Meg3+ neuron cluster. Graph in Extended Data Figure 7-2 reflects distribution of Meg3+ neurons from each experimental condition across the 11 neuronal clusters.
Figure 8.
Figure 8.
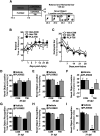
Increased dendritic remodeling 7 dpi was dependent on microglia. A, Adult Thy-1 GFP+ mice were provided diets formulated with either vehicle (Veh) or a CSF1R antagonist (PLX5622) for 14 d. Next, mice were uninjured (Con) or were subjected to mFPI (TB1). Mice were maintained on vehicle or PLX diet for the duration of the experiment. At 7 dpi, mice were perfused, fixed, and brains were cryosectioned and mounted on slides for microscopy analysis of dendritic density and morphology (n = 6). B, Representative images of cortical neuron reconstructions (generated in Imaris) at 7 dpi from each treatment group. C, Sholl analysis of intersections by radius in the cortex. D, Sholl intersections area under the curve. E, Images of Thy-1 GFP + dendrites 7 dpi. F, Cortical dendritic spine number. G, Dendritic spine density classified by mature mushroom or immature stubby spines. Bars represent mean ± SEM. Means with * are significantly different from Veh-Con group (p < 0.05).
Figure 9.
Figure 9.
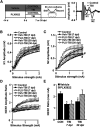
TB1-associated deficits in neuronal connectivity 30 dpi were microglia dependent. Adult C57BL/6 mice were provided diets formulated with either vehicle (Veh) or PLX5622 (PLX) for 14 d. Next, mice were uninjured (control) or were subjected to mFPI (TB1). Mice were maintained on vehicle or PLX diet for the duration of the experiment. A, At 7 and 30 dpi, mice were killed and CAP was determined from ex vivo preparation of the corpus callosum (n = 6). Representative N1 and N2 tracings of CAP from control and TB1 mice 7 dpi are shown. Graphs reflect average recording amplitude across range of stimulus intensities for (B) N1, (C) N2, and (D) N2/N1 ratio. Recorded values for maximum stimulus intensity (2 mA) are shown for (E) N2/N1 ratio. Graphs reflect averages ± SEM. Means with * are significantly different from Veh-Con group (p < 0.05). Means with # tend to be significantly different (p = 0.06) from Veh-Con group.
Figure 10.
Figure 10.
TB1-associated deficits in NOR 30 dpi were microglia dependent. A, Adult C57BL/6 mice were provided diets formulated with either vehicle (Veh) or PLX5622 (PLX) for 14 d. Next, mice were uninjured (control) or were subjected to mFPI (TB1). Mice were maintained on vehicle or PLX diet for the duration of the experiment. In the first study (n = 6), mice were subjected to the accelerating Rotarod and wire-hang test at multiple time points (1, 7, 14, 21, and 28 dpi). In the second study (n = 10), mice were treated as above and NOL and recognition was assessed 28–31 dpi. B, Latency to fall from the accelerating Rotarod and (C) latency to escape from horizontal bar were determined. In a separate cohort, mice were used in the object location and recognition tests. At 30 dpi, (D) total time spent exploring, (E) percent of time spent investigating the novel location, and (F) discrimination index for the novel location were determined. At 31 dpi, (G) total time spent exploring, (H) percent of time spent investigating the novel object, and (I) discrimination index for the novel object were determined. Graphs represent mean ± SEM. Means with * are significantly different from vehicle controls (p < 0.05).

Similar articles

Cited by

References

    1. Abdullah A, Zhang M, Frugier T, Bedoui S, Taylor JM, Crack PJ (2018) STING-mediated type-I interferons contribute to the neuroinflammatory process and detrimental effects following traumatic brain injury. J Neuroinflammation 15:323. 10.1186/s12974-018-1354-7 - DOI - PMC - PubMed
    1. Antunes M, Biala G (2012) The novel object recognition memory: neurobiology, test procedure, and its modifications. Cogn Process 13:93–110. 10.1007/s10339-011-0430-z - DOI - PMC - PubMed
    1. Bachstetter AD, Rowe RK, Kaneko M, Goulding D, Lifshitz J, Van Eldik LJ (2013) The p38α MAPK regulates microglial responsiveness to diffuse traumatic brain injury. J Neurosci 33:6143–6153. 10.1523/JNEUROSCI.5399-12.2013 - DOI - PMC - PubMed
    1. Bachstetter AD, Webster SJ, Goulding DS, Morton JE, Watterson DM, Van Eldik LJ (2015) Attenuation of traumatic brain injury-induced cognitive impairment in mice by targeting increased cytokine levels with a small molecule experimental therapeutic. J Neuroinflammation 12:69. 10.1186/s12974-015-0289-5 - DOI - PMC - PubMed
    1. Bachstetter AD, Ighodaro ET, Hassoun Y, Aldeiri D, Neltner JH, Patel E, Abner EL, Nelson PT (2017) Rod-shaped microglia morphology is associated with aging in 2 human autopsy series. Neurobiol Aging 52:98–105. 10.1016/j.neurobiolaging.2016.12.028 - DOI - PMC - PubMed

Publication types

MeSH terms