. 2021 Jan 15;12(1):391.
doi: 10.1038/s41467-020-20112-4.

Transneuronal delivery of hyper-interleukin-6 enables functional recovery after severe spinal cord injury in mice

Affiliations

Transneuronal delivery of hyper-interleukin-6 enables functional recovery after severe spinal cord injury in mice

Marco Leibinger et al. Nat Commun. .

Abstract

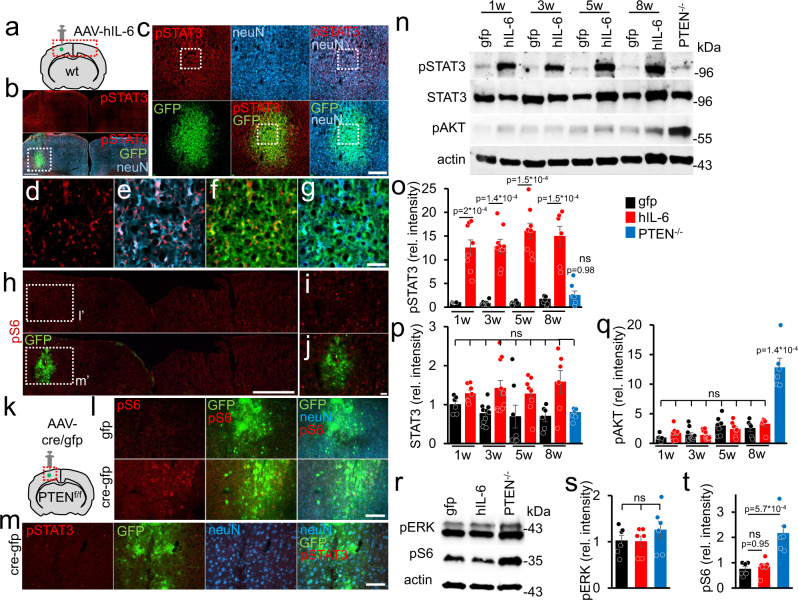
Spinal cord injury (SCI) often causes severe and permanent disabilities due to the regenerative failure of severed axons. Here we report significant locomotor recovery of both hindlimbs after a complete spinal cord crush. This is achieved by the unilateral transduction of cortical motoneurons with an AAV expressing hyper-IL-6 (hIL-6), a potent designer cytokine stimulating JAK/STAT3 signaling and axon regeneration. We find collaterals of these AAV-transduced motoneurons projecting to serotonergic neurons in both sides of the raphe nuclei. Hence, the transduction of cortical neurons facilitates the axonal transport and release of hIL-6 at innervated neurons in the brain stem. Therefore, this transneuronal delivery of hIL-6 promotes the regeneration of corticospinal and raphespinal fibers after injury, with the latter being essential for hIL-6-induced functional recovery. Thus, transneuronal delivery enables regenerative stimulation of neurons in the deep brain stem that are otherwise challenging to access, yet highly relevant for functional recovery after SCI.


Conflict of interest statement

The authors declare no competing interests.

Figures

Fig. 1
Fig. 1. Activation of signaling pathways by hIL-6 or PTEN−/−.
a Schematic drawing illustrating the location of the AAV-injection sites (dashed box) shown in (b). b Coronal section of the sensorimotor cortex from a wild-type mouse 3 weeks after intracortical injection of AAV2-hIL-6 into the left hemisphere. The section was immunohistochemically stained for phosphorylated STAT3 (pSTAT3, red) and neuN (blue). GFP (green) was co-expressed by the AAV2-hIL-6. Scale bar: 500 µm. c Higher magnification of dotted box shown in (b). Scale bar: 200 µm. dg Higher magnification of dotted boxes in (c). Scale bar: 50 µm. hj Immunohistochemical staining against phosphorylated ribosomal protein S6 (pS6, red) of sections as described in (a). Dashed boxes are presented at higher magnification in (i, j). Scale bars: 50 µm (i, j); 500 µm (h). k Schematic drawing illustrating the injection site and location of images shown in (l, m). l, m Cortical sections of PTENf/f mice 3 weeks after AAV2-Cre-GFP (Cre-gfp), or AAV2-GFP (gfp) injections, stained for pS6 (l, red), or pSTAT3 (m, red). Scale bar: 50 µm. n Western blot analysis: lysates prepared from the sensorimotor cortex of PTENf/f mice 1, 3, 5, or 8 weeks (w) after intracortical injection of either AAV2-hIL-6 (hIL-6), AAV2-GFP (gfp) or 5 weeks after AAV2-Cre application leading to PTEN−/−. AAV2-hIL-6 induced STAT3 phosphorylation (pSTAT3) at all tested time points, while PTEN−/− only caused AKT phosphorylation. Total STAT3 protein remained mostly unaltered. Beta-actin served as a loading control. oq Densitometric quantifications of western blots depicted in (n). Values represent means ± SEM of samples from 6 to 10 animals per group (gfp 1w, n = 6; hil-6 1w, n = 8; gfp 3w, n = 10; hIL-6 3w n = 10; gfp 5w, n = 7; hIL-6 5w, n = 8; gfp 8w, n = 6; hIL-6 8w, n = 6; PTEN−/−, n = 6). r Western blot analysis of cortical lysates: Phosphorylation of ERK1/2 (pERK) was not altered by AAV2-GFP-, AAV2-hIL-6, or AAV2-Cre (PTEN−/−) 5 weeks after intracortical application. Only PTEN−/− induced significant S6-phosphorylation (pS6). s/t Densitometric quantification of western blots depicted in (r). Values represent means ± SEM of 6 independent cortical lysates (n = 6) per group. Representative immunohistochemical stainings shown in (bj, l, m) were repeated four times with individual biological samples with similar results. Significances of intergroup differences in (oq, s, t) were evaluated using a one-way analysis of variance (ANOVA) followed by Tukey post hoc test. Statistical significance is indicated by p-values. ns = non-significant. Dots in o-q, s, t represent values of single samples. Source data are provided as a Source data file.
Fig. 2
Fig. 2. Hyper-IL-6 promotes CST axon regeneration after severe spinal cord crush.
a Timeline of surgical interventions for experiments presented in (bi) and Figs. 3, 4. PTENf/f mice received unilateral injections of AAV2-GFP (PTEN+/+) or AAV2-Cre (PTEN−/−) at P1. After 7 weeks, PTEN+/+ and PTEN−/− mice were then subjected to spinal cord crush (SCC) (T8) and subsequently received additional unilateral intracortical injections of either AAV2-hIL-6 (hIL-6) or AAV2-GFP (gfp). b Sagittal thoracic spinal cord sections of four differently treated groups showing BDA-labeled, retracting axons (white) of the right main CST rostral to the lesion site (dotted line). Tissues were isolated 8 weeks after the SCC. Scale bar: 500 µm. c Axon density index of CST fibers analyzing all spinal cord sections with the main CST of the animals described in (a, b). Values at distances from 1.5 mm rostral to the lesion site (−1.5) up to the proximal lesion border (0) were determined. Values represent means ± SEM of 6–10 animals per group (PTEN+/+/gfp, n = 7; PTEN+/+/hIL-6, n = 9; PTEN−/−/gfp, n = 6; PTEN−/−/hIL-6, n = 10). d Representative images of BDA-labeled sagittal spinal cord sections from PTEN-floxed mice (PTENf/f) after treatments, as described in (a, b). Tissues were isolated after 8 weeks. BDA-labeled (white) regenerating axons of the central CST beyond the lesion site (dotted line) were seen only after PTEN−/−, hIL-6, or hIL-6/PTEN−/−-treatments. Scale bar: 500 µm. eh Higher magnification of regenerating axons in dotted boxes as indicated in (d). Scale bar: 500 µm. i Quantification of regenerating CST axons at the indicated distances caudal to the lesion site. Axon numbers were divided by the total number of BDA-labeled CST fibers in the medulla (axon index) from animals as described in (a, d). Values represent the mean ± SEM of 6–10 animals per group (PTEN+/+/gfp, n = 7; PTEN+/+/hIL-6, n = 9; PTEN−/−/gfp, n = 6; PTEN−/−/hIL-6, n = 10). Significances of intergroup differences in (c, i) were evaluated using a three-way analysis of variance (ANOVA) with Holm Sidak post hoc tests. Statistical significance is indicated by p-values; ns = non-significant. Dots in c and i represent values of single animals. Source data are provided as a Source data file.
Fig. 3
Fig. 3. Hyper-IL-6 enables functional recovery after SCC.
a Representative pictures are showing open field hindlimb movement of mice at 1 and 8 weeks after spinal cord crush (wpc) and treatment, as described in Fig. 2. bd BMS score of animals as described in (a). Scores were evaluated at 0, 1, 3, 7 days post crush (dpc) and then weekly over 8 weeks after spinal cord injury. Values represent means ± SEM of 6–10 animals per group (PTEN+/+/gfp, n = 7; PTEN+/+/hIL-6, n = 9; PTEN−/−/gfp, n = 6; PTEN−/−/hIL-6, n = 10), showing either the average score of the left and right hind paw (b) or left (c) and right (d) side separately. e BMS subscore of hIL-6 treated PTEN+/+(−) and PTEN−/− mice as described in (a). f Average BMS score of left and right hind paws from mice after SCC and bilateral (left and right hemisphere (l + r)) intracortical injection of AAV2-hIL-6 compared to animals that had received a unilateral injection into the left hemisphere (l) only as presented in (b). Values represent the mean  ± SEM of 9 animals per group (l, n = 9; l + r, n = 9). Significances of intergroup differences were evaluated using a two-way analysis of variance (ANOVA) with a Tukey post hoc test (bd) or two-sided student’s t-test (f). P-values indicate statistical significance; ns = non-significant. Source data are provided as a Source data file.
Fig. 4
Fig. 4. hIL-6 promotes axon regeneration of serotonergic fibers.
a Sagittal thoracic spinal cord sections isolated from PTEN+/+, or PTEN−/− animals 8 weeks after spinal cord crush (SCC) and unilateral injection of AAV2-hIL-6 (hIL-6) or AAV2-GFP (gfp) (see Fig. 2). Raphe spinal tract (RpST) axons were stained using an anti-serotonin antibody (5-HT, white). Only AAV2-hIL-6-treated mice with or without additional PTEN−/− showed significant regeneration of serotonergic axons beyond the lesion site (dashed line). As typical for regenerating RpST axons they were located over the whole dorsoventral width of the spinal cord. Examples are indicated by dashed boxes and white arrows. Scale bar: 500 µm. bi Higher magnification of dashed boxes as indicated in (a). Scale bar: 250 µm. j Quantification of regenerating 5-HT-positive axons as described in (a) at indicated distances beyond the lesion. Values represent the mean ± SEM of 6–10 animals per group (PTEN+/+/gfp, n = 7; PTEN+/+/hIL-6, n = 9; PTEN−/−/gfp, n = 6; PTEN−/−/hIL-6, n = 10; PTEN+/+/hIL-6 (l + r); n = 6). Significances of intergroup differences were evaluated using a two-way analysis of variance (ANOVA) with a Holm Sidak post hoc test. Dots in j represent values of single animals. P-values indicate statistical significance; ns = non-significant. Source data are provided as a Source data file.
Fig. 5
Fig. 5. Regeneration of serotonergic axons is essential for functional recovery.
a Timeline of experiments shown in (bf). Adult mice were subjected to SCC and received bilateral intracortical AAV2-GFP (gfp) or AAV2-hIL-6 (hIL-6) injections. They were then scored according to the Basso Mouse Scale (BMS) at the indicated time points (arrows) over 8 weeks post crush (wpc). Six weeks after SCC, the serotonin neurotoxin 5,7-dihydroxytryptamine (DHT) was injected intracerebroventricularly into both hemispheres. One week before tissue isolation, BDA was intracortically injected to trace CST axons. b Maximum intensity projection of confocal scans through 50 µm of cleared brain stem tissue from mice that received hIL-6 and DHT treatment as described in (a) compared to a control (con) without DHT treatment. Serotonergic neurons of raphe nuclei (RN, dotted line) were visualized by 5-HT staining (green). BDA-labeled CST axons in the pyramid (PY) are shown in red. DHT treatment eradicated almost all 5-HT-positive neurons without affecting corticospinal neurons, indicated by intact BDA labeled axons. Scale bar: 100 µm. c, d Higher magnifications of dashed boxes (c' and d') in (b). Scale bar: 50 µm. e Representative images of AAV2-GFP (gfp) or AAV2-hIL-6 (hIL-6)-treated mice 6 weeks post crush (wpc), or untreated mice (con) before and 1 day after DHT injection. f BMS score of animals treated as described in (a) at indicated time points after spinal cord crush and DHT treatment. Values represent means ± SEM of 6 animals per group (n = 6), showing the average score of left and right hind paws. g, h BMS scores (g) and subscores (h) of untreated mice before (con) and 1 day (DHT 1d), or 1 week (DHT 7d) after DHT injection. Values represent means ± SEM of 6 animals showing the average score of left and right hind paws. Significances of intergroup differences were evaluated using a two-way analysis of variance (ANOVA) with a Holm Sidak post hoc test. Significance indicated by p-values within the hIL-6 group in red, within the GFP group in black, or between hIL-6 and GFP group in blue. Source data are provided as a Source data file.
Fig. 6
Fig. 6. Hyper-IL-6 transneuronally stimulates neurons of raphe and red nuclei.
a Schematic of cortical AAV2-hIL-6 application and isolated brain stem tissue (dashed box) containing the raphe nuclei (RN) for western blot analysis. b Western blots: GFP, total (STAT3) and phosphorylated STAT3 (pSTAT3), phospho-AKT (pAKT), and phospho-S6 (pS6) were analyzed in lysates of the brain stem with raphe nuclei isolated 3 weeks after intracortical injection of either AAV2-GFP (gfp) or AAV2-hIL-6 (hIL-6). GFP signals in lysates verified similar amounts of transduced collateral axons that projected to the brain stem. Beta-actin served as a loading control. c Densitometric quantification of western blots from 7 to 8 animals per group (gfp, n = 7; hIL-6, n = 8) as described in (a). Data represent means ± SEM. d, m Immunostaining of brain stem sections containing the nucleus raphe magnus (NRM, d), or nucleus raphe pallidus (NRPa, m) of AAV2-GFP or AAV2-hIL-6 treated mice as described in Fig. 2a. Sections were stained for pSTAT3 (red), GFP (green), and serotonin (5-HT, blue) to identify raphe neurons. The dashed yellow line indicates the midline. We observed a similar amount of pSTAT3 positive serotonergic neurons in the left and right hemisphere of the raphe nuclei from AAV2-hIL6 treated mice (n = 6). Scale bar: 200 µm. e, f, nu Higher magnifications of the dotted box as indicated in (d) (e–l) or (m) (n–u). Significances of intergroup differences in (c) were evaluated using the two-sided student’s t-test and indicated by p-values. Dots in c represent values of samples from single animals. Source data are provided as a Source data file.
Fig. 7
Fig. 7. CST axon collaterals project to raphe nuclei.
a Schematic illustration, indicating the cortical application, anterograde axonal transport, and terminal release of AAV1-Cre into raphe nuclei (RN, green) in Rosa-tdTomato reporter mice (sagittal view). A coronal view of the medulla illustrates RFP-positive pyramidal (PY) axon sprouts from AAV1-Cre transduced cortical neurons. Some pyramidal axons project to raphe neurons (green), leading to transneuronal transduction and subsequent RFP expression. The dotted box indicates the area of tissue sections shown in (b). b Coronal medullary sections from Rosa-tdTomato mice 2 weeks after intracortical AAV1-Cre injection as described in (a). Transneuronally transduced serotonergic neurons of the nucleus raphe magnus (NRM, left) and nucleus raphe pallidus (NRPa, right) were identified by 5-HT staining (green) and RFP fluorescence (red). Scale bar: 250 µm. cf Higher magnification of dashed yellow boxes as indicated in b. Scale bar: 100 µm. g Schematic illustration showing AAV1-Cre injection into raphe nuclei of Rosa-tdTomato reporter mice, and retrograde axonal transport to the motor cortex via pyramidal sprouts. h, i Immunohistochemical staining of brain stem sections against serotonin (5-HT, green) at the site of AAV1-Cre application as described in (g) 2 weeks after injection. Transduced cells in the nucleus raphe magnus (NRM, h), or the nucleus raphe pallidus (NRPa, I) are labeled by expression of dt tomato (RFP, red). Scale bar: 200 µm. j Reference map from the Allen Brain Atlas showing the primary motor cortex (M1) layer V in purple. k Coronal cortical section showing RFP (red) fluorescence and neuN (blue) immunostaining. The image is superimposed by the cortical map, as shown in (j), indicating the primary (M1) and secondary (M2) motor area and cortical layers 1–6. Scale bar: 500 µm. l Higher magnification of dashed boxes as indicated in (k), showing retrogradely transduced cortical layer 5 motor neurons expressing RFP. Scale bar: 250 µm. Representative immunohistochemical stainings shown in (b, h–i, k–l) were repeated three times with individual biological samples with similar results. Source data are provided as a Source data file.

References

    1. Silver J, Miller JH. Regeneration beyond the glial scar. Nat. Rev. Neurosci. 2004;5:146–156. doi: 10.1038/nrn1326. - DOI - PubMed
    1. Fischer D, Leibinger M. Promoting optic nerve regeneration. Prog. retinal eye Res. 2012;31:688–701. doi: 10.1016/j.preteyeres.2012.06.005. - DOI - PubMed
    1. Lu Y, Belin S, He Z. Signaling regulations of neuronal regenerative ability. Curr. Opin. Neurobiol. 2014;27:135–142. doi: 10.1016/j.conb.2014.03.007. - DOI - PMC - PubMed
    1. Hollis ER, 2nd, Lu P, Blesch A, Tuszynski MH. IGF-I gene delivery promotes corticospinal neuronal survival but not regeneration after adult CNS injury. Exp. Neurol. 2009;215:53–59. doi: 10.1016/j.expneurol.2008.09.014. - DOI - PMC - PubMed
    1. Hiebert GW, Khodarahmi K, McGraw J, Steeves JD, Tetzlaff W. Brain-derived neurotrophic factor applied to the motor cortex promotes sprouting of corticospinal fibers but not regeneration into a peripheral nerve transplant. J. Neurosci. Res. 2002;69:160–168. doi: 10.1002/jnr.10275. - DOI - PubMed

Publication types

MeSH terms