Observational Study
. 2021 Jan 15;12(1):360.
doi: 10.1038/s41467-020-20583-5.

The human endogenous attentional control network includes a ventro-temporal cortical node

Affiliations
Observational Study

The human endogenous attentional control network includes a ventro-temporal cortical node

Ilaria Sani et al. Nat Commun. .

Abstract

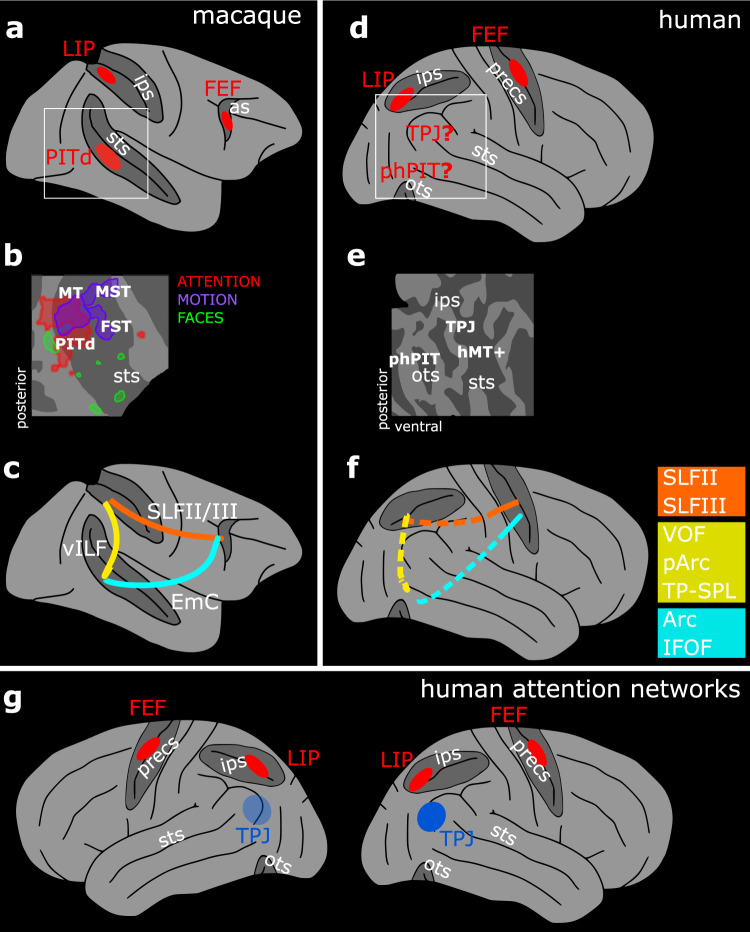
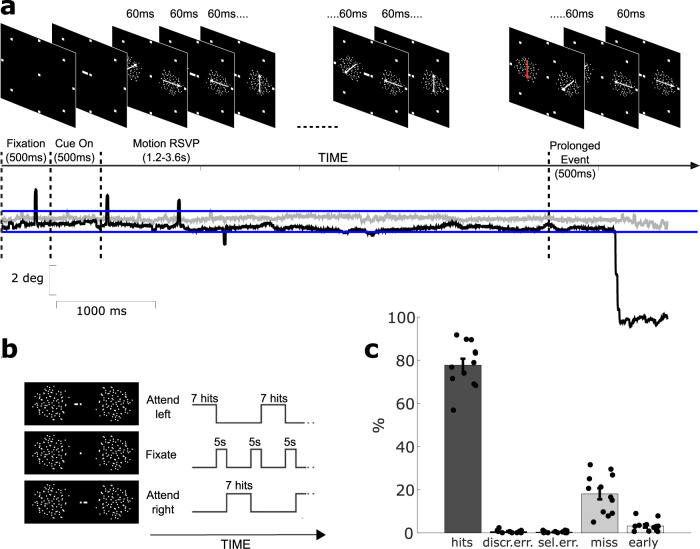
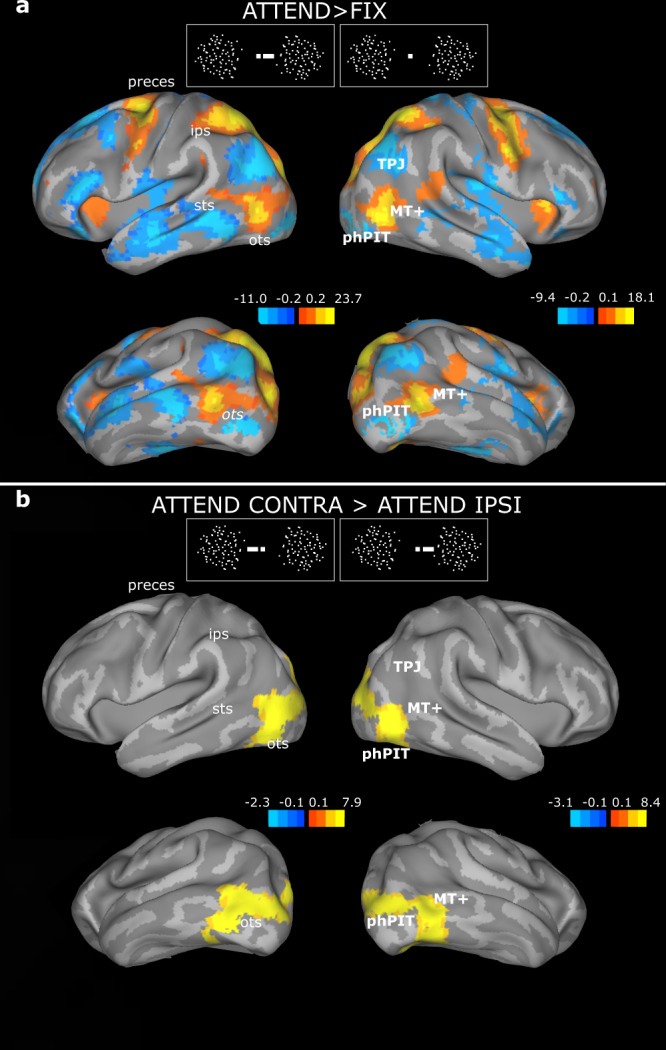
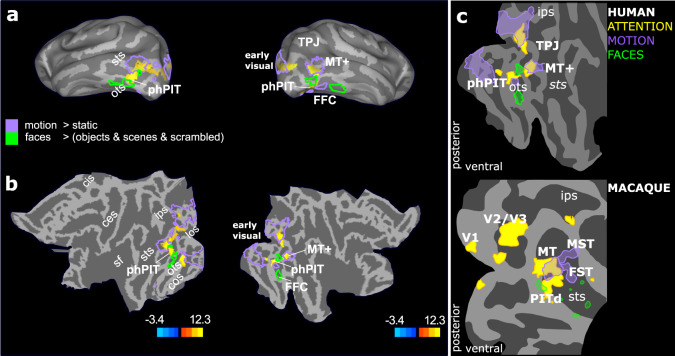
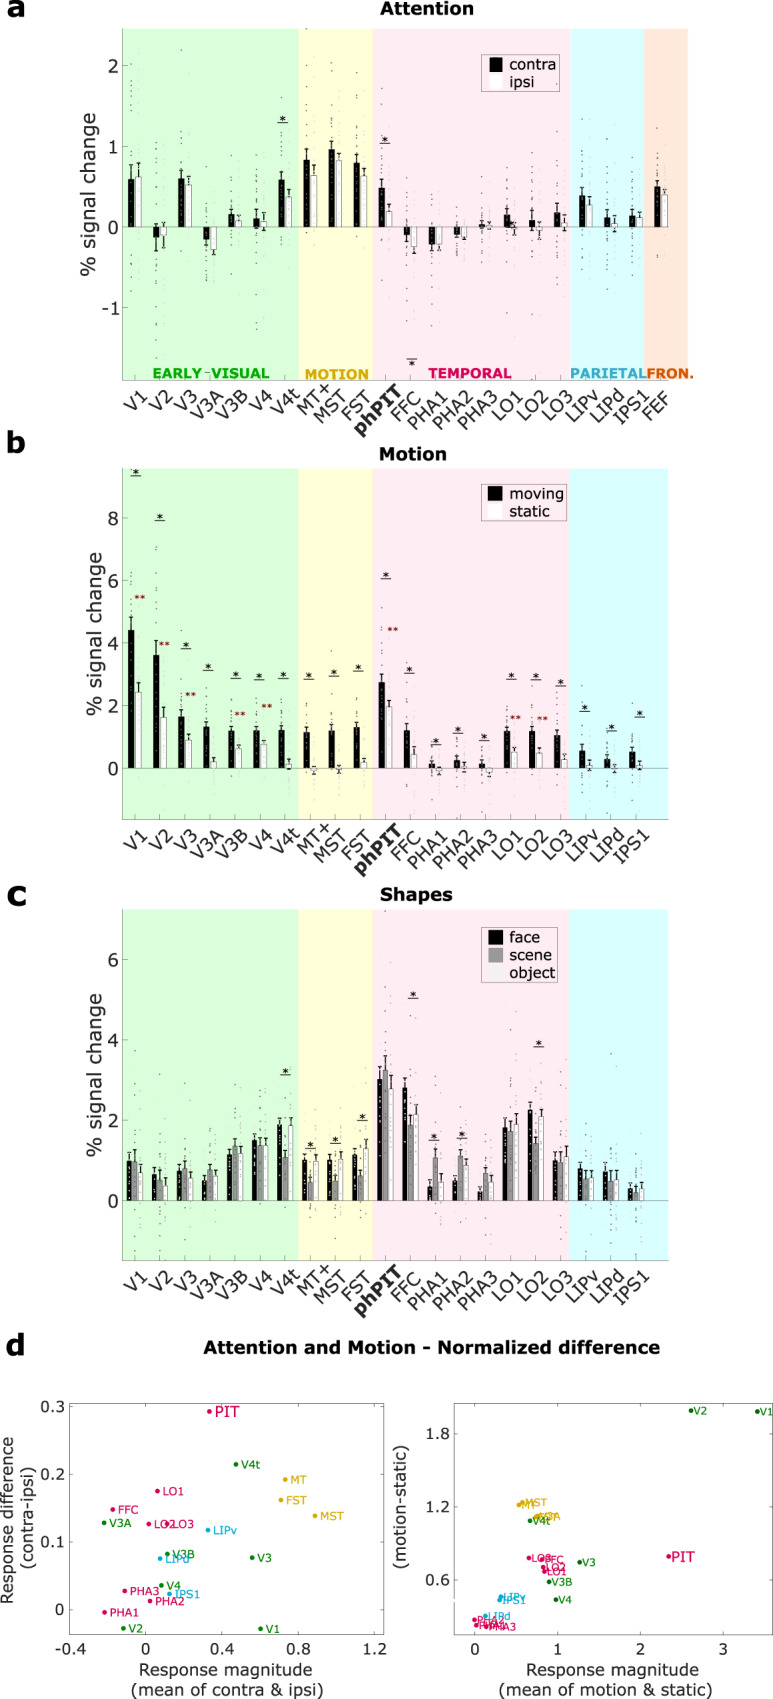
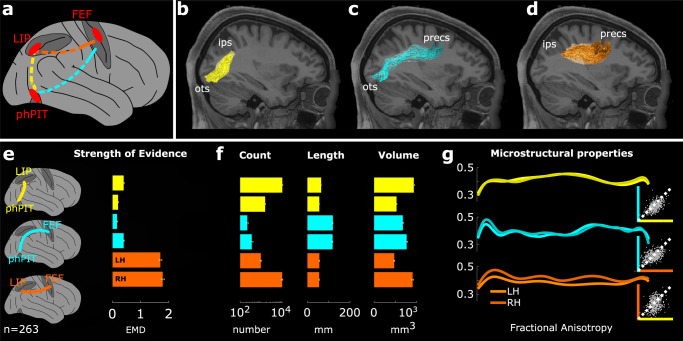
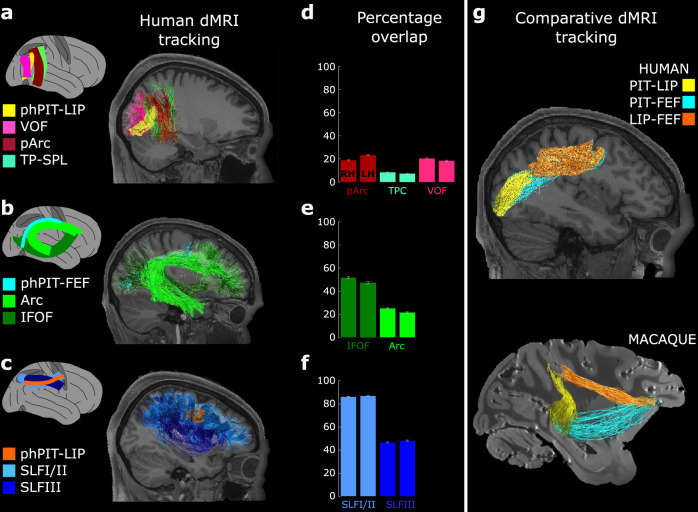
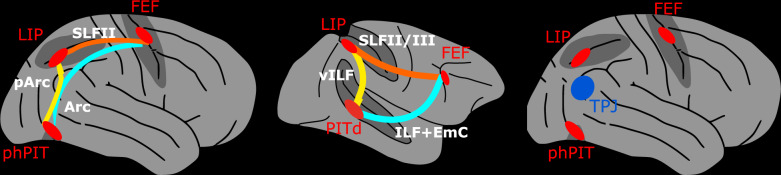
Endogenous attention is the cognitive function that selects the relevant pieces of sensory information to achieve goals and it is known to be controlled by dorsal fronto-parietal brain areas. Here we expand this notion by identifying a control attention area located in the temporal lobe. By combining a demanding behavioral paradigm with functional neuroimaging and diffusion tractography, we show that like fronto-parietal attentional areas, the human posterior inferotemporal cortex exhibits significant attentional modulatory activity. This area is functionally distinct from surrounding cortical areas, and is directly connected to parietal and frontal attentional regions. These results show that attentional control spans three cortical lobes and overarches large distances through fiber pathways that run orthogonally to the dominant anterior-posterior axes of sensory processing, thus suggesting a different organizing principle for cognitive control.


Conflict of interest statement

The authors declare no competing interests.

Figures

Fig. 1
Fig. 1. Functional and structural identification of the putative ventral endogenous attention node.
a Whole brain model of the three-node attention network of the macaque as defined by functional activation in ref. . b Functional characterization of the macaque ventral attention node and nearby areas displayed on a schematic flat map of the right superior temporal sulcus. PITd was activated by attention, but not by motion – the task relevant dimension. c Schematic of macaque PITd connections with the dorsal attention network as defined in ref. . d Whole brain model of the human fronto-parietal attention network and the two candidate areas possibly constituting a human ventral node for endogenous attention. e Schematic flat map of the human superior temporal sulcus and the quest for a functional characterization of parieto-temporal areas around phPIT and TPJ. f Schematic of the hypothesized connections between the putative ventral attention node and the dorsal attention network; colored squares indicate possible alternative hypothesis for the homolog fibers bundles in humans and macaques. g Schematic of the components of the endogenous (red) and exogenous (blue) attention network in the human brain; neuroimaging data suggest stronger activation in the right hemisphere for the latter (opaque vs. transparent blue). as arcuate sulcus, ips intraparietal sulcus, ots occipito-temporal sulcus, precs pre-central sulcus, sts superior temporal sulcus, FEF Frontal Eye Field, FST fundus of the superior temporal sulcus, LIP Lateral Intraparietal area, MT and MT+ middle temporal area, MST medial superior temporal area, PITd Posterior Infero-Temporal dorsal area, phPIT putative human Posterior Infero-Temporal area, TPJ temporo-parietal junction, Arc Arcuate Fasciculus, EmC Extreme Capsule, IFOF Inferior Frontal Occipital Fasciculus, ILF Inferior Longitudinal Fasciculus, pArc posterior Arcuate Fasciculus, SLF Superior Longitudinal Fasciculus, TP–SPL Temporo-Parietal connection to the Superior Temporal Lobule, vILF vertical branch of the Inferior Longitudinal Fasciculus, VOF Vertical Occipital Fasciculus.
Fig. 2
Fig. 2. Experimental design and behavioral performance.
a Example trial of the attentive motion discrimination task depicting critical task events. Top row shows display elements of the task; note that they are not drawn in scale (see Methods). Bottom row show an example eye trace corresponding to the trial on top: subjects were required to keep fixation until the prolonged motion event occurred (see also methods); black and gray solid traces represent x and y axes, respectively; dashed lines mark critical task events; blue lines show the tolerance window for eye movements (±1 deg. visual angle); spikes in the eye traces correspond to eye blinks and were not considered as breaks in fixation. b Schematic of the block design adopted during scanning. The experiment included three types of block: ‘Attend left’ and ‘Attend right’ where the task described in A was preformed; ‘Passive Fixation’ blocks where the trial structure was exactly the same as in the attention trials, but no attentional cue was displayed. Subjects alternated between paying attention to the right, passive fixation, and paying attention to the left. During the “right” and “left” blocks, subjects had to detect and discriminate a motion event at the cued location, while ignoring similar visual stimulation at the irrelevant location. During passive fixation blocks, the trial structure was the same as the attention blocks, but subjects were required to passively fixate the central spot while the moving stimuli were displayed. See also Methods. c Behavioral performance of human subjects. In each trial, of the 8 possible motion directions, one was chosen for the target, and a different one was chosen for the distractor. This resulted in five main behavioral outcomes: the subject could saccade into the motion direction displayed by the target (“hit”) or the direction of the distracter (“selection error”) or to 1 of 6 remaining targets (“discrimination error”); the subject could fail to respond to the prolonged event (“missed detection”) or respond before the prolonged event actually occurred (“early selection”). Data are expressed as mean across 12 subjects; gray points represent the values for each individual subject. Source data are provided as a Source Data file.
Fig. 3
Fig. 3. Attentive motion discrimination leads to distinct activations and inactivation in occipital, temporal, parietal, and frontal lobes.
a Statistical parametric maps of the contrast ‘attention (ATTEND) vs. fixation (FIX)’ overlaid on the lateral and inferior views of the inflated average human brain. The color-bar shows T-values task-related activations (yellow/red) and inactivation (blue). b Statistical parametric maps of the contrast ‘attend contralaterally (CONTRA) versus ipsilaterally (IPSI)’. Conventions as in A. One GLM analysis was performed for the whole brain. The contrasts attention Right > Left and Left > Right are shown in the left and right column, respectively, i.e., attention contralateral > ipsilateral. The color-bar shows T-values task-related activations; for visualization purposes, a slightly different threshold is displayed for the left and right hemisphere to highlight activation similarities; the full range of the color-bars is used; dark orange shades are only visible at the edges. sts superior temporal sulcus, ips intraparietal sulcus, as arcuate sulcus, ots occipito-temporal sulcus, MT+ middle temporal area, phPIT putative human Posterior Infero-Temporal area, TPJ temporo-parietal junction.
Fig. 4
Fig. 4. phPIT functional profile differs from nearby areas.
a Statistical parametric maps of the contrast ‘attend contralaterally versus ipsilaterally’ overlaid on the inferior views of the average human inflated brain. Conventions as in Fig. 3a, b. Solid lines show visual selectivity for motion (purple) and faces (green). b Statistical parametric maps of the contrast ‘attend contralaterally versus ipsilaterally’ overlaid on flat map of the left and right hemispheres; conventions as in panel A. The color-bar shows T-values task-related activations. c Schematic flat-map representations of activation patterns in humans (top) and macaques (bottom). ces central sulcus, cos collateral sulcus, ips intraparietal sulcus, los lateral occipital sulcus, ots occipito-temporal sulcus, sf Sylvian Fissure, sts superior temporal sulcus, FFC fusiform Face Area, FST fundus of the superior temporal sulcus, LIP Lateral Intraparietal area, MT and MT+ middle temporal area, MST medial superior temporal area, PITd Posterior Infero-Temporal dorsal area, phPIT putative human Posterior Infero-Temporal area, TPJ temporo-parietal junction, V1-2-3 visual areas 1-2-3.
Fig. 5
Fig. 5. Comparative functional profile of cortical ROIs in the occipital, temporal, parietal, and frontal lobes.
a Attentional modulation; the bar plot shows the average percentage signal change across subjects for each ROI, expressed as mean across 24 hemispheres; gray points represent the values for left and right hemispheres of each individual subject. Signal extracted during the attend contralateral (Attend contra) and the attend ipsilateral (Attend ipsi) condition are shown in black and gray, respectively. Black asterisks indicate a significantly stronger response differences for attended than for unattended condition (p < 0.05, one-sided paired t-test uncorrected for multiple comparisons; exact p-values are reported in Supplementary Table 2); b ROI responses to motion and static stimuli; bar plots show the average percentage signal change across subjects for each ROI in response to moving and static stimuli, expressed as mean across 20 hemispheres; gray points represent the values for each individual subject; red asterisks indicate a significant response for static stimuli p < 0.05, one-sided t-test uncorrected for multiple comparisons; exact p-values are reported in Supplementary Table 2; black asterisks indicate a significantly stronger response differences for moving than for static stimuli p < 0.05, one-sided paired t-test uncorrected for multiple comparisons; exact p-values are reported in Supplementary Table 2. c ROI responses to three shape categories; bar plots show the average percentage signal change across subjects for each ROI in response to faces-scenes-objects, expressed as mean across 18 hemispheres; gray points represent the values for each individual subject and hemispheres; black asterisks indicate significantly different responses for the three different stimulus categories (p < 0.05, one-way ANOVA uncorrected for multiple comparisons; exact p-values are reported in Supplementary Table 2). d Attention and motion modulation profiles of ROIs relative to mean activation. Scatter plots show activation differences (vertical axis) as a function of average activation (horizontal axis) during the attention task (left) and the motion localizer (right). The ratio of response difference and response magnitude defines the attention index. V1-2-3-3A-3B-4 visual areas 1-2-3-3A-3B-4, V4t visual area 4 transition, MT+ middle temporal area, MST medial superior temporal area, FST fundus of the superior temporal sulcus, phPIT putative human Posterior Infero-Temporal area, FFC fusiform Face Area, PH1-2-3 para-hippocampal area 1-2-3, LO1-2-3 lateral occipital areas 1-2-3, LIPv ventral latera intraparietal area, LIPd dorsal latera intraparietal area, IPS1 intra parietal sulcus 1, FEF frontal eye field. Source data are provided as a Source Data file.
Fig. 6
Fig. 6. Human dorso-ventral attentional connection identified using tractography.
a Schematic connections; phPIT–LIP: yellow trace; phPIT–FEF: cyan trace; LIP–FEF: orange trace. bd Sagittal-view of phPIT-to-LIP, phPIT-to-FEF, and LIP-to-FEF connections overlaid on T1 image for subject 101006. Conventions as in Fig. 1. e The bar plot shows the mean earth mover’s distance (EMD; see also Methods) in support of the existence of the tracts; lower bars for each tract represent the average across the right hemisphere, upper bars across the left. f Bar plots show the average streamline number, tract length (mm), tract volume (mm3) for functional tracts of 263 subjects; lower bars for each tract represent the average across the right hemisphere, upper bars across the left. g Microstructural properties of functional tracts as measured by fractional anisotropy (FA; see Methods). Each line represents the FA value averaged across subjects and calculated along the tract. Insets show direct comparison of individual subject FA between phPIT–LIP and phPIT–FEF connections (top), LIP–FEF and phPIT–FEF connections (middle), phPIT–LIP and LIP–FEF connections (bottom). Data are expressed as mean across 263 subjects, and separately for the two hemispheres; gray points represent the values for each individual subject. ips intra-parietal sulcus, ots occipito-temporal sulcus, sts superior temporal sulcus, preces pre-central sulcus, FEF frontal eye field, LIP lateral intra parietal area, phPIT putative human posterior infero-temporal area, LH left hemisphere, RH right hemisphere. Source data are provided as a Source Data file.
Fig. 7
Fig. 7. A sub-portion of pArc, Arc, and SLF support the endogenous attention network.
a Sagittal view of the VOF (pink), pArc (dark red), TP–SPL (green), and phPIT-to-LIP (yellow) connections of subject 101106. b Sagittal view of the Arc (light green), IFOF (dark green), and phPIT–FEF (cyan) connectivity of subject 101106. c Sagittal view of SLF (dark and light blue) and LIP–FEF (orange) connectivity of subject 101106. df Quantitative overlap, i.e., proportion of functionally defined attentional tracts overlapping with hypothesized anatomical pathways. Data are expressed as mean across 263 subjects; left bars for each tract represent the average across the left hemisphere, right bars across the right. g Sagittal view of the human and macaque showing the comparative anatomy of the dorso-ventral endogenous attention network as defined in ref. . FEF frontal eye field, LIP lateral intra parietal area, phPIT putative human posterior infero-temporal area, Arc Arcuate Fasciculus, IFOF Inferior Frontal Occipital Fasciculus, pArc posterior Arcuate Fasciculus, SLF Superior Longitudinal Fasciculus TP–SPL Temporo-Parietal connection to the Superior Temporal Lobule, VOF Vertical Occipital Fasciculus. Source data are provided as a Source Data file.
Fig. 8
Fig. 8. Human extended endogenous attention network.
Whole brain model and structural connectivity of the attention network as defined by functional activation (red areas) and structural connectivity in humans (leftmost panel) and macaques for comparison (middle panel). Colored solid lines represent connections and pathways between attention nodes phPIT, LIP, and FEF. The rightmost panel shows the spatial relationship between the extended endogenous attention network (red areas) and the TPJ, the most posterior node of the exogenous attention network (blue area). FEF Frontal Eye Field, LIP Lateral Intraparietal area, phPIT putative human Posterior Infero-Temporal area, Arc Arcuate Fasciculus, EmC Extreme Capsule, ILF Inferior Longitudinal Fasciculus, pArc posterior Arcuate Fasciculus, SLF Superior Longitudinal Fasciculus, vILF vertical branch of the Inferior Longitudinal Fasciculus.

References

    1. Goldstein, B., Chun, M. M. & Wolfe, J. M. “Visual attention” in Blackwell Handbook of Perception, (ed. Goldstein, B. E.) pp. 272–310 (Blackwell Publishers Ltd., Oxford, UK, 2001).
    1. Heilman KM, Valenstein E. Frontal lobe neglect in man. Neurology. 1972;22:660–664. - PubMed
    1. Heilman KM, Watson RT, Bower D, Valenstein E. Right hemisphere dominance for attention. Rev. Neurol. 1983;139:15–17. - PubMed
    1. Vallar G, Perani D. The anatomy of unilateral neglect after right-hemisphere stroke lesions. A clinical/CT-scan correlation study in man. Neuropsychologia. 1986;24:609–622. - PubMed
    1. Mort DJ, et al. The anatomy of visual neglect. Brain. 2003;126:1986–1997. - PubMed

Publication types

LinkOut - more resources