. 2021 Jan 15;12(1):381.
doi: 10.1038/s41467-020-20621-2.

High-pressure phase diagrams of FeSe1-xTex: correlation between suppressed nematicity and enhanced superconductivity

Affiliations

High-pressure phase diagrams of FeSe1-xTex: correlation between suppressed nematicity and enhanced superconductivity

K Mukasa et al. Nat Commun. .

Abstract

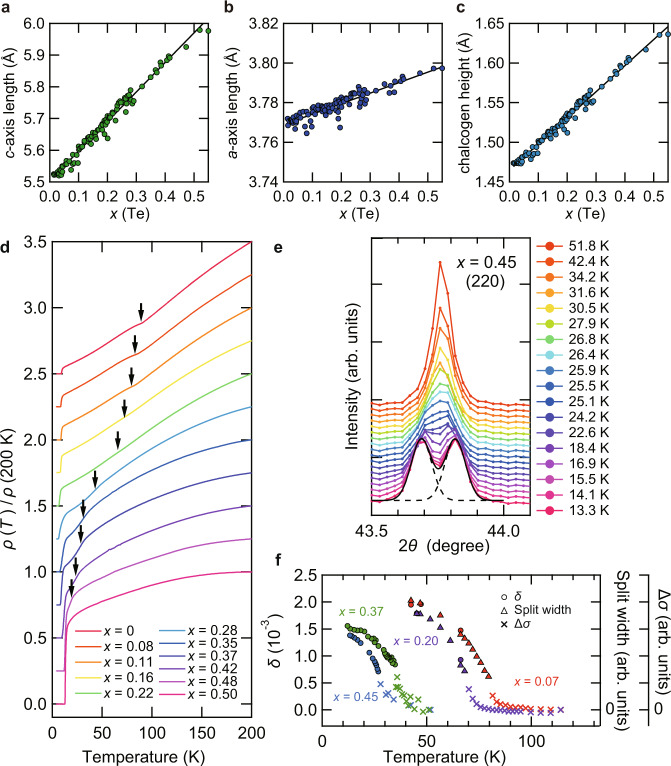
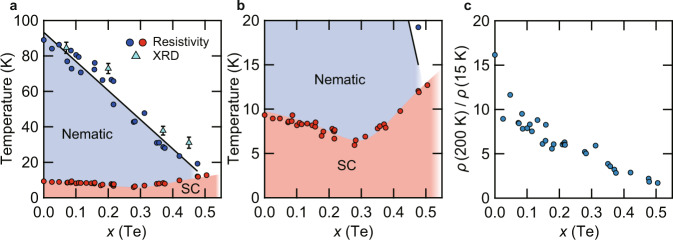
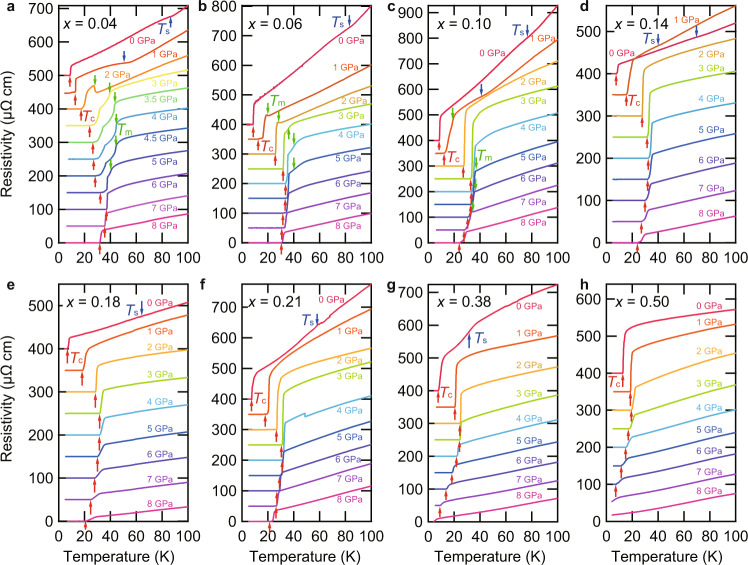
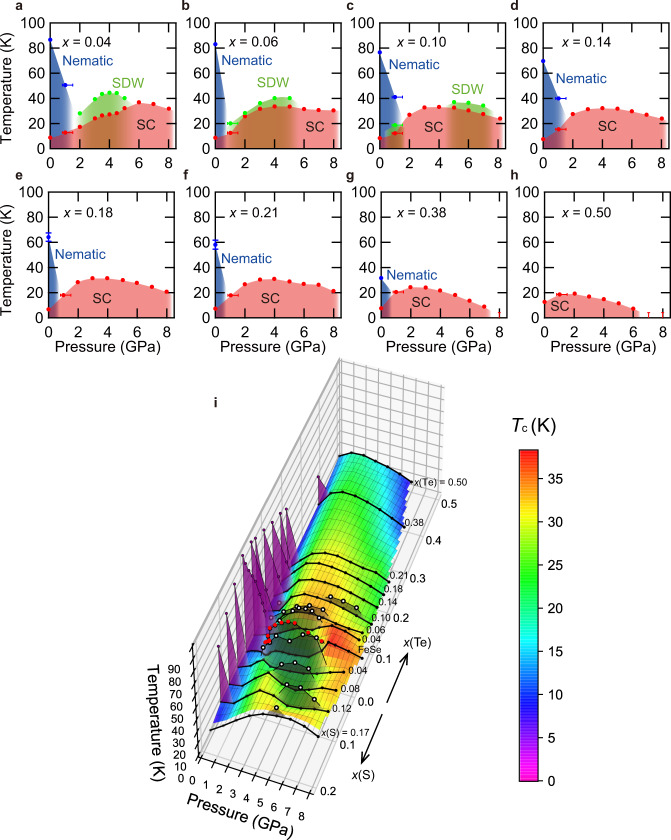
The interplay among magnetism, electronic nematicity, and superconductivity is the key issue in strongly correlated materials including iron-based, cuprate, and heavy-fermion superconductors. Magnetic fluctuations have been widely discussed as a pairing mechanism of unconventional superconductivity, but recent theory predicts that quantum fluctuations of nematic order may also promote high-temperature superconductivity. This has been studied in FeSe1-xSx superconductors exhibiting nonmagnetic nematic and pressure-induced antiferromagnetic orders, but its abrupt suppression of superconductivity at the nematic end point leaves the nematic-fluctuation driven superconductivity unconfirmed. Here we report on systematic studies of high-pressure phase diagrams up to 8 GPa in high-quality single crystals of FeSe1-xTex. When Te composition x(Te) becomes larger than 0.1, the high-pressure magnetic order disappears, whereas the pressure-induced superconducting dome near the nematic end point is continuously found up to x(Te) ≈ 0.5. In contrast to FeSe1-xSx, enhanced superconductivity in FeSe1-xTex does not correlate with magnetism but with the suppression of nematicity, highlighting the paramount role of nonmagnetic nematic fluctuations for high-temperature superconductivity in this system.


Conflict of interest statement

The authors declare no competing interests.

Figures

Fig. 1
Fig. 1. Evolution of structural parameters and resistivity with Te composition in single crystals of FeSe1−xTex at ambient pressure.
ac Lattice parameters and Te composition x(Te) determined by X-ray diffraction (XRD). Lattice constants c (a) and a (b) as well as the chalcogen height from the Fe plane (c) are shown as a function of x(Te). Solid line represents the linear x(Te) dependence (Vegard’s law). d Temperature dependence of the in-plane resistivity ρ normalized by the value at 200 K for 0 ≤ x(Te) ≲ 0.50. Each curve is shifted vertically for clarity. The resistive anomalies associated with the nematic transition temperature Ts (black arrows) are determined by the minimum (0 ≤ x(Te) ≲ 0.22) or the maximum (0.28 ≲ x(Te) ≲ 0.50) of the derivative curves dρ(T)/dT. e XRD intensity as a function of the scattering angle 2θ near the (220) Bragg peak measured at several temperatures for x ≈ 0.45. Each curve is shifted vertically for clarity. The black solid and dashed lines indicate the result of the two-peak fitting for the data at 13.3 K. f The orthorhombicity δ = (ao − bo)/(ao + bo) estimated from the two-peak fitting of (hk0) Bragg peaks for x(Te) ≈ 0.07, 0.20, 0.37, and 0.45 (circles, left axis) and the split width of (hkl) Bragg peaks for x(Te) ≈ 0.07 and 0.20 (triangles, right axis) as a function of temperature. We also plot additional width Δσ of single peak near the transition (crosses, right axis), estimated by the standard deviation σ of the single Gaussian fitting subtracted by the value at the maximum temperature measured for each sample.
Fig. 2
Fig. 2. Temperature versus Te composition phase diagram of FeSe1−xTex at ambient pressure.
a Nematic and superconducting transition temperatures as a function of x(Te). The blue and red circles represent the nematic (Ts) and superconducting (Tc) transition temperatures, respectively, determined by the resistivity measurements. The light blue triangles represent Ts, determined by the splitting of the Bragg peaks in the XRD measurements. The black line is a least squares x(Te)-linear fit to the Ts data from the resistivity measurements. The color shades for the nematic and superconducting (SC) states are the guides to the eyes. Error bars represent the uncertainty in determining Ts from the data in Fig. 1f. b The same as in a, but the temperature range is 0–20 K. c Dependence of ρ(200 K)/ρ(15 K) on x(Te) extracted from the resistivity data.
Fig. 3
Fig. 3. Evolution of the temperature dependence of resistivity with pressure.
Temperature dependence of resistivity in FeSe1−xTex below 100 K at different pressures up to 8 GPa for x(Te) ≈ 0.04 (a), 0.06 (b), 0.10 (c), 0.14 (d), 0.18 (e), 0.21 (f), 0.38 (g), and 0.50 (h). The data are vertically shifted for clarity. The resistive anomalies at transition temperatures Ts (blue), Tm (green), and Tc (red) are indicated by arrows.
Fig. 4
Fig. 4. Temperature–pressure phase diagrams in FeSe1−xTex.
Pressure dependence of Tc, Ts, and Tm indicated by red, blue, and green circles, respectively, for x(Te) ≈ 0.04 (a), 0.06 (b), 0.10 (c), 0.14 (d), 0.18 (e), 0.21 (f), 0.38 (g), and 0.50 (h). The color shades for the nematic, spin density wave (SDW), and superconducting (SC) states are the guides to the eyes. The error of pressure for P < 2 GPa is relatively large (see error bars for 1 GPa) compared to higher pressures. The errors of Ts are estimated from the least squares fit in Fig. 2a. i Three-dimensional electronic phase diagram, temperature versus pressure and Te concentration x(Te), of FeSe1−xTex, combined with the reported TPx(S) phase diagram of FeSe1−xSx (0 ≤ x(S) ≲ 0.17). The surface plot shows Tc and the purple and white circles represent Ts and Tm, respectively. The red circles represent Tm of FeSe. The gray and purple shadowed areas indicate the magnetic and nematic phases, respectively.

References

    1. Fradkin E, Kivelson SA, Lawler MJ, Eisenstein JP, Mackenzie AP. Nematic Fermi fluids in condensed matter physics. Annu. Rev. Condens. Matter Phys. 2010;1:153–178. doi: 10.1146/annurev-conmatphys-070909-103925. - DOI
    1. Sato Y, et al. Thermodynamic evidence for a nematic phase transition at the onset of the pseudogap in YBa2Cu3Oy. Nat. Phys. 2017;13:1074–1078. doi: 10.1038/nphys4205. - DOI
    1. Ishida K, et al. Divergent nematic susceptibility near the pseudogap critical point in a cuprate superconductor. J. Phys. Soc. Jpn. 2020;89:064707. doi: 10.7566/JPSJ.89.064707. - DOI
    1. Okazaki R, et al. Rotational symmetry breaking in the hidden-order phase of URu2Si2. Science. 2011;331:439–442. doi: 10.1126/science.1197358. - DOI - PubMed
    1. Ronning F, et al. Electronic in-plane symmetry breaking at field-tuned quantum criticality in CeRhIn5. Nature. 2017;548:313–317. doi: 10.1038/nature23315. - DOI - PubMed

LinkOut - more resources