. 2021 Jan 15;12(1):378.
doi: 10.1038/s41467-020-20699-8.

The challenges of containing SARS-CoV-2 via test-trace-and-isolate

Affiliations

The challenges of containing SARS-CoV-2 via test-trace-and-isolate

Sebastian Contreras et al. Nat Commun. .

Abstract

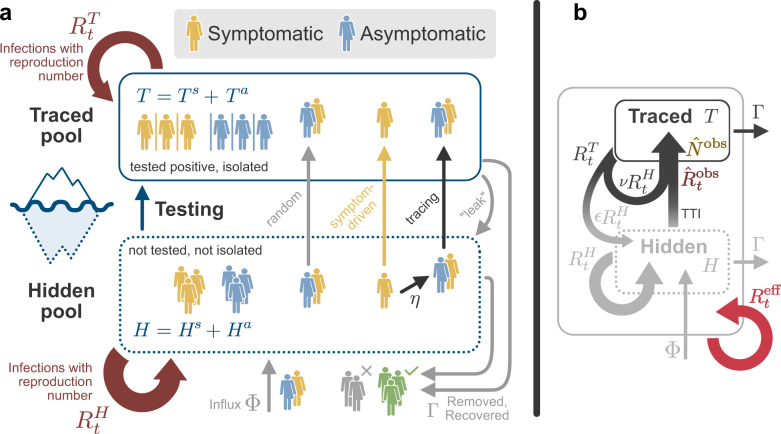
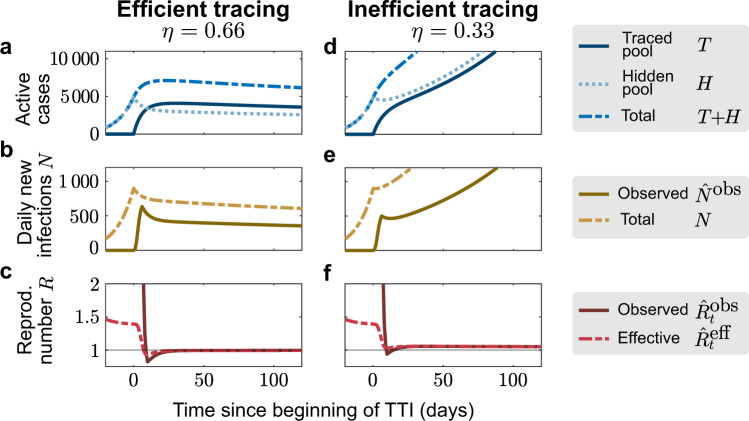
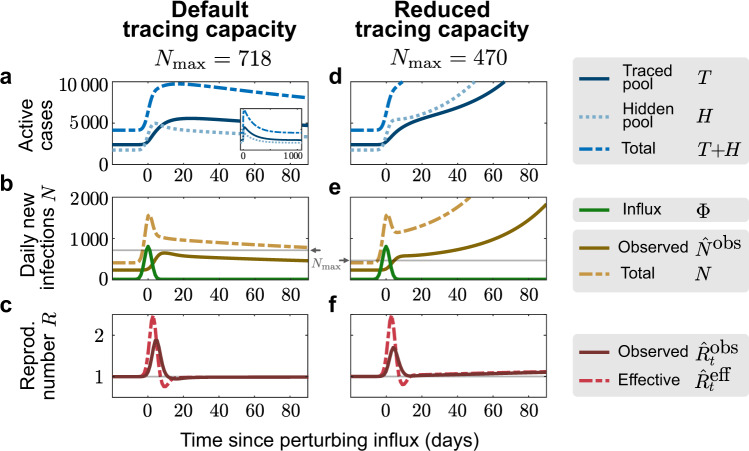
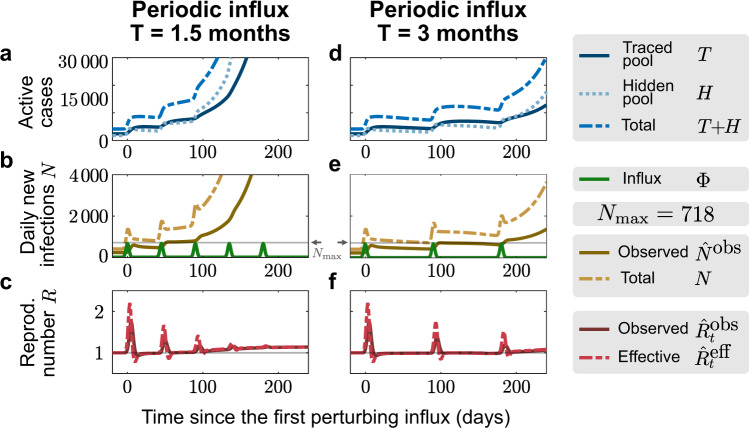
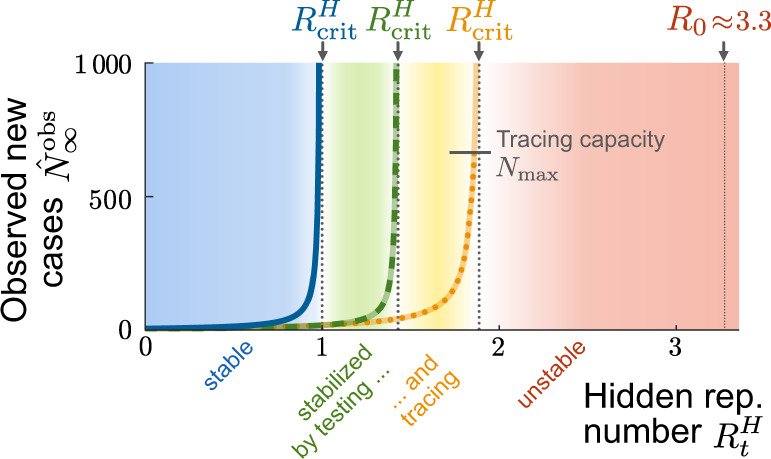
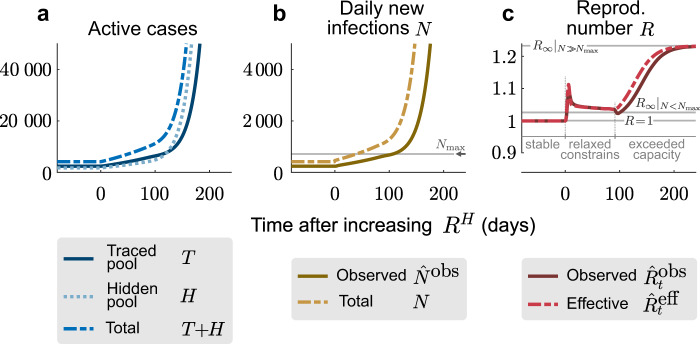
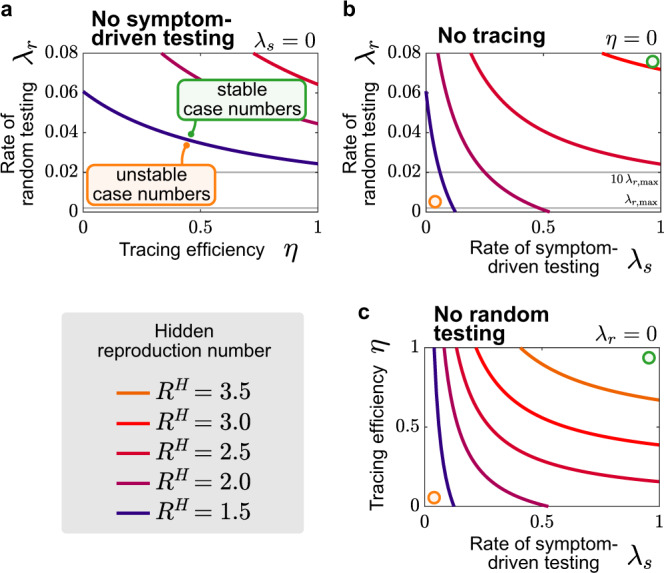
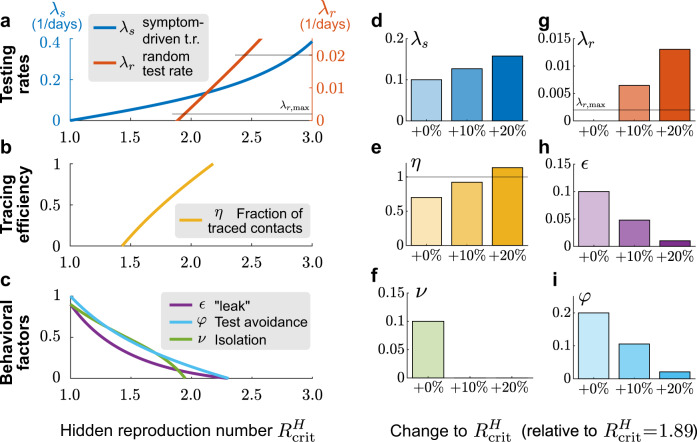
Without a cure, vaccine, or proven long-term immunity against SARS-CoV-2, test-trace-and-isolate (TTI) strategies present a promising tool to contain its spread. For any TTI strategy, however, mitigation is challenged by pre- and asymptomatic transmission, TTI-avoiders, and undetected spreaders, which strongly contribute to "hidden" infection chains. Here, we study a semi-analytical model and identify two tipping points between controlled and uncontrolled spread: (1) the behavior-driven reproduction number [Formula: see text] of the hidden chains becomes too large to be compensated by the TTI capabilities, and (2) the number of new infections exceeds the tracing capacity. Both trigger a self-accelerating spread. We investigate how these tipping points depend on challenges like limited cooperation, missing contacts, and imperfect isolation. Our results suggest that TTI alone is insufficient to contain an otherwise unhindered spread of SARS-CoV-2, implying that complementary measures like social distancing and improved hygiene remain necessary.


Conflict of interest statement

The authors declare no competing interests.

Figures

Fig. 1
Fig. 1. Illustration of interactions between the hidden H and traced T pools in our model.
a In our model, we distinguish two different infected population groups: the one that contains the infected individuals that remain undetected until tested (hidden pool H), and the one with infected individuals that we already follow and isolate (traced pool T). Super indexes s and a in both variables account for symptomatic and asymptomatic individuals. Until noticed, an outbreak will fully occur in the hidden pool, where case numbers increase according to this pool’s reproduction number RtH. Testing and tracing of hidden infections transfers them to the traced pool and helps to empty the hidden pool; this prevents offspring infections and reduces the overall growth of the outbreak. Due to the self-isolation imposed in the traced pool, its reproduction number RtT is expected to be considerably smaller than RtH, and typically smaller than 1. Once an individual is tested positive, all the contacts since the infection are traced with some efficiency (η). Two external events further increase the number of infections in the hidden pool, namely, the new contagions occurring in the traced pool that leak to the hidden pool and an influx of externally acquired infections (Φ). In the absence of new infections, pool sizes are naturally reduced due to recovery (or removal), proportional to the recovery rate Γ. b Simplified depiction of the model showing the interactions of the two pools. New infections generated in the traced pool can remain there (ν) or leak to the hidden pool (ϵ). Note that the central epidemiological observables are highlighted in color: The N^obs (brown) and R^tobs (dark red) can be inferred from the traced pool, but the effective reproduction number R^teff (light red) that governs the stability of the whole system remains hidden.
Fig. 2
Fig. 2. Sufficient testing and contact tracing can control the disease spread, while insufficient TTI only slows it.
We consider a test-trace-and-isolate (TTI) strategy with symptom-driven testing (λs = 0.1) and two tracing scenarios: For high tracing efficiency (η = 0.66, ac), the outbreak can be controlled by TTI; for low tracing efficiency (η = 0.33, d, e) the outbreak cannot be controlled because tracing is not efficient enough. a, d The number of infections in the hidden pool grows until the outbreak is noticed on day 0, at which point symptom-driven testing (λs = 0.1) and contact tracing (η) starts. b, e The absolute number of daily infections (N) grows until the outbreak is noticed on day 0; the observed number of daily infections (N^obs) shown here is simulated as being inferred from the traced pool and subject to a gamma-distributed reporting delay with a median of 4 days. c, f The observed reproduction number (R^tobs) is estimated from the observed new infections (N^obs), while the effective reproductive number (R^teff) is estimated from the total daily new infections (N). After an initial growth period, it settles to R^tobs=1 if the outbreak is controlled (efficient tracing), or to R^tobs>1 if the outbreak continues to spread (inefficient tracing). All the curves plotted are obtained from numerical integration of Eqs. (1)–(5).
Fig. 3
Fig. 3. Finite tracing capacity makes the system vulnerable to large influx events.
A single large influx event (a total of 4000 hidden cases with 92% occurring in the 7 days around t = 0, normally distributed with standard deviation σ = 2 days) drives a metastable system with reduced tracing capacity (reached at Nmax=470) to a new outbreak (df), whereas a metastable system with our default tracing capacity (reached at Nmax=718) can compensate a sudden influx of this size (ac). a, d The number of infections in the hidden pool (dotted) jump due to the influx event at t = 0, and return to stability for default capacity (a) or continue to grow in the system with reduced capacity (d). Correspondingly, the number of cases in the traced pool (solid line) either slowly increases after the event and absorbs most infections before returning to stability (inset in a, time axis prolonged to 1000 days), or proceeds to grow steeply (d). b, e The absolute number of new infections (dashed, yellow) jumps due to the large influx event (solid green line). The number of daily observed cases (solid brown line) slowly increases after the event, and relaxes back to baseline (a), or increases fast upon exceeding the maximum number of new observed cases Nmax (solid gray line) for which tracing is effective. c, f The effective (dashed red line) and observed (solid dark red line) reproduction numbers change transiently due to the influx event before returning to 1 for the default tracing capacity. In the case of a reduced tracing capacity and a new outbreak, they slowly begin to grow afterward (f). All the curves plotted are obtained from numerical integration of Eqs. (1)–(5).
Fig. 4
Fig. 4. Manageable influx events that recur periodically can overwhelm the tracing capacity.
For the default capacity scenario, we explore whether periodic influx events can overwhelm the tracing capacity: A ‘manageable" influx that would not overwhelm the tracing capacity on its own (3331 externally acquired infections, 92% of which occur in 7 days) repeats every 1.5 months (ac) or every 3 months (df). In the first case, the system is already unstable after the second event because case numbers remained high after the first influx (b). In the second case, the system remains stable after both the first and second event (e), but it becomes unstable after the third (f).
Fig. 5
Fig. 5. Testing and tracing give rise to two TTI-stabilized regimes of spreading dynamics.
In addition to the intrinsically stable regime of the simple SIR model (blue region), our model exhibits two TTI-stabilized regimes that arise from the isolation of formerly “hidden” infected individuals uncovered through symptom-based testing alone (green region) or additional contact tracing (amber region). Due to the external influx, the number of observed new cases reaches a nonzero equilibrium N^obs that depends on the hidden reproductive number (colored lines). These equilibrium numbers of new cases diverge when approaching the respective critical hidden reproductive numbers (RcritH) calculated from linear stability analysis (dotted horizontal lines). Taking into account a finite tracing capacity Nmax shrinks the testing-and-tracing stabilized regime and makes it metastable (dotted amber line). Note that, for our standard parameter set, the natural base reproduction number R0 lies in the unstable regime. Please see Supplementary Fig. 5 for a full phase diagram and Supplementary Note 1 for the linear stability analysis.
Fig. 6
Fig. 6. A relaxation of restrictions can slowly overwhelm the finite tracing capacity and trigger a new outbreak.
a At t = 0, the hidden reproduction number increases from RtH=1.8 to RtH=2.0 (i.e., slightly above its critical value). This leads to a slow increase in traced active cases (solid blue line). b When the number of observed new cases (solid brown line) exceeds the tracing capacity limit Nmax (solid gray line), the tracing system breaks down, and the outbreak starts to accelerate. c After an initial transient at the onset of the change in RtH, the observed reproduction number (solid red line) faithfully reflects both the slight increase of the hidden reproduction number due to relaxation of contact constraints, and the strong increase after the tracing capacity (solid gray line) is exceeded at t ≈ 100. In both cases, the observed reproduction number R^tobs approaches two different limit values R, which are derived from a linear stability analysis (further details in Supplementary Fig. 5). All the curves plotted are obtained from numerical integration of Eqs. (1)–(5).
Fig. 7
Fig. 7. Symptom-driven testing and contact tracing need to be combined to control the disease.
Stability diagrams showing the boundaries (continuous curves) between the stable (controlled) and uncontrolled regimes for different testing strategies combining random testing (rate λr), symptom-driven testing (rate λs), and tracing (efficiency η). Gray lines in plots with λr-axes indicate capacity limits (for our example Germany) on random testing (λr,max) and when using pooling of ten samples, i.e., 10λr,max. Colored lines depict the transitions between the stable and the unstable regime for a given reproduction number RtH (color-coded). The transition from ‘stable" to ‘unstable" case numbers is explicitly annotated for RtH=1.5 in panel a. a Combining tracing and random testing without symptom-driven testing is in all cases not sufficient to control outbreaks, as the necessary random tests exceed even the pooled testing capacity (10λr,max). b Combining random and symptom-driven testing strategies without any contract tracing requires unrealistically high levels of random testing to control outbreaks with large reproduction numbers in the hidden pool (RtH>2.0). The required random tests to significantly change the stability boundaries exceed the available capacity in Germany λr,max. Even considering the possibility of pooling tests (10λr,max) often does not suffice to control outbreaks. c Combining symptom-driven testing and tracing suffices to control outbreaks with realistic testing rates λs and tracing efficiencies η for moderate values of reproduction numbers in the hidden pool, RtH, but fails to control the outbreak for large RtH. The curves showing the critical reproduction number are obtained from the linear stability analysis (Supplementary Eq. (1)).
Fig. 8
Fig. 8. Adapting testing strategies allows the relaxation of contact constraints to some degree.
The relaxation of contact constraints increases the reproduction number of the hidden pool RtH, and thus needs to be compensated by adjusting model parameters to keep the system stable. ac Value of a single parameter required to keep the system stable despite a change in the hidden reproduction number, while keeping all other parameters at default values. a Increasing the rate of symptom-driven testing (λs, blue) can in principle compensate for hidden reproduction numbers close to R0. However, this is optimistic as it requires that anyone with symptoms compatible with COVID-19 gets tested and isolated on average within 2.5 days—requiring extensive resources and efficient organization. Increasing the random-testing rate (λr, red) to the capacity limit (for the example Germany, gray line λr,max) would have almost no effect, pooling tests to achieve 10λr,max can compensate partly for larger increases in RtH. b Increasing the tracing efficiency (η) can compensate only small increases in RtH. c Decreasing the fraction of symptomatic individuals who avoid testing (φ), the leak from the traced pool (ϵ) or the escape rate from isolation (ν) can in principle compensate for small increases in RtH. di To compensate a 10% or 20% increase of RtH, while still keeping the system stable, symptom-driven testing (λs) could be increased (d), or ϵ or φ could be decreased (h,i). In contrast, only changing λr, η, or ν would not be sufficient to compensate a 10 % or 20 % increase in RtH, because the respective limits are reached (e, f, g). All parameter changes are computed through stability analysis (Supplementary Eq. (1)).

Similar articles

Cited by

  • A novel, scenario-based approach to comparing non-pharmaceutical intervention strategies across nations.
    Calabrese JM, Schüler L, Fu X, Gawel E, Zozmann H, Bumberger J, Quaas M, Wolf G, Attinger S. Calabrese JM, et al. J R Soc Interface. 2024 Sep;21(218):20240301. doi: 10.1098/rsif.2024.0301. Epub 2024 Sep 11. J R Soc Interface. 2024. PMID: 39257281 Free PMC article.
  • Impact of the Euro 2020 championship on the spread of COVID-19.
    Dehning J, Mohr SB, Contreras S, Dönges P, Iftekhar EN, Schulz O, Bechtle P, Priesemann V. Dehning J, et al. Nat Commun. 2023 Jan 18;14(1):122. doi: 10.1038/s41467-022-35512-x. Nat Commun. 2023. PMID: 36653337 Free PMC article.
  • Data-driven prediction of COVID-19 cases in Germany for decision making.
    Refisch L, Lorenz F, Riedlinger T, Taubenböck H, Fischer M, Grabenhenrich L, Wolkewitz M, Binder H, Kreutz C. Refisch L, et al. BMC Med Res Methodol. 2022 Apr 20;22(1):116. doi: 10.1186/s12874-022-01579-9. BMC Med Res Methodol. 2022. PMID: 35443607 Free PMC article.
  • A look into the future of the COVID-19 pandemic in Europe: an expert consultation.
    Iftekhar EN, Priesemann V, Balling R, Bauer S, Beutels P, Calero Valdez A, Cuschieri S, Czypionka T, Dumpis U, Glaab E, Grill E, Hanson C, Hotulainen P, Klimek P, Kretzschmar M, Krüger T, Krutzinna J, Low N, Machado H, Martins C, McKee M, Mohr SB, Nassehi A, Perc M, Petelos E, Pickersgill M, Prainsack B, Rocklöv J, Schernhammer E, Staines A, Szczurek E, Tsiodras S, Van Gucht S, Willeit P. Iftekhar EN, et al. Lancet Reg Health Eur. 2021 Sep;8:100185. doi: 10.1016/j.lanepe.2021.100185. Epub 2021 Jul 30. Lancet Reg Health Eur. 2021. PMID: 34345876 Free PMC article. Review.
  • The benefits, costs and feasibility of a low incidence COVID-19 strategy.
    Czypionka T, Iftekhar EN, Prainsack B, Priesemann V, Bauer S, Calero Valdez A, Cuschieri S, Glaab E, Grill E, Krutzinna J, Lionis C, Machado H, Martins C, Pavlakis GN, Perc M, Petelos E, Pickersgill M, Skupin A, Schernhammer E, Szczurek E, Tsiodras S, Willeit P, Wilmes P. Czypionka T, et al. Lancet Reg Health Eur. 2022 Feb;13:100294. doi: 10.1016/j.lanepe.2021.100294. Epub 2022 Jan 2. Lancet Reg Health Eur. 2022. PMID: 35005678 Free PMC article. Review.

References

    1. Brauner, J. M. et al. Inferring the effectiveness of government interventions against COVID-19. Science10.1126/science.abd9338 (2020). - PMC - PubMed
    1. Dehning J, et al. Inferring change points in the spread of COVID-19 reveals the effectiveness of interventions. Science. 2020;369:1–10. doi: 10.1126/science.abb9789. - DOI - PMC - PubMed
    1. Salathé M, et al. COVID-19 epidemic in Switzerland: on the importance of testing, contact tracing and isolation. Swiss Med. Weekly. 2020;150:w20225. - PubMed
    1. Kucharski, A. J. et al. Effectiveness of isolation, testing, contact tracing, and physical distancing on reducing transmission of SARS-CoV-2 in different settings: a mathematical modelling study. Lancet Infect. Dis. https://www.thelancet.com/journals/laninf/article/PIIS1473-3099(20)30457... (2020). - PMC - PubMed
    1. Ruktanonchai, N. W. et al. Assessing the impact of coordinated COVID-19 exit strategies across Europe. Science369, 1465–1470 (2020). - PMC - PubMed

Publication types