. 2021 Jan 15;11(1):1536.
doi: 10.1038/s41598-020-79477-7.

Elucidating different pattern of immunoregulation in BALB/c and C57BL/6 mice and their F1 progeny

Affiliations

Elucidating different pattern of immunoregulation in BALB/c and C57BL/6 mice and their F1 progeny

Wiebke Hartmann et al. Sci Rep. .

Abstract

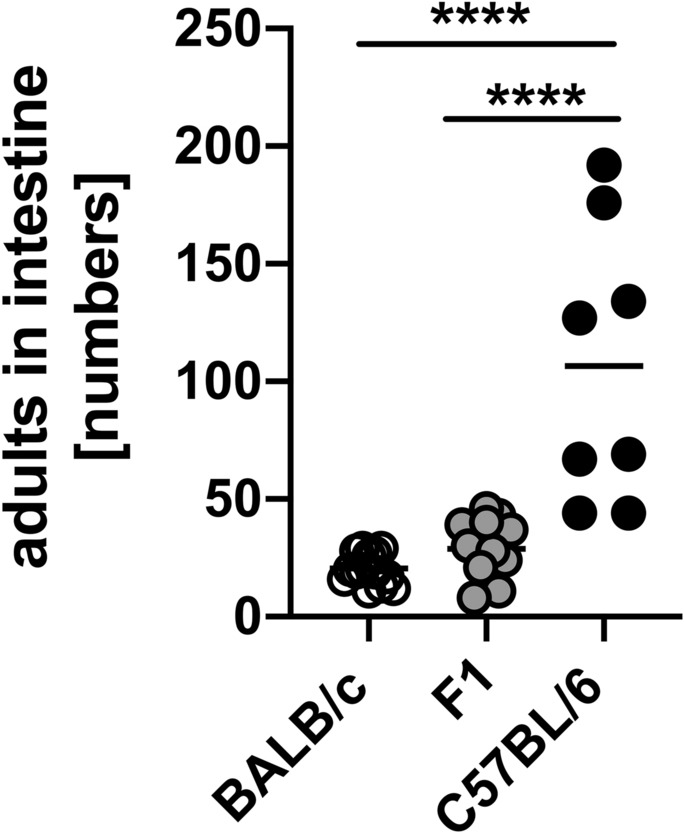
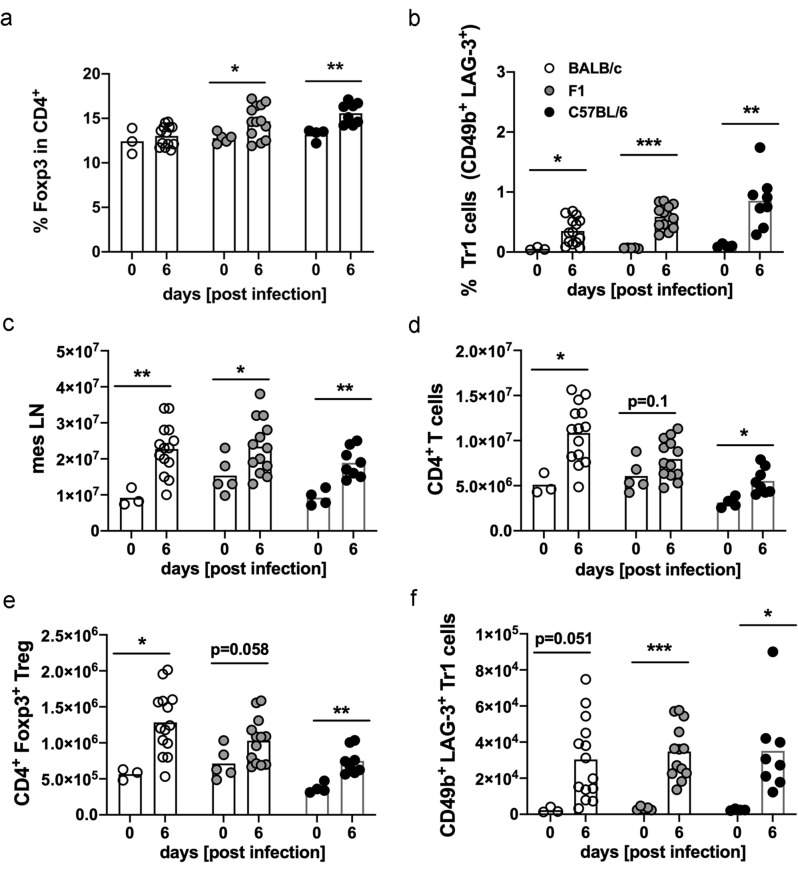
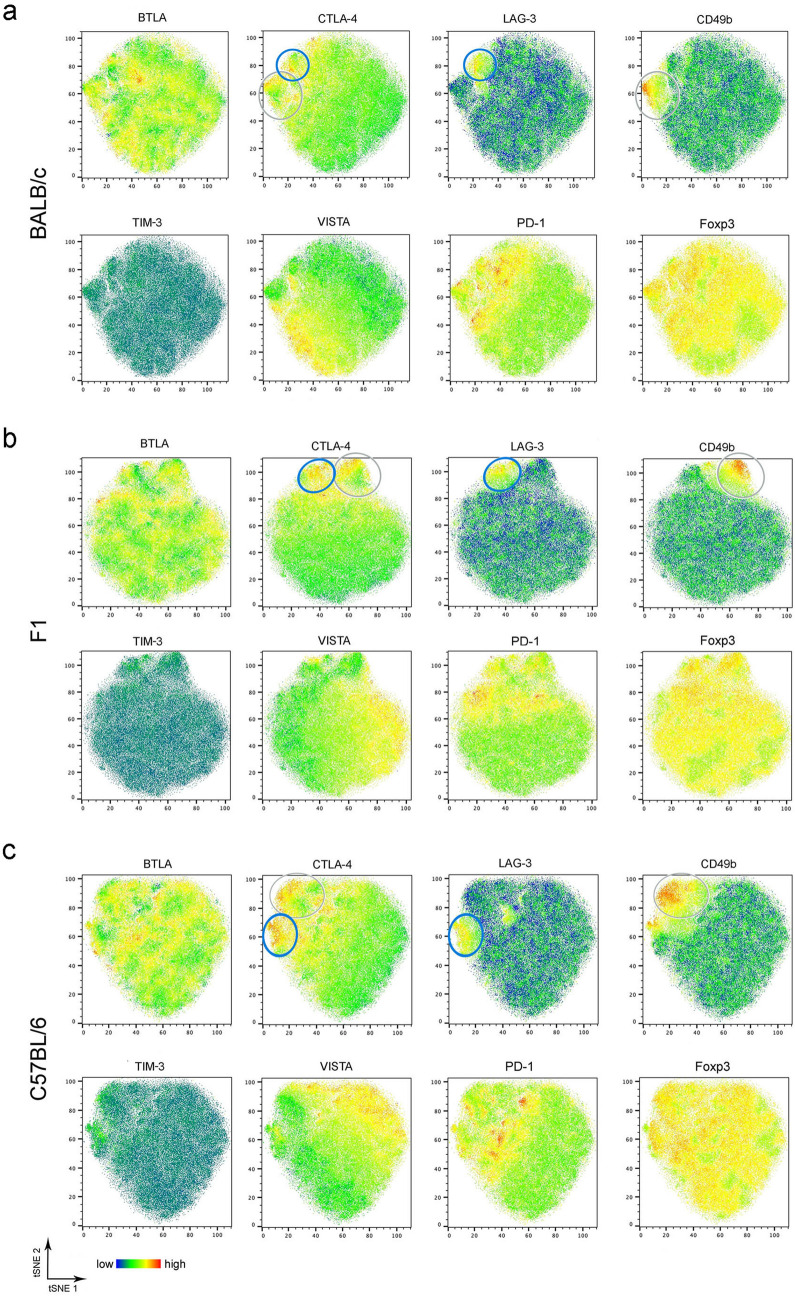
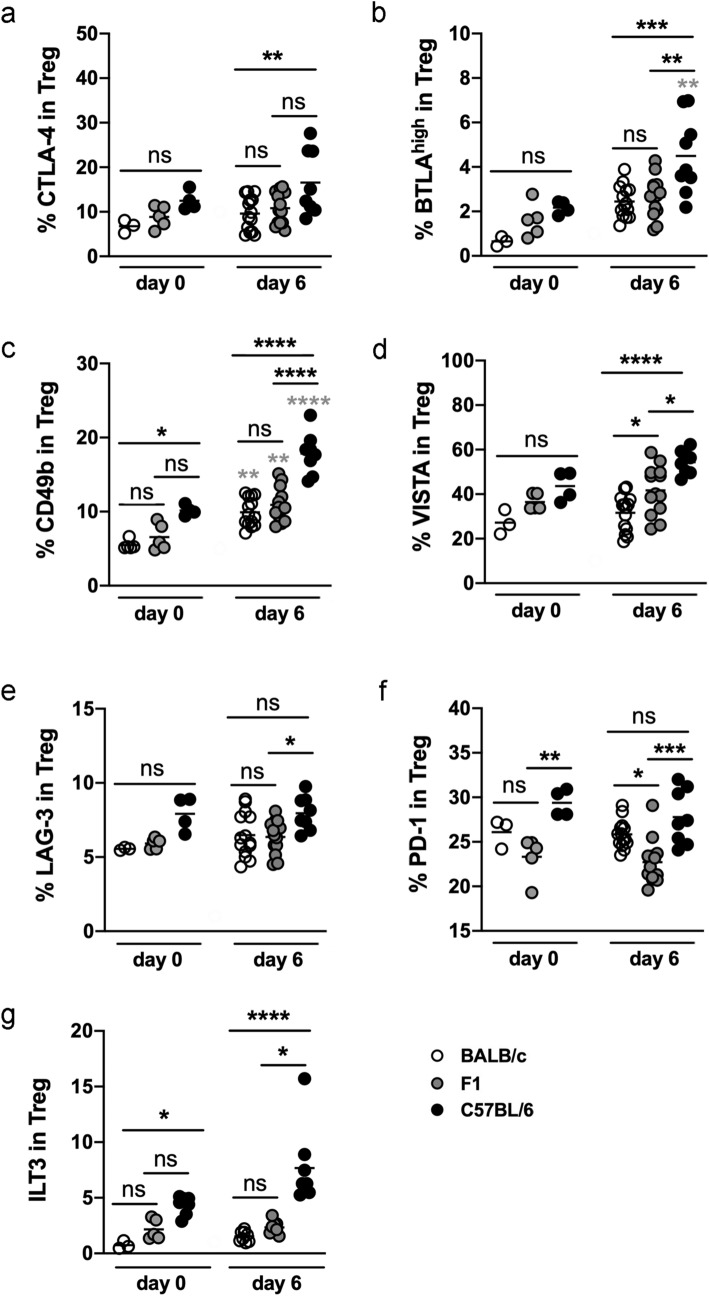
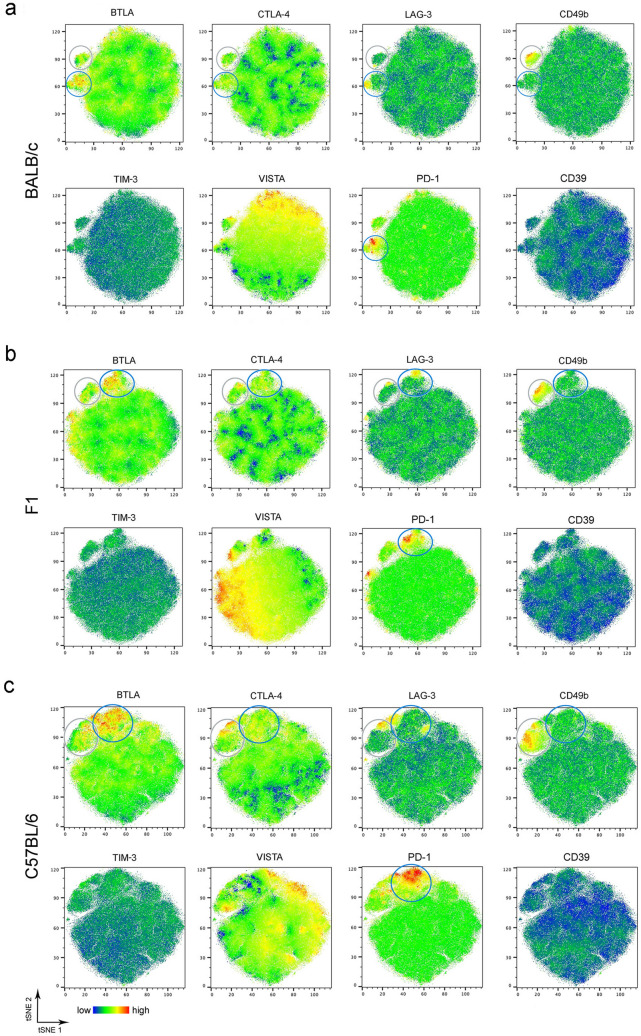
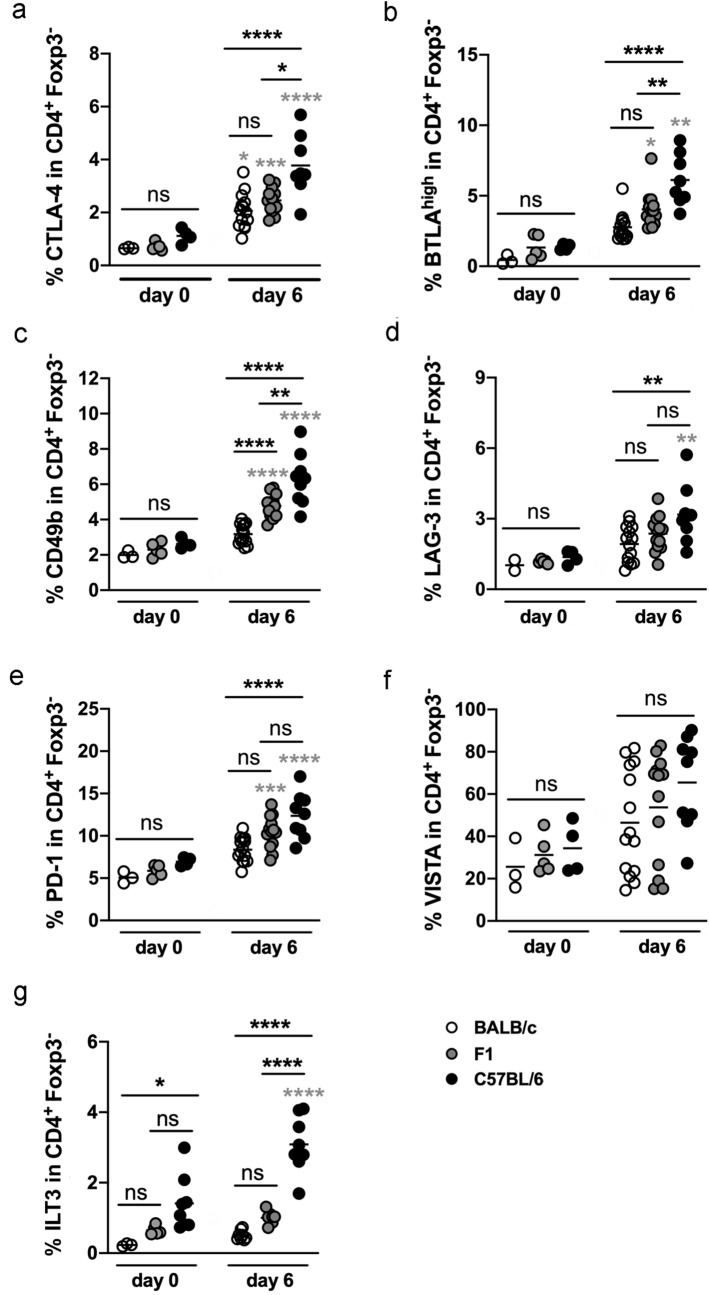
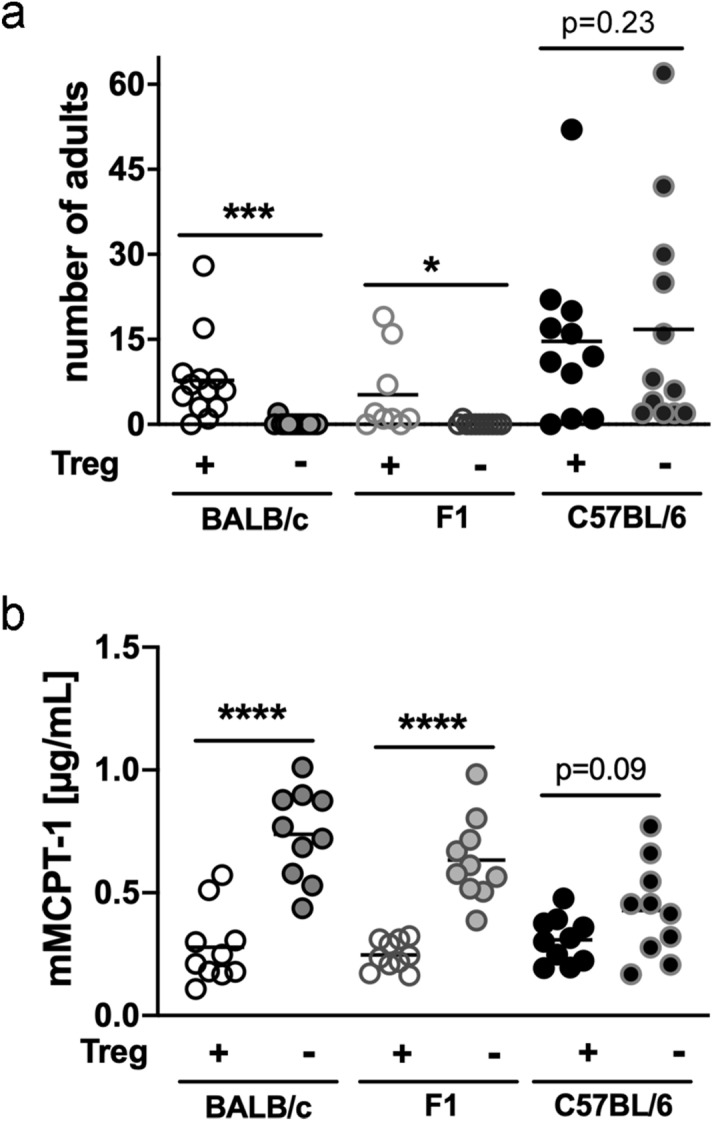
Helminths are large multicellular parasites that infect one quarter of the human population. To prolong their survival, helminths suppress the immune responses of their hosts. Strongyloides ratti delays its expulsion from the gut by induction of regulatory circuits in a mouse strain-specific manner: depletion of Foxp3+ regulatory T cells (Treg) improves the anti-S. ratti immunity in BALB/c but not in C57BL/6 mice. In the current study we compare the hierarchy of immunoregulatory pathways in BALB/c, C57BL/6 mice and their F1 progeny (BALB/c × C57BL/6). Using multicolor flow cytometry, we show that S. ratti induces a distinct pattern of inhibitory checkpoint receptors by Foxp3+ Treg and Foxp3- T cells. Intensity of expression was highest in C57BL/6 and lowest in BALB/c mice, while the F1 cross had an intermediate phenotype or resembled BALB/c mice. Treg subsets expanded during infection in all three mouse strains. Similar to BALB/c mice, depletion of Treg reduced intestinal parasite burden and increased mucosal mast cell activation in S. ratti-infected F1 mice. Our data indicate that Treg dominate the regulation of immune responses in BALB/c and F1 mice, while multiple regulatory layers exist in C57BL/6 mice that may compensate for the absence of Treg.


Conflict of interest statement

The authors declare no competing interests.

Figures

Figure 1
Figure 1
F1 mice have lower numbers of adults in the intestine than C57BL/6 mice. BALB/c, F1 and C57BL/6 mice were infected with 2000 iL3 s.c. in the footpad. Parasitic adults in the small intestine were counted at day 6 p.i. Shown are combined results from 2–3 experiments (BALB/c: n = 14 mice, F1: n = 13 mice and C57BL/6: n = 8 mice). Each symbol represents the worm burden from a single mouse. Horizontal lines represent the mean. Data were analyzed by 1-way ANOVA with Tukey's multiple comparisons test. Asterisks indicate significant differences of the mean (****p ≤ 0.0001).
Figure 2
Figure 2
Treg and Tr1 cells increase during infection with S. ratti. BALB/c, F1 and C57BL/6 mice were left naïve (day 0) or infected with 2000 iL3. Six days later mes LN were isolated and stained with a panel for regulatory receptors. Frequencies of (a) Foxp3+ cells in CD4+ T cells and (b) Tr1 cells in Foxp3 CD4+ T cells are shown. Numbers of mes LN (c), CD4+ T cells (d), Foxp3+ Treg (e), and CD49b+ LAG-3+ Tr1 cells (f). Each symbol represents values from a single mouse. Shown are combined results from 2–3 experiments (BALB/c day 0 p.i.: n = 3, day 6 p.i.: n = 14; F1 day 0 p.i.: n = 5, day 6 p.i.: n = 13; C57BL/6 day 0 p.i.: n = 4 mice, day 6 p.i.: n = 8). Data were analyzed by an unpaired t-test. Asterisks indicate significant differences of the mean (*p ≤ 0.05, **p ≤ 0.005, ***p ≤ 0.001).
Figure 3
Figure 3
Similar expression pattern of regulatory markers by Treg from BALB/c, F1 and C57BL/6 mice. BALB/c, F1 and C57BL/6 mice were infected with 2000 iL3. Six days later mes LN were isolated and stained with a panel for regulatory receptors. t-SNE calculation was performed with 40,000 Foxp3+ CD4+ Treg using FlowJo Plugins. Representative t-SNE heatmaps derived from Treg from BALB/c (a), F1 (b) and C57BL/6 (c) showing the expression of BTLA, CTLA-4, LAG-3, CD49b, TIM-3, VISTA, PD-1 and Foxp3.
Figure 4
Figure 4
Increased expression of distinct checkpoint molecules by Treg from C57BL/6 mice. BALB/c, F1 and C57BL/6 mice were left naïve (day 0) or infected with 2000 iL3. Six days later mes LN were isolated and stained with a panel for regulatory receptors (a–f) or ILT3 (g). Statistical analysis showing the expression of CTLA-4 (a), BTLAhigh (b), CD49b (c), VISTA (d), LAG-3 (e), PD-1 (f), and ILT3 (g) by Treg. The gating strategy is shown in the Supplementary Figs. S1 and S2. Each Symbol represents one mouse. Shown are combined results from 2 to 3 experiments (a-f: BALB/c day 0 p.i.: n = 3, day 6 p.i.: n = 14; F1 day 0 p.i.: n = 5, day 6 p.i.: n = 13; C57BL/6 day 0 p.i.: n = 4 mice, day 6 p.i.: n = 8; g: BALB/c day 0 p.i.: n = 3 mice; F1 day 0 p.i.: n = 5 mice; C57BL/6 day 0 p.i.: n = 5 mice; n = 8 mice for all infected mouse strains). Data (a–f) were analyzed by 1-way ANOVA with Tukey's multiple comparisons test. Differences in the ILT3 expression (g) were analyzed by Kruskal–Wallis test. Black asterisks are shown for naïve and infected mice and indicate significant differences of the mean (*p ≤ 0.05, **p ≤ 0.005, ***p ≤ 0.001, ****p ≤ 0.0001, ns = non significant). If in a graph only a large bar with ns is depicted, no statistical differences between the three genotypes exist at this time point. Grey asterisks indicate significant differences between day 0 and day 6 p.i. from one murine genotype.
Figure 5
Figure 5
Expression of regulatory receptors is more pronounced by Foxp3 CD4+ T cells from C57BL/6 mice than BALB/c and F1 mice. BALB/c, F1 and C57BL/6 mice were infected with 2000 iL3. Six days later mes LN were isolated and stained with a panel for regulatory receptors. t-SNE calculation was performed with 80,000 Foxp3CD4+ T cells using FlowJo Plugins. Representative t-SNE heatmaps derived from BALB/c (a), F1 (b) and C57BL/6 (c) showing the expression of BTLA, CTLA-4, LAG-3, CD49b, TIM-3, VISTA, PD-1 and CD39.
Figure 6
Figure 6
Highest expression of regulatory receptors by Foxp3 T cells from C57BL/6 mice. BALB/c, F1 and C57BL/6 mice were left naïve (day 0) or infected with 2000 iL3. Six days later mes LN were isolated and stained with a panel for regulatory receptors (af) or for ILT3 (g). Statistical analysis showing the expression of CTLA-4 (a), BTLAhigh (b), CD49b (c), LAG-3 (d), PD-1 (e), VISTA (f), and ILT3 (g) by CD4+ Foxp3 CD4+ T cells. Each Symbol represents one mouse. Shown are combined results from 2 to 3 experiments (af: BALB/c day 0 p.i.: n = 3, day 6 p.i.: n = 14; F1 day 0 p.i.: n = 5, day 6 p.i.: n = 13; C57BL/6 day 0 p.i.: n = 4 mice, day 6 p.i.: n = 8; g: BALB/c day 0 p.i.: n = 3 mice; F1 day 0 p.i.: n = 5 mice; C57BL/6 day 0 p.i.: n = 8 mice; n = 8 mice for all infected mouse strains). Data (a,c,d,e,g) were analyzed by 1-way ANOVA with Tukey's multiple comparisons test; panel b and f were analyzed by Kruskal–Wallis test. Black Asterisks indicate differences of the mean between naïve or infected mice and indicate significant differences (**p ≤ 0.005, ***p ≤ 0.001, ****p ≤ 0.0001, ns = non significant). If in a graph only a large bar with ns is depicted, no statistical differences between the three genotypes exist at this time point. Grey asterisks indicate significant differences between day 0 and day 6 p.i. from one murine genotype.
Figure 7
Figure 7
Depletion of Treg in F1 mice results in improved expulsion of S. ratti from the intestine. BALB/c DEREG, F1 DEREG and C57BL/6 DEREG mice and their littermates were infected with 2000 iL3 s.c. in the footpad. DEREG mice (− Treg) and their non-transgenic littermates (+ Treg) were treated with 0.5 µg DT one day prior to S. ratti infection and on the 2 following days. (a) Parasitic adults in the small intestine were counted at day 6. Shown are combined results from 3 experiments (BALB/c + /− Treg: n = 13; F1 + Treg: n = 9, F1 − Treg: n = 11; C57BL/6 + Treg: n = 11, C57BL/6 − Treg: n = 12). (b) Concentration of mMCPT-1 in the serum of day 5 infected mice. Each symbol represents the worm burden and the amount of mMCPT-1 from a single mouse. Horizontal lines represent the mean. Shown are combined results from 3 different experiments with n = 10 mice per group. Data were analyzed by unpaired t-test comparing mice with and without Treg from one genotype. Asterisks indicate significant differences of the mean (*p ≤ 0.05, ***p ≤ 0.001, ****p ≤ 0.0001).

Similar articles

Cited by

References

    1. Reitz M, et al. Interleukin-9 promotes early mast cell-mediated expulsion of Strongyloides ratti but is dispensable for generation of protective memory. Sci. Rep. 2018;8:8636. doi: 10.1038/s41598-018-26907-2. - DOI - PMC - PubMed
    1. Reitz M, et al. Mucosal mast cells are indispensable for the timely termination of Strongyloides ratti infection. Mucosal Immunol. 2017;10:481–492. doi: 10.1038/mi.2016.56. - DOI - PubMed
    1. Blankenhaus B, et al. Foxp3(+) regulatory T cells delay expulsion of intestinal nematodes by suppression of IL-9-driven mast cell activation in BALB/c but not in C57BL/6 mice. PLoS Pathog. 2014;10:e1003913. doi: 10.1371/journal.ppat.1003913. - DOI - PMC - PubMed
    1. Maizels RM, McSorley HJ. Regulation of the host immune system by helminth parasites. J. Allergy Clin. Immunol. 2016;138:666–675. doi: 10.1016/j.jaci.2016.07.007. - DOI - PMC - PubMed
    1. Rausch S, et al. Establishment of nematode infection despite increased Th2 responses and immunopathology after selective depletion of Foxp3+ cells. Eur. J. Immunol. 2009;39:3066–3077. doi: 10.1002/eji.200939644. - DOI - PubMed

Publication types

Substances

LinkOut - more resources