. 2021 Jan 15;11(1):1510.
doi: 10.1038/s41598-020-80517-5.

Striped bass (Morone saxatilis) migration timing driven by estuary outflow and sea surface temperature in the San Francisco Bay-Delta, California

Affiliations

Striped bass (Morone saxatilis) migration timing driven by estuary outflow and sea surface temperature in the San Francisco Bay-Delta, California

Pascale Goertler et al. Sci Rep. .

Abstract

The influence of climate on the timing of large-scale animal migrations is a major ecological and resource management concern. Anadromous fish migrations can have broad scale impacts on human communities and marine, aquatic and terrestrial food webs. However, isolating the effects of climate change on the timing of life stage transitions for anadromous fish species is challenging. Striped bass (Morone saxatilis) exhibit striking variation in migration patterns within their natural range, including migratory behaviors that change with latitude, and climate-induced temperature changes are predicted to drive future habitat and distribution changes. Here we explore the linkages between migration and multiple components of coastal and inland aquatic ecosystems impacted by climate change. By leveraging environmental and fisheries monitoring which began in 1969, we describe the upstream migration timing of non-native adult Striped bass influenced by estuary outflow and sea surface temperature in the San Francisco Bay-Delta, California. Striped bass migrated later in years when Delta outflow was greater and sea surface temperature was cooler. It is likely that temperature thresholds in the ocean during the springtime provide a cue for Striped bass to initiate migration, but sea surface temperature may also represent composite climatic trends influencing Striped bass. Further, the observed variation in migration timing of adult Striped bass has implications for predation risk on the seaward-migration of juvenile Chinook salmon.


Conflict of interest statement

The authors declare no competing interests.

Figures

Figure 1
Figure 1
Median migration date for Striped bass and juvenile Chinook salmon. Each species and location sampled is denoted by color, with like areas of juvenile Chinook sampling grouped by symbol: circles for upper tributaries of the Sacramento River, diamonds for locations within the Feather River watershed, and square for watersheds that are not tributaries of the Sacramento River. Median date is represented by a single point and sampling period is represented by a vertical line through that point. The y-axis is September 1st to August 31st.
Figure 2
Figure 2
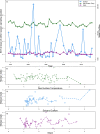
Parameters from the best model in Table 2 plotted through time (a) and against median migration date of adult Striped bass (bd). Sea surface temperature (°C), mean Delta outflow (cfs), and the slope of within season sampling location are plotted by year (a). Then, sea surface temperature (b), mean Delta outflow (c) and the slope of within season sampling location (d) were z-scored and plotted against median date of migration with linear least squares regressions shown by dashed lines. Each variable from the best model in Table 2 is distinguished by color and symbol: sea surface temperature (°C) as green circles, mean Delta outflow (cfs) in blue diamonds, and the slope of within season sampling location denoted by purple triangles.
Figure 3
Figure 3
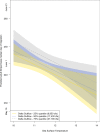
Predicted adult Striped bass median day of migration from the best model, which included the slope of upstream movement in sampling location, mean Delta outflow and mean sea surface temperature (Table S1). The slope of upstream movement in sampling location was held at a mean value of 0.3538, while three values representing the of range Delta outflows described in this study are plotted.
Figure 4
Figure 4
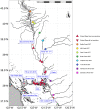
Sampling locations in this study are shown as symbols on the map of the San Francisco Bay-Delta and Central Valley, California. Each species and location sampled is denoted by color, with like areas grouped by symbol: triangles for Striped bass sampling and for the rotary screw trap (RST) sampling of juvenile Chinook salmon, circles denote the upper tributaries of the Sacramento River, diamonds for Feather River watershed, and squares represent the non-Sacramento River tributary watersheds. The map was made using program R version 3.6.3.

Similar articles

Cited by

References

    1. Lucas MC, Baras E. Migration of Freshwater Fishes. Oxford: Wiley-Blackwell; 2001.
    1. Adamczewska A, Morris S. Ecology and behavior of Gecarcoideanatalis, the Christmas Island Red Crab, during the annual breeding migration. Biol. Bull. 2001;200:305–320. doi: 10.2307/1543512. - DOI - PubMed
    1. Scheurell M, Schindler D. Diel vertical migration by juvenile sockeye salmon: Empirical evidence for the antipredation window. Ecology. 2003;84:1713–1720. doi: 10.1890/0012-9658(2003)084[1713:DVMBJS]2.0.CO;2. - DOI
    1. Gende SM, Edwards RT, Willson MF, Wipfli MS. Pacific salmon in aquatic and terrestrial ecosystems. Bioscience. 2002;52:917–928. doi: 10.1641/0006-3568(2002)052[0917:PSIAAT]2.0.CO;2. - DOI
    1. Quinn T, Dittman A. Pacific salmon migrations and homing: Mechanisms and adaptive significance. Trends Ecol. Evol. 1990;5:174–177. doi: 10.1016/0169-5347(90)90205-R. - DOI - PubMed

Publication types

LinkOut - more resources