. 2021 Jan 15;11(1):1636.
doi: 10.1038/s41598-020-80824-x.

A new rat model of creatine transporter deficiency reveals behavioral disorder and altered brain metabolism

Affiliations

A new rat model of creatine transporter deficiency reveals behavioral disorder and altered brain metabolism

Lara Duran-Trio et al. Sci Rep. .

Abstract

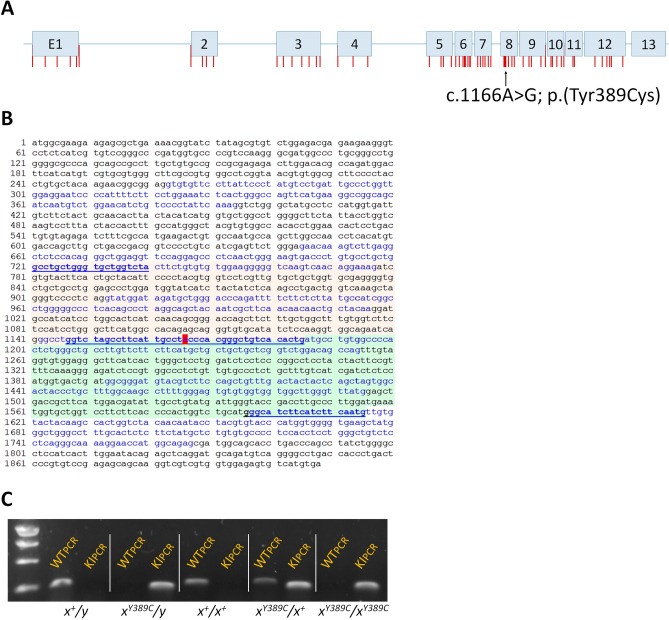
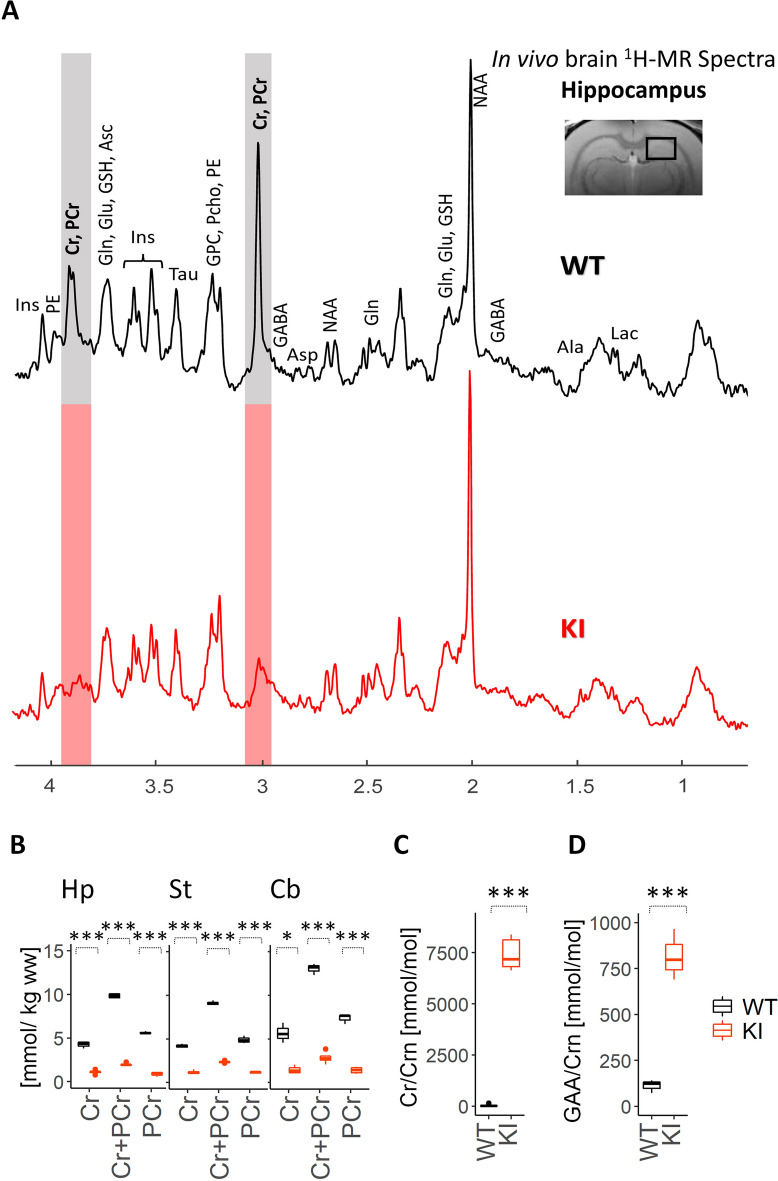
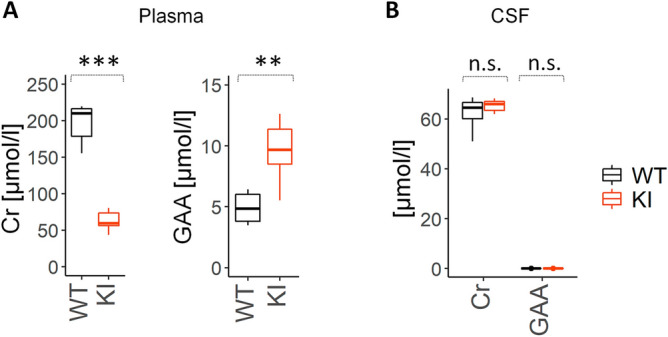
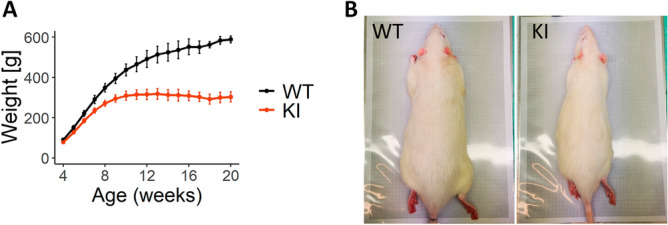
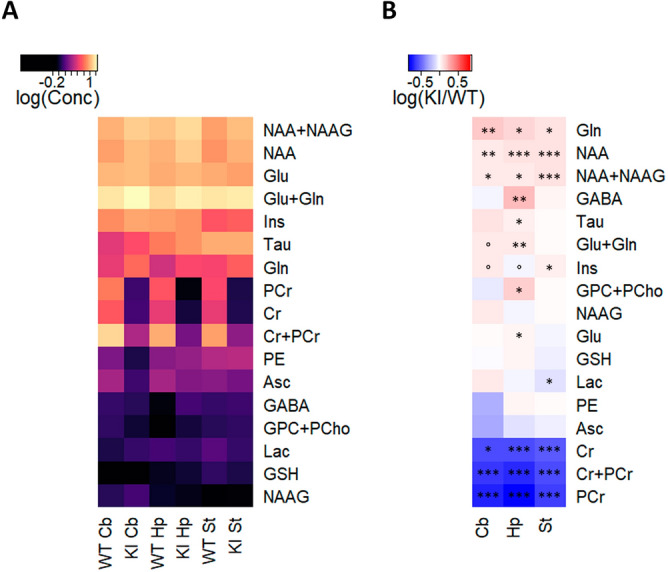
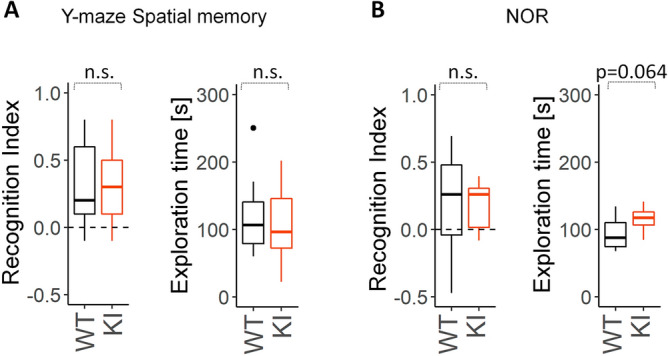
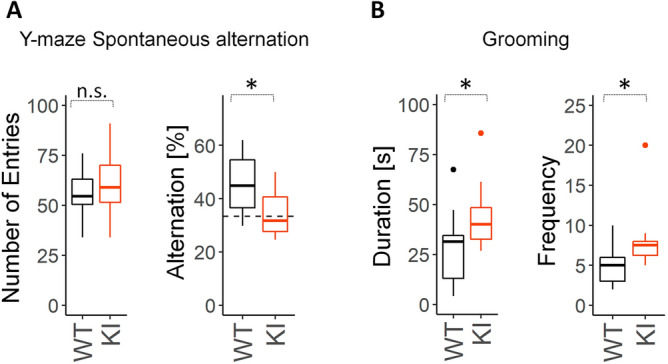
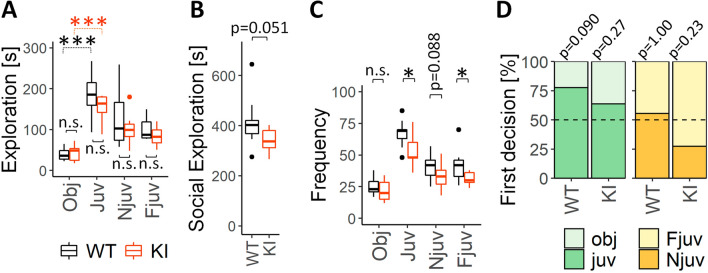
Creatine is an organic compound used as fast phosphate energy buffer to recycle ATP, important in tissues with high energy demand such as muscle or brain. Creatine is taken from the diet or endogenously synthetized by the enzymes AGAT and GAMT, and specifically taken up by the transporter SLC6A8. Deficit in the endogenous synthesis or in the transport leads to Cerebral Creatine Deficiency Syndromes (CCDS). CCDS are characterized by brain creatine deficiency, intellectual disability with severe speech delay, behavioral troubles such as attention deficits and/or autistic features, and epilepsy. Among CCDS, the X-linked creatine transporter deficiency (CTD) is the most prevalent with no efficient treatment so far. Different mouse models of CTD were generated by doing long deletions in the Slc6a8 gene showing reduced brain creatine and cognitive deficiencies or impaired motor function. We present a new knock-in (KI) rat model of CTD holding an identical point mutation found in patients with reported lack of transporter activity. KI males showed brain creatine deficiency, increased urinary creatine/creatinine ratio, cognitive deficits and autistic-like traits. The Slc6a8Y389C KI rat fairly enriches the spectrum of CTD models and provides new data about the pathology, being the first animal model of CTD carrying a point mutation.


Conflict of interest statement

The authors declare no competing interests.

Figures

Figure 1
Figure 1
Generation and genotyping of Slc6a8Y389C rat. (A) Scheme of human SLC6A8 locus with the exons and the position of mutations found in patients (vertical red bars; missense mutations or little deletions according to Van de Kamp et al. 2013). Black arrow points to the position of the mutation c.1166A > G. (B) Wild-type rat cDNA sequence showing the alternating exons (black and blue letters) and the position of the mutation (red highlight). Green and orange backgrounds represent WT and KI fragments, respectively, after PCR amplification. Underlined letters are the sequences related to the primers used. (C) PCR products for each genotype. WT fragment at the left, KI at the right.
Figure 2
Figure 2
Brain creatine deficiency and renal creatine transporter deficiency in Slc6a8xY389C/y KI males. (A) Representative 9.4 T 1H-MRS spectra in the hippocampus of WT and Slc6a8Y389C KI rats, showing the strong decrease of the Cr and PCr peaks in Slc6a8Y389C KI rats. Note the much smaller Cr and PCr peaks in KI male. The localization of the measured voxel is presented on top of the panel. (B) Box plots of Cr and PCr concentrations in hippocampus (Hp), striatum (St) and cerebellum (Cb) in WT and Slc6a8Y389C KI males (black and orange boxplots, respectively). 3–4 WT and 4–5 KI animals. (C) Cr/Crn and (D) GAA/Crn ratios in the urine of WT and Slc6a8xY389C/y KI males. 6 WT and 7 KI males. *: p < 0.05, **: p < 0.01, ***: p < 0.001 (two tail t-test for 1H-MRS; Mann–Whitney test for urine analysis). Statistical analysis was conducted with R-3.5.1. Graphs were done using ggplot2 package.
Figure 3
Figure 3
Cr deficiency and GAA increase in plasma, while no change in CSF, in Slc6a8Y389C rats. (A) Box plot of Cr and GAA concentrations (left and right panel, respectively) of plasma in WT (black) and KI (orange) males. Note the reduction in Cr and the increase in GAA levels. (B) Box plot of Cr and GAA concentrations of CSF in WT and KI males. 6 WT and 7 KI males; **: p < 0.01, ***: p < 0.001, n.s. : no statistical differences (two-tail t-test). Statistical analysis was conducted with R-3.5.1. Graphs were done using ggplot2 package.
Figure 4
Figure 4
Slc6a8Y389C KI males show a significantly decreased body weight gain. (A) Weight average (in grams) from 4 to 17 weeks of age. Error bars represent standard deviation. 13 animals per group, p < 0.0025 from 4 weeks-old on (Mann–Whitney test). (B) Body size comparison between a WT and a KI male at 20 weeks of age. Gray rectangle dimension is 280 × 190 mm. Statistical analysis was conducted with R-3.5.1. Graphs were done using ggplot2 package.
Figure 5
Figure 5
Slc6a8Y389C KI males present a systematic and significant increase in Gln, NAA and NAA + NAAG levels in all brain regions. (A) Logarithm (Log10) of concentration (in mmol/l) of 1H-MRS-measured metabolites in cerebellum (Cb), hippocampus (Hp) and striatum (St) from WT and KI males. (B) Logarithm of the KI concentrations normalized to WT (logarithm of the ratio between KI and WT concentrations). Blue colors indicate a reduction and red colors indicate an increase of concentrations with respect to the WT values. 3–4 WT and 4–5 KI animals; p < 0.10; *p < 0.05; **p < 0.01, ***p < 0.001 (two-tail t-tests except for GABA in Cb, NAA + NAAG in Hp and PE in St, in which Mann–Whitney tests were used). Statistical analysis was conducted with R-3.5.1. Heatmaps were generated using gplots.
Figure 6
Figure 6
Slc6a8xY389C/y KI males did not present differences in Y-maze (spatial memory) or NOR (declarative memory). A: Y-maze test showed no differences between genotypes in recognition index (left panel, p = 0.94) or total exploration time of both arms (right panel, p = 0.80). B: NOR test recognition index was similar between genotypes (left panel, p = 0.97), although total exploration time (in seconds) was slightly higher in KI males (right panel, p = 0.064). 9 WT + 9 KI males were used for Y-maze test, 9 WT + 9 KI for NOR test; p values were estimated with two-tail t-tests. n.s.: not significant. Statistical analysis was conducted with R-3.5.1. Graphs were done using ggplot2 package.
Figure 7
Figure 7
Slc6a8xY389C/y KI males showed impaired working memory in Y-maze for spontaneous alternation, and more grooming behavior. A: Boxplots from Y-maze for spontaneous alternation test. WT and KI males had no differences in the number of entries (left panel, p = 0.57). KI males showed a significant reduction in % of alternations when compared with WT littermates (right panel, p = 0.039), being not higher than the value expected by chance (p = 0.39 one-tail t-test) while % of alternations in WT males were significantly higher (p = 0.010 one-tail t-test). (B) KI males showed more time doing grooming (left panel, p = 0.044) and with more frequency than WT littermates (right panel, p = 0.028, Mann–Whitney test). 8 WT and 10 KI males were used for Y-maze for spontaneous alternations, 10 WT and 10 KI for grooming behavior. By default, p-values were estimated with two-tail t-test. n.s.: not significant; *: p < 0.05. Statistical analysis was conducted with R-3.5.1. Graphs were done using ggplot2 package.
Figure 8
Figure 8
Slc6a8xY389C/y KI males show a systematic tendency in decreased sociability. (A) Total exploration time (in seconds) for each item from WT and KI males (black and orange boxplots, respectively). Note that both WT and KI males explored significantly more the juvenile than the object in the social preference phase. Note also the tendency (although no significant) of KI males, in comparison with their WT littermates, to take more time exploring the object and less time all juveniles in all phases of the test. (B) Sum of the total exploration time (in seconds) of all the juveniles in all the SP-SM test is strongly reduced in KI males. (C) Number of visits (frequency) to each item for WT and KI males. Note the general significant decrease in the number of visits towards the juveniles in KI males. P values in A–C were estimated with two-tail t-test. (D) Percentage of animals who went firstly to a certain item per each phase. In social preference, the number of WT males visiting the juvenile in the first place was marginally significant over the random expectation (dashed line, p = 0.090 one-sided exact binomial test), while the number of KI males was reduced and near to the level expected by chance (p = 0.27 one-sided exact binomial test). In social memory phase, while WT males’ preference to visit firstly the new or the familiar juvenile was random (p = 1.00 two-sided exact binomial test), KI males tended to avoid the new juvenile in the first place (p = 0.23 two-sided exact binomial test). 9 WT + 10 KI for both SP and SM phases. Obj, Juv, Njuv and Fjuv: object, juvenile, new and familiar juveniles respectively. *: p < 0.05; ***: p < 0.001. Statistical analysis was conducted with R-3.5.1. Graphs were done using ggplot2 package.

References

    1. Hanna-El-Daher L, Braissant O. Creatine synthesis and exchanges between brain cells: what can be learned from human creatine deficiencies and various experimental models? Amino Acids. 2016;48:1877–1895. doi: 10.1007/s00726-016-2189-0. - DOI - PubMed
    1. Wyss M, Kaddurah-Daouk R. Creatine and creatinine metabolism. Physiol. Rev. 2000;80:1107–1213. doi: 10.1152/physrev.2000.80.3.1107. - DOI - PubMed
    1. Item CB, et al. Arginine:glycine amidinotransferase deficiency: the third inborn error of creatine metabolism in humans. Am. J. Hum. Genet. 2001;69:1127–1133. doi: 10.1086/323765. - DOI - PMC - PubMed
    1. Schulze, A. & Braissant, O. in Pediatric Endocrinology and Inborn Errors of Metabolism (eds Sarafoglou, K., Hoffmann, G. F. & Roth, K. S.) 181–190 (McGraw Hill, New York, 2017).
    1. Salomons GS, et al. X-linked creatine-transporter gene (SLC6A8) defect: a new creatine-deficiency syndrome. Am. J. Hum. Genet. 2001;68:1497–1500. doi: 10.1086/320595. - DOI - PMC - PubMed

Publication types

MeSH terms

Substances

Supplementary concepts

LinkOut - more resources