. 2021 Jan 15;11(1):1527.
doi: 10.1038/s41598-020-80851-8.

WASP: a software package for correctly characterizing the topological development of ribbon structures

Affiliations

WASP: a software package for correctly characterizing the topological development of ribbon structures

Zachary Sierzega et al. Sci Rep. .

Abstract

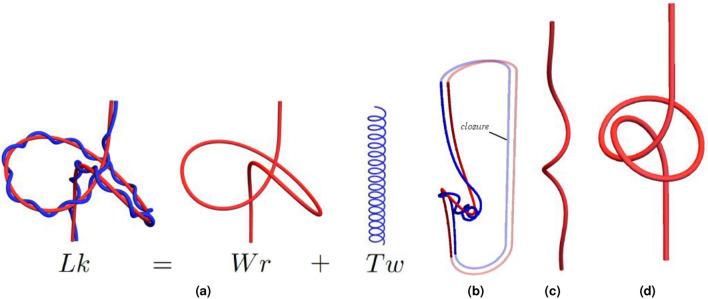
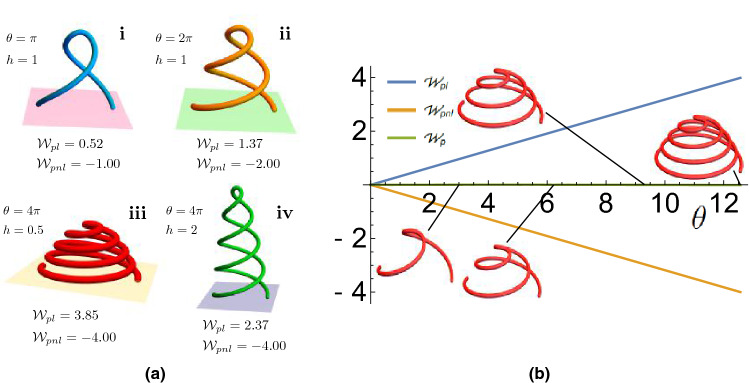
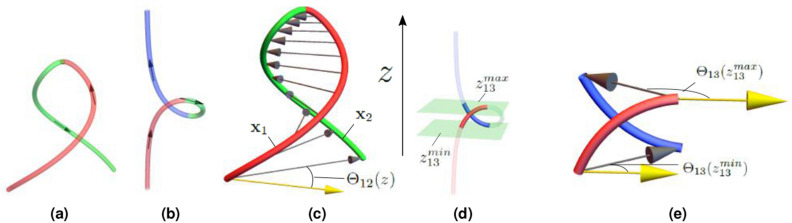
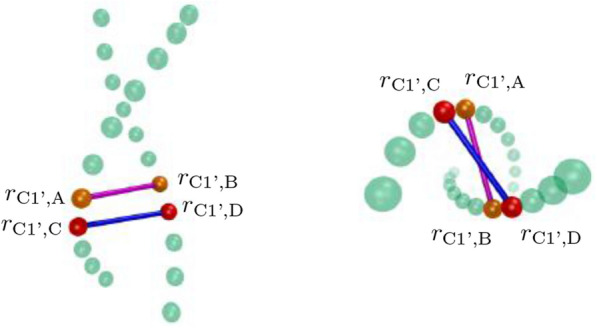
We introduce the Writhe Application Software Package (WASP) which can be used to characterisze the topology of ribbon structures, the underlying mathematical model of DNA, Biopolymers, superfluid vorticies, elastic ropes and magnetic flux ropes. This characterization is achieved by the general twist-writhe decomposition of both open and closed ribbons, in particular through a quantity termed the polar writhe. We demonstrate how this decomposition is far more natural and straightforward than artificial closure methods commonly utilized in DNA modelling. In particular, we demonstrate how the decomposition of the polar writhe into local and non-local components distinctly characterizes the local helical structure and knotting/linking of the ribbon. This decomposition provides additional information not given by alternative approaches. As example applications, the WASP routines are used to characterise the evolving topology (writhe) of DNA minicircle and open ended plectoneme formation magnetic/optical tweezer simulations, and it is shown that the decomponsition into local and non-local components is particularly important for the detection of plectonemes. Finally it is demonstrated that a number of well known alternative writhe expressions are actually simplifications of the polar writhe measure.


Conflict of interest statement

The authors declare no competing interests.

Figures

Figure 1
Figure 1
Illustrations of concepts discussed in the introduction. (a) is an illustration of the meaning of the Wr+Tw decomposition. The left figure is a ribbon structure composed of an axis curve (red) and a second curve wrapping around this axis (blue). The linking of these two curves (invariant if the ends of the ribbon are fixed) can be decomposed into the self linking of the ribbon’s axis (Wr) and the total rotation of the second curve around the axial direction of the first Tw. (b) indicates an artificial extension of the ribbon (a closure). (c,d) illustrate what is meant by local and non-local writhing. The curve in (c) coils helically at its centre; the local writhe measures this helical coiling along the curve’s length. The curve in (d) is knotted/self entangled, that is to say distinct sections of the curve wrap around each other. This is non-local writhing.
Figure 2
Figure 2
Twisted paraboloids used to highlight aspects of the polar writhe. (a) paraboloids with varying heights h and winding angles θ. (a)(i),(ii) paraboloids with equal height but different winding exhibit differences in both Wpl and Wpnl as a result of large-scale rotation and increased helical density. (a)(iii),(iv) paraboloids with equal winding but varying height exhibit differences in Wpl only as the extent of buckling remains constant while helical density is varied. (b) The polar writhe decomposition as a function of the winding angle θ for a parabola for which Wp=0.
Figure 3
Figure 3
Illustrations of the non-local writhe calculation. (a,b) are curves split by their turning points. Their orientations are shown by arrows. (a) The parabola’s turning point is at its peak and the two sections (red and green) which are partitioned by this turning point are shown. (b) A looped curved which could represent the beginning of plectoneme formation. It has two turning points at the top and bottom of the loop. The curve is split into three sections, red, green and blue respectively, by these turning points. (c) The two sections of the parabola x1 and x2 share a common mutual height z[0,h]. At each height a vector is drawn from x1 to x2. As indicated, they make an angle Θ12(z) with respect to a fixed direction. The non-local polar writhe measures the rotation of this angle. (d) Subsections x1 and x3 of the curve shown in (b) which share a mutual z range between two planes z=z13min and z13max. These subsections are shown in bold coloring. (e) The Wpnl calculations for the mutual subsections shown in (d). The difference in the angles Θ13(z13min) and Θ13(z13max) which characterises the non-local writhing contribution from these two sections is depicted.
Figure 4
Figure 4
Polar writhe calculations of plectoneme geometries. (a) Wp values of a loop forming curve deformation. (b) A curve with significant plectoneme structure. The individual loops present are marked.
Figure 5
Figure 5
Left: Side perspective of backbone atoms along a helical fragment of DNA. Beads r represent C1’ atoms along the DNA backbone. Right: Top view of backbone atoms along the helical fragment.
Figure 6
Figure 6
Results from simulations of an Lk=40 DNA helix (undertwisted) placed under a 2pN extension force. Small kinked structures occasionally form along the length of the structure as shown in (a). Shown in (b) are writhe time series plots. The Wp values are shown in red and the Wr values are shown in blue. The Wr values are consistently larger in magnitude but the variations in magnitude follow a very similar pattern. Example axis curves from the time series are shown; they correspond to the times marked by the dashed vertical lines. The curves’ width/height ratios are 0.3, chosen for clarity (0.1 would be the actual ratio). (b) A comparison of Wpl and Wpnl for the Wp calculations shown in (a). There is a mixture of local Wpl and non-local writhing values Wpnl of roughly equal value. Some spikes in Wpnl were found to arise from temporary loop formation. The dashed line indicates one such example whose curve is shown in (d). The spike in Wpnl can be seen to correspond to the tight loop towards the bottom end of the curve.
Figure 7
Figure 7
Writhe time series plots for an undertwisted DNA molecule (Lk=40) subjected to an 8pN pulling force. (a) A comparison of Wp and Wr for the time series. The Wp values are shown in red and the Wr values are show in blue. The Wr values are consistently larger in magnitude. Example axis curves from the time series are shown; they correspond to the times marked by the dashed vertical lines. The curves’ width/height ratios are 0.3, chosen for clarity (0.1 would be the actual ratio). (b) A comparison of Wpl and Wpnl for the Wp calculations shown in (a). For the significant majority of curves, there is only local writhing.
Figure 8
Figure 8
Results from simulations of an Lk = 80 DNA helix (over twisted) experiencing no extension force. In (a) we see the formation of significant supercoiling. In (b) we see that the development of this supercoiling is reflected by the steady increase in both writhing measures. Example axis curves from the time series are shown; they correspond to the times marked by the dashed vertical lines. The curves’ width/height ratios are 0.5, 0.4, 0.3 respectively and chosen for clarity (0.1 would be the actual ratio). (c) shows the local/non-local decomposition of Wp. Except in the initial stage, the non-local writhing is dominant and increases over time as the curve forms increasing numbers of plectoneme type loops.
Figure 9
Figure 9
Polar writhe calculations for two DNA minicirlce cases. (a) indicates the writhing evolution of a 108 base pair Lk=14 minicircle with a (GG)27(GC)27(GG)27(GC)27 sequence exposed to a 10 mM spermine cosolute concentration. (b) indicates the writhing evolution of a 108 base pair Lk=14 minicircle with an (AA)27(AT)27(AA)27(AT)27 sequence exposed to a 10mM spermine cosolute concentration. (c) depicts spermine bridging in an (AA)27(AT)27(AA)27(AT)27 minicircle. Spermine molecules are shown in red. Spikes in Wpnl in (a) indicate the formation of plectonemic loops within the DNA minicircle.
Figure 10
Figure 10
An “over-the-top” unknotting deformation. An initially tight knot shown in (a) is relaxed (a,b). A section of this knot is then allowed to loop over the top of one end of the curve (bd). The curve is then pulled straight to an unknotted straight line (df).
Figure 11
Figure 11
Illustrations of the loss in writhing which occurs to a section of the curve’s interior looping over one of its end points and the extension used to make this loss a discontinuous jump which tracks the pulled tight topology of the ribbon. (a) An interior section of the curve rises above one of the planes containing the curve’s endpoints. The angle Θ represents the difference of two contributions to the Wpnl calculation which involves angles made with the curve’s end point. In (b,c) the curve section rises higher and the angle Θ increases. In (d) the angle is nearly 2π and the curve section has (just) passed directly over the top of the curve's end. (e) is a ribbon corresponding to one of the curves in Fig. 11; a section of the curve is in the plane above the ribbon’s end points. (f) The planar extension to the ribbon is shown. Now the whole ribbon structure is bounded between two planes. The extension is composed of planar curves with no twisting.
Figure 12
Figure 12
Wp calculations. Panel shows (a) writhing values of the curves shown in Fig. 10. (b) A comparison of Wp and Wp for the overtwisted DNA simulations performed. (c,d) The detection of an over-the top deformation contributing one of the large jumps in the Wp measure shown in (b). The end of the curve at neighboring timesteps and the end plane containing the point are shown in both (c,d). A red section of curve extending vertically downward from this point is shown (an extension used in the Wp calculation in the WASP package). A section of the curve’s interior passes through this extension leading to a jump in the Wp quantity.

References

    1. Shao Q, Goyal S, Finzi L, Dunlap D. Physiological levels of salt and polyamines favor writhe and limit twist in DNA. Macromolecules. 2012;45:3188–3196. doi: 10.1021/ma300211t. - DOI - PMC - PubMed
    1. Lee FL, et al. Solution-phase conformation and dynamics of conjugated isoindigo-based donor-acceptor polymer single chains. J. Phys. Chem. Lett. 2017;8:5479–5486. doi: 10.1021/acs.jpclett.7b02360. - DOI - PubMed
    1. Hansen JC. Conformational dynamics of the chromatin fiber in solution: Determinants, mechanisms, and functions. Annu. Rev. Biophys. Biomol. Struct. 2002;31:361–392. doi: 10.1146/annurev.biophys.31.101101.140858. - DOI - PubMed
    1. Irobalieva RN, et al. Structural diversity of supercoiled DNA. Nat. Commun. 2015;6:8440. doi: 10.1038/ncomms9440. - DOI - PMC - PubMed
    1. Fuller FB. The writhing number of a space curve. Proc. Natl. Acad. Sci. 1971;68:815–819. doi: 10.1073/pnas.68.4.815. - DOI - PMC - PubMed

Publication types