. 2021 Jan 15;11(1):1553.
doi: 10.1038/s41598-021-81051-8.

Summer weather conditions influence winter survival of honey bees (Apis mellifera) in the northeastern United States

Affiliations

Summer weather conditions influence winter survival of honey bees (Apis mellifera) in the northeastern United States

Martina Calovi et al. Sci Rep. .

Abstract

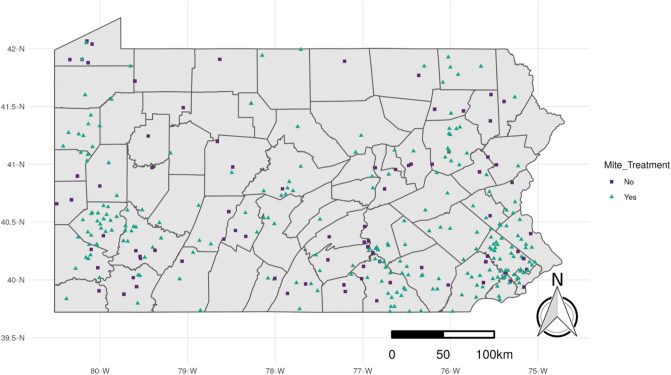
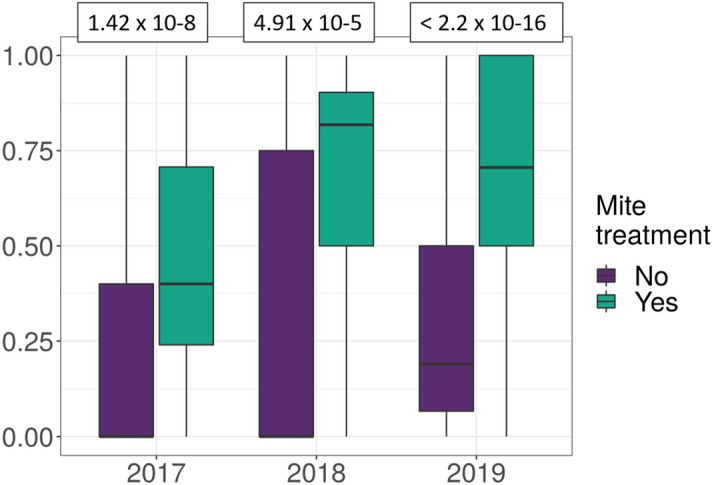
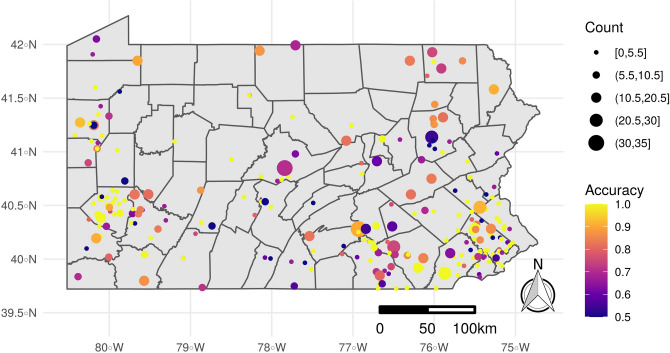
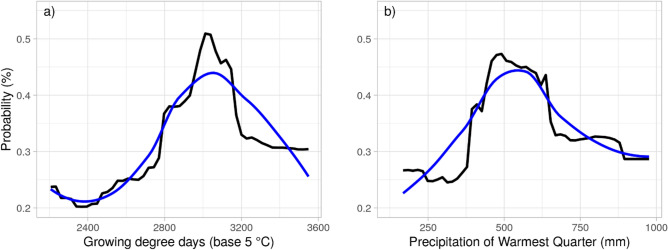
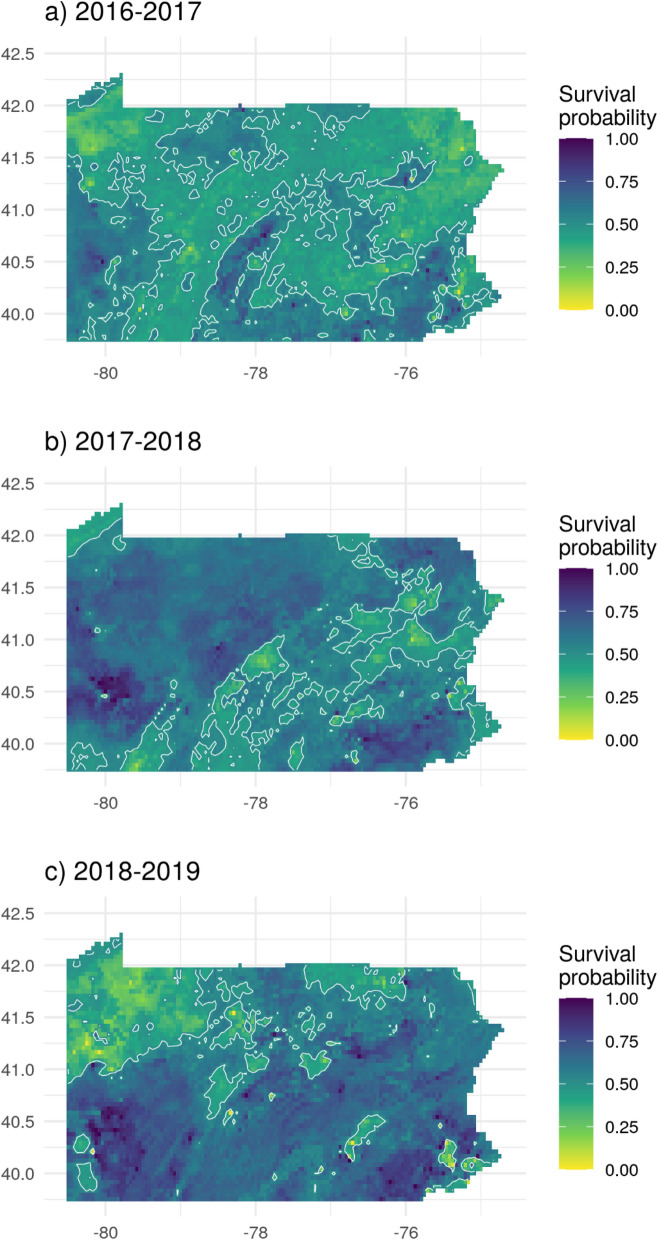
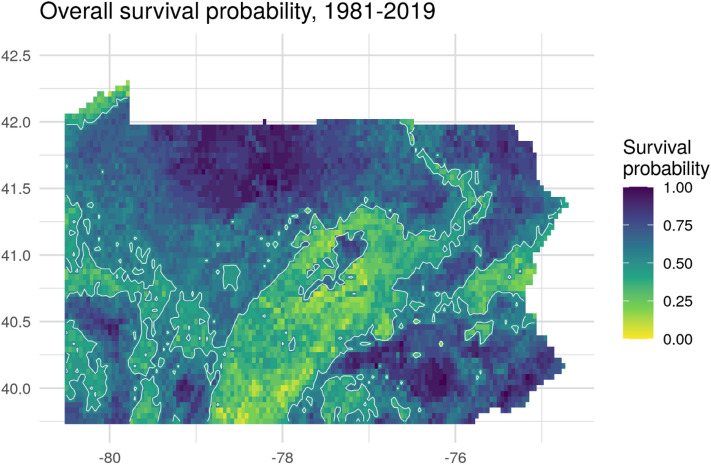
Honey bees are crucial pollinators for agricultural and natural ecosystems, but are experiencing heavy mortality in North America and Europe due to a complex suite of factors. Understanding the relative importance of each factor would enable beekeepers to make more informed decisions and improve assessment of local and regional habitat suitability. We used 3 years of Pennsylvania beekeepers' survey data to assess the importance of weather, topography, land use, and management factors on overwintering mortality at both apiary and colony levels, and to predict survival given current weather conditions and projected climate changes. Random Forest, a tree-based machine learning approach suited to describing complex nonlinear relationships among factors, was used. A Random Forest model predicted overwintering survival with 73.3% accuracy for colonies and 65.7% for apiaries where Varroa mite populations were managed. Growing degree days and precipitation of the warmest quarter of the preceding year were the most important predictors at both levels. A weather-only model was used to predict colony survival probability, and to create a composite map of survival for 1981-2019. Although 3 years data were likely not enough to adequately capture the range of possible climatic conditions, the model performed well within its constraints.


Conflict of interest statement

The authors declare no competing interests.

Figures

Figure 1
Figure 1
Locations of Pennsylvania beekeeper survey respondents from 2016 to 2019, stratified by use of treatment for Varroa mites (257 treated and 85 untreated apiaries). Only treated apiaries were modeled. The map has been generated by the authors in R 3.6.2, using the sf, the raster, the ggplot2 and the cowplot packages.
Figure 2
Figure 2
Survival of mite-treated and untreated honey bee colonies by year. In each of the three years, 80 out of 375 (21%), 25 out of 377 (7%) and 192 out of 974 (20%) colonies were untreated (297 out of 1,726, or 17% overall). In the white boxes the p-values results of the one-sided t-test for each year. Evidence rejects H0 in favor of H1: the average survival is higher when the colonies are treated.
Figure 3
Figure 3
Prediction accuracy of the Random Forest model of overwintering survival probability from the colony model, averaged by apiary for mapping purposes. The dataset used to generate the accuracy map contained 1429 colonies within 257 apiaries. The color indicates the mean overall model accuracy at that apiary, and the circle size is proportional to the number of colonies in November. The map has been generated by the authors in R 3.6.2, using the sf, the raster, the ggplot2 and the cowplot packages.
Figure 4
Figure 4
Partial dependence plot for the two variables that most explain overwintering survival in the prediction analysis at the apiary level. Plot (a) describes the relationship between the growing degree days (along the x axis) and the probability of overwintering survival (y axis), given all the other variables in the model. Plot (b) describes the relationship between the precipitation during the warmest quarter (along the x axis) and the probability of overwintering survival (y axis), given all the other variables in the model. In both the plots, the black line represents the modeled relationship between survival and the variables, while the blue line shows a spline-smoothed fit.
Figure 5
Figure 5
Weather-based prediction maps of the probability of honey bee colony survival from the weather-only colony model for the most recent 3 years of PRISM data. Contour lines show the 0.5 probability level. The three maps show the survival probability for Pennsylvania, based on the results of the weather-based model. The map (a) represents results from year 2016, which had a mean annual temperature of 10.4 °C and a mean annual precipitation of 1007 mm across the state. Map (b) represents results from year 2017, which had a mean temperature of 10.2 °C and a mean annual precipitation of 1205 mm. Map (c) represents results from year 2018, which had a mean annual temperature of 9.7 °C and mean annual precipitation of 1653 mm. For the whole period of record, from 1981 to 2018, the mean annual temperature was 9.4 °C, with a mean annual precipitation of 1082 mm. The maps have been generated by the authors in R 3.6.2, using the sf, the raster, the ggplot2 and the cowplo packages.
Figure 6
Figure 6
Mean probability of colony survival for 1981–2019 from the weather-only colony model. Contour lines show the 0.5 probability level. The map has been generated by the authors in R 3.6.2, using the sf, the raster, the ggplot2 and the cowplot packages.

References

    1. Calderone NW. Insect pollinated crops, insect pollinators and US agriculture: Trend analysis of aggregate data for the period 1992–2009. PLoS ONE. 2012;7:24–28. doi: 10.1371/journal.pone.0037235. - DOI - PMC - PubMed
    1. Chopra SS, Bakshi BR, Khanna V. Economic dependence of U.S. industrial sectors on animal-mediated pollination service. Environ. Sci. Technol. 2015;49:14441–14451. doi: 10.1021/acs.est.5b03788. - DOI - PubMed
    1. USDA-National Agricultural Statistics Service Information. Honey. (2019).
    1. Bee Informed Team. Loss & Management Survey. https://beeinformed.org/citizen-science/loss-and-management-survey/ (2019).
    1. Seitz N, et al. Encuesta nacional sobre la pérdida anual de colmenas de abejas manejadas durante 2014–2015 en los EEUU. J. Apic. Res. 2015;54:292–304. doi: 10.1080/00218839.2016.1153294. - DOI

Publication types

LinkOut - more resources