

Prediction of short-term antidepressant response using probabilistic graphical models with replication across multiple drugs and treatment settings
- PMID: 33452433
- PMCID: PMC8134509
- DOI: 10.1038/s41386-020-00943-x
Prediction of short-term antidepressant response using probabilistic graphical models with replication across multiple drugs and treatment settings
Abstract
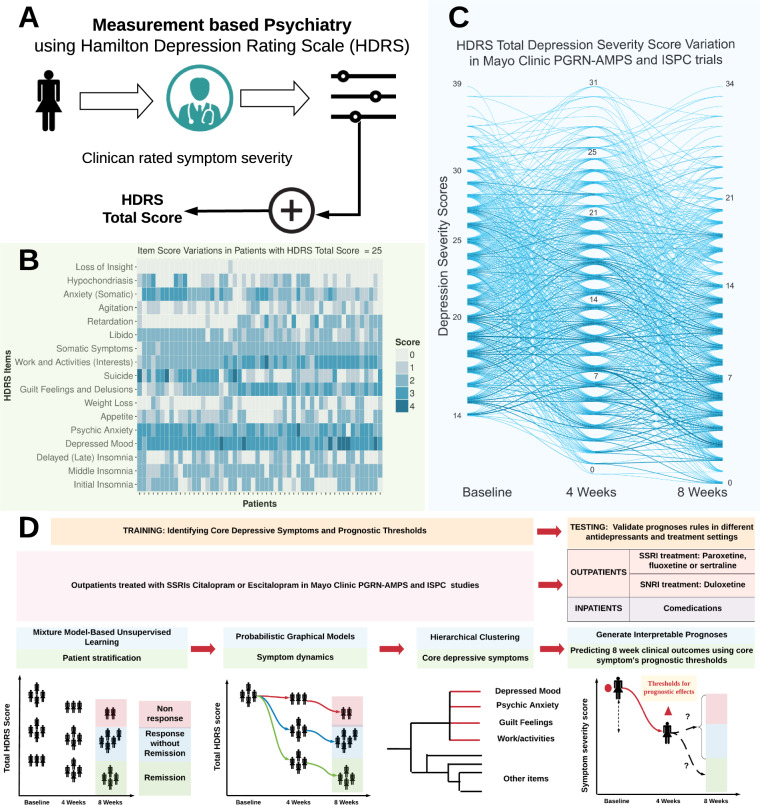
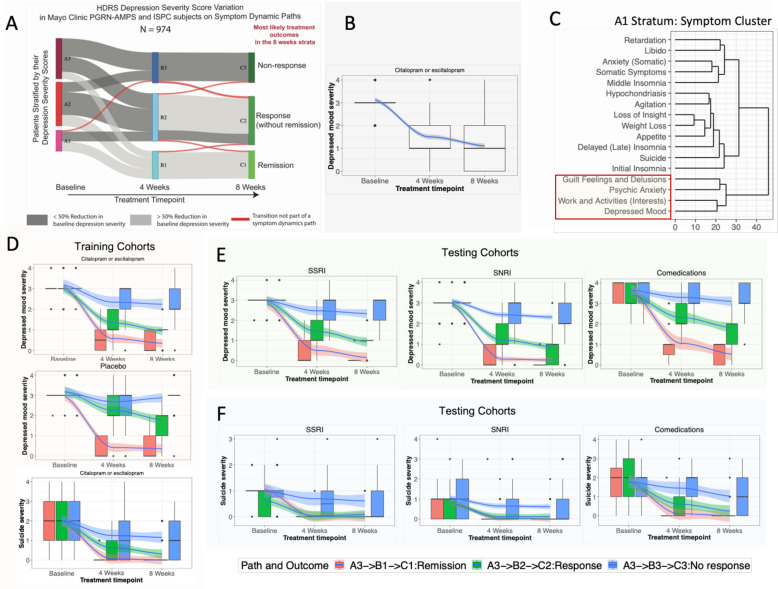
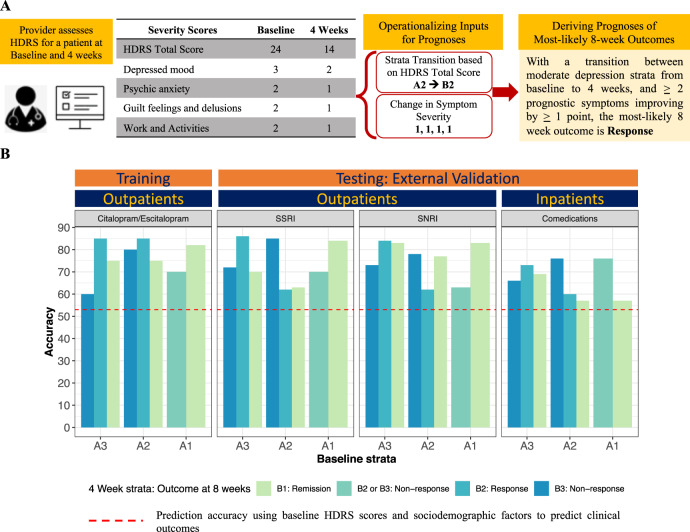
Heterogeneity in the clinical presentation of major depressive disorder and response to antidepressants limits clinicians' ability to accurately predict a specific patient's eventual response to therapy. Validated depressive symptom profiles may be an important tool for identifying poor outcomes early in the course of treatment. To derive these symptom profiles, we first examined data from 947 depressed subjects treated with selective serotonin reuptake inhibitors (SSRIs) to delineate the heterogeneity of antidepressant response using probabilistic graphical models (PGMs). We then used unsupervised machine learning to identify specific depressive symptoms and thresholds of improvement that were predictive of antidepressant response by 4 weeks for a patient to achieve remission, response, or nonresponse by 8 weeks. Four depressive symptoms (depressed mood, guilt feelings and delusion, work and activities and psychic anxiety) and specific thresholds of change in each at 4 weeks predicted eventual outcome at 8 weeks to SSRI therapy with an average accuracy of 77% (p = 5.5E-08). The same four symptoms and prognostic thresholds derived from patients treated with SSRIs correctly predicted outcomes in 72% (p = 1.25E-05) of 1996 patients treated with other antidepressants in both inpatient and outpatient settings in independent publicly-available datasets. These predictive accuracies were higher than the accuracy of 53% for predicting SSRI response achieved using approaches that (i) incorporated only baseline clinical and sociodemographic factors, or (ii) used 4-week nonresponse status to predict likely outcomes at 8 weeks. The present findings suggest that PGMs providing interpretable predictions have the potential to enhance clinical treatment of depression and reduce the time burden associated with trials of ineffective antidepressants. Prospective trials examining this approach are forthcoming.
Figures
References
-
- Chisholm D, Sweeny K, Sheehan P, Rasmussen B, Smit F, Cuijpers P, Saxena S. Scaling-up treatment of depression and anxiety: a global return on investment analysis. Lancet Psychiatry. 2016;3:415–24.. - PubMed
-
- Guo T, Xiang Y-T, Xiao L, Hu C-Q, Chiu HFK, Ungvari GS, et al. Measurement-based care versus standard care for major depression: a randomized controlled trial with blind raters. Am J Psychiatry. 2015;172:1004–13. - PubMed
-
- Trivedi MH. Evaluating and monitoring treatment response in depression using measurement-based assessment and rating scales. J Clin Psychiatry. 2013;74:e14. - PubMed
Publication types
MeSH terms
Substances
Grants and funding
LinkOut - more resources
Full Text Sources
Other Literature Sources
Medical
