

Possible diverse contribution of coronary risk factors to left ventricular systolic and diastolic cavity sizes
- PMID: 33452451
- PMCID: PMC7810980
- DOI: 10.1038/s41598-021-81341-1
Possible diverse contribution of coronary risk factors to left ventricular systolic and diastolic cavity sizes
Abstract
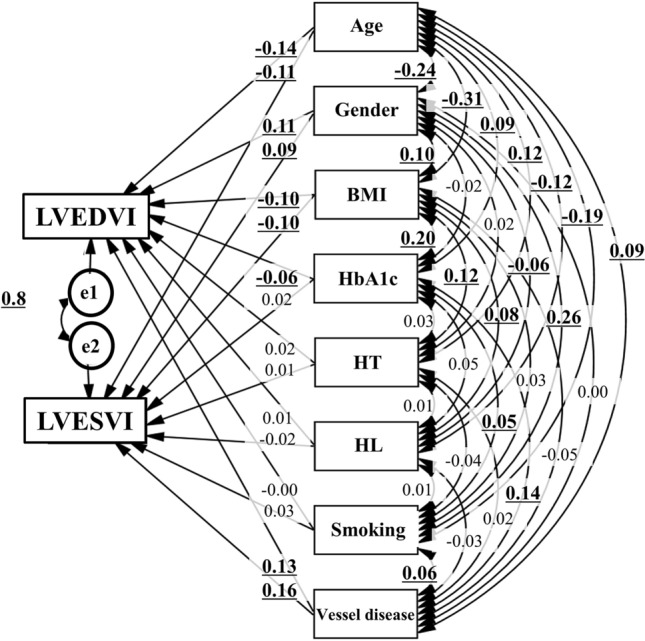
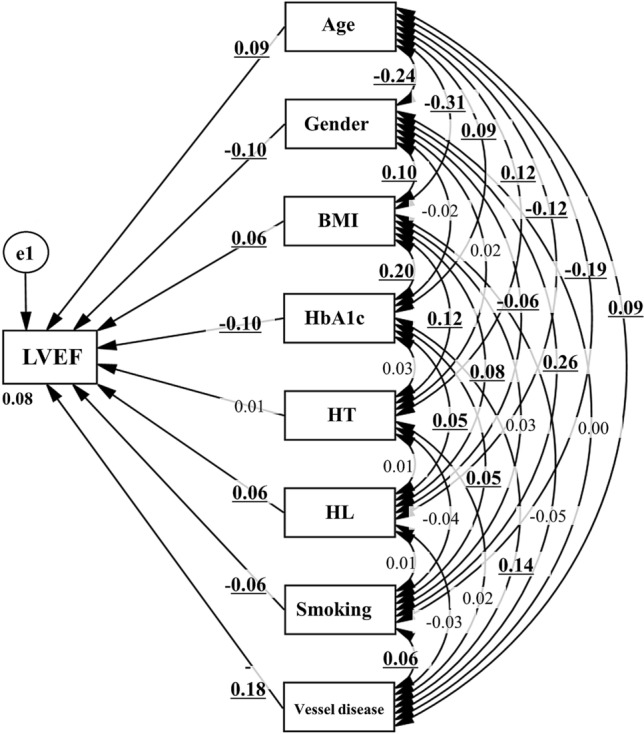
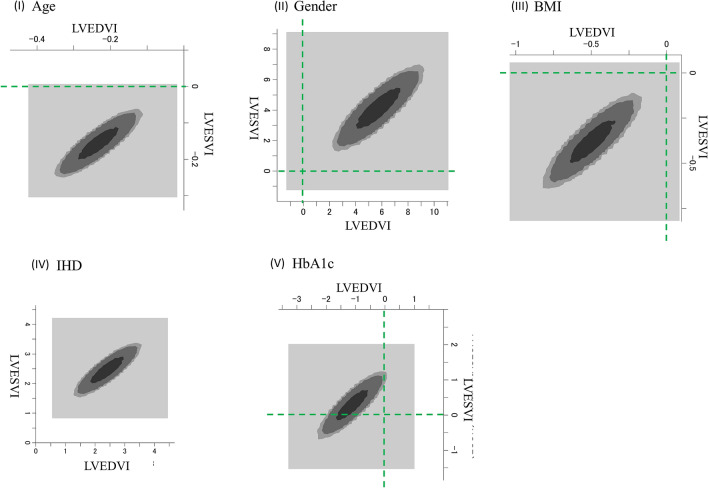
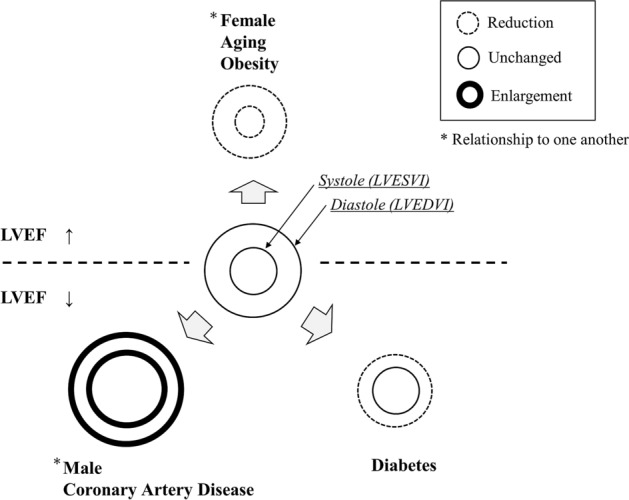
It is generally believed that risk factors damage the coronary arteries, cause myocardial ischemia, and consequently change the shape of the heart. On the other hand, each of the risk factors may also have a negative effect on the heart. However, it is very difficult to examine the effects of each of these risk factors independently. Therefore, it is necessary to select an appropriate statistical method and apply it efficiently. In this study, the effects of coronary risk factors on left ventricular size and cardiac function were investigated using structure equation modeling (SEM), and were shown as Bayesian SEM-based frequency polygons using selected two-dimensional contours. This study showed that each risk factor directly affected the shape of the heart. Because vascular risk and heart failure risk are likely to evolve at the same time, managing risk factors is very important in reducing the heart failure pandemic.
Conflict of interest statement
The authors declare no competing interests.
Figures
Similar articles
-
Effect of jet ventilation on heart failure: decreased afterload but negative response in left ventricular end-systolic pressure-volume function.Crit Care Med. 1996 Apr;24(4):647-57. doi: 10.1097/00003246-199604000-00017. Crit Care Med. 1996. PMID: 8612418
-
Subendocardial and subepicardial pressure-flow relations in the rat heart in diastolic and systolic arrest.J Biomech. 2004 May;37(5):697-707. doi: 10.1016/j.jbiomech.2003.09.015. J Biomech. 2004. PMID: 15046999
-
The Prognostic Value of Diastolic and Systolic Mechanical Left Ventricular Dyssynchrony Among Patients With Coronary Heart Disease.JACC Cardiovasc Imaging. 2019 Jul;12(7 Pt 1):1215-1226. doi: 10.1016/j.jcmg.2018.05.018. Epub 2018 Jul 18. JACC Cardiovasc Imaging. 2019. PMID: 30031704
-
Clinical aspects of left ventricular diastolic function assessed by Doppler echocardiography following acute myocardial infarction.Dan Med Bull. 2001 Nov;48(4):199-210. Dan Med Bull. 2001. PMID: 11767125 Review.
-
Congestive heart failure with normal left ventricular systolic function. Clinical approaches to the diagnosis and treatment of diastolic heart failure.Arch Intern Med. 1996 Jan 22;156(2):146-57. Arch Intern Med. 1996. PMID: 8546548 Review.
Cited by
-
Evaluation of Systemic Sclerosis Primary Heart Involvement and Chronic Heart Failure in the European Scleroderma Trials and Research Cohort.J Am Heart Assoc. 2025 Mar 4;14(5):e036730. doi: 10.1161/JAHA.124.036730. Epub 2025 Feb 26. J Am Heart Assoc. 2025. PMID: 40008525 Free PMC article.
-
Effect of heart rate on B-type natriuretic peptide in sinus rhythm.Sci Rep. 2024 Dec 30;14(1):31711. doi: 10.1038/s41598-024-81922-w. Sci Rep. 2024. PMID: 39738157 Free PMC article.
-
Relationship between haemodynamic indicators and haemogram in patients with heart failure.ESC Heart Fail. 2023 Apr;10(2):955-964. doi: 10.1002/ehf2.14258. Epub 2022 Dec 7. ESC Heart Fail. 2023. PMID: 36478404 Free PMC article.
-
The relationship between mixed venous blood oxygen saturation and pulmonary arterial and venous pressures in patients with heart failure.Physiol Rep. 2024 Nov;12(22):e70128. doi: 10.14814/phy2.70128. Physiol Rep. 2024. PMID: 39567192 Free PMC article.
References
-
- Delicce, A. V. & Makaryus, A. N. In StatPearls (StatPearls Publishing LLC, 2018).
MeSH terms
Substances
LinkOut - more resources
Full Text Sources
Other Literature Sources
Medical
