. 2021 Jul;73(7):1220-1232.
doi: 10.1002/art.41652. Epub 2021 May 25.

Tissue-Resident Memory CD8+ T Cells From Skin Differentiate Psoriatic Arthritis From Psoriasis

Affiliations

Tissue-Resident Memory CD8+ T Cells From Skin Differentiate Psoriatic Arthritis From Psoriasis

Emmerik F Leijten et al. Arthritis Rheumatol. 2021 Jul.

Abstract

Objective: To compare immune cell phenotype and function in psoriatic arthritis (PsA) versus psoriasis in order to better understand the pathogenesis of PsA.

Methods: In-depth immunophenotyping of different T cell and dendritic cell subsets was performed in patients with PsA, psoriasis, or axial spondyloarthritis and healthy controls. Subsequently, we analyzed cells from peripheral blood, synovial fluid (SF), and skin biopsy specimens using flow cytometry, along with high-throughput transcriptome analyses and functional assays on the specific cell populations that appeared to differentiate PsA from psoriasis.

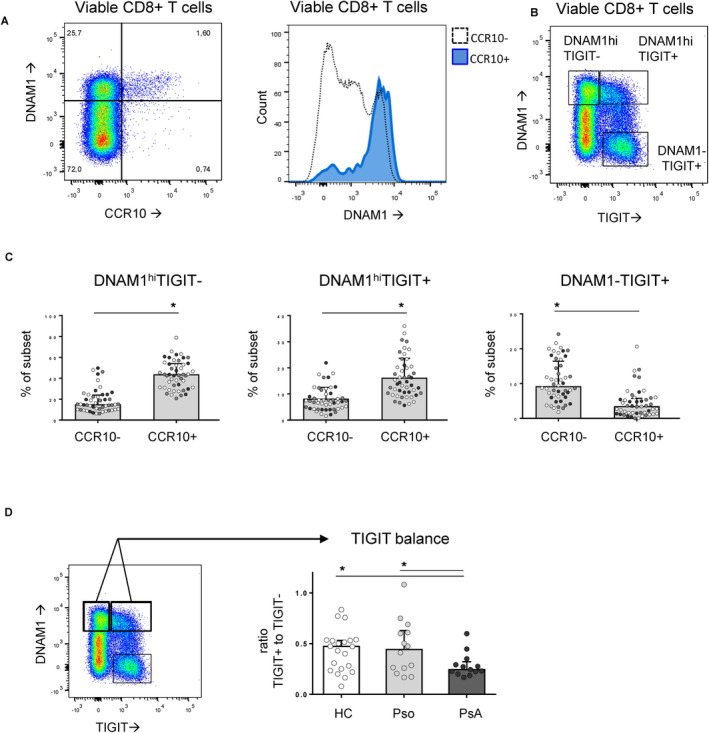
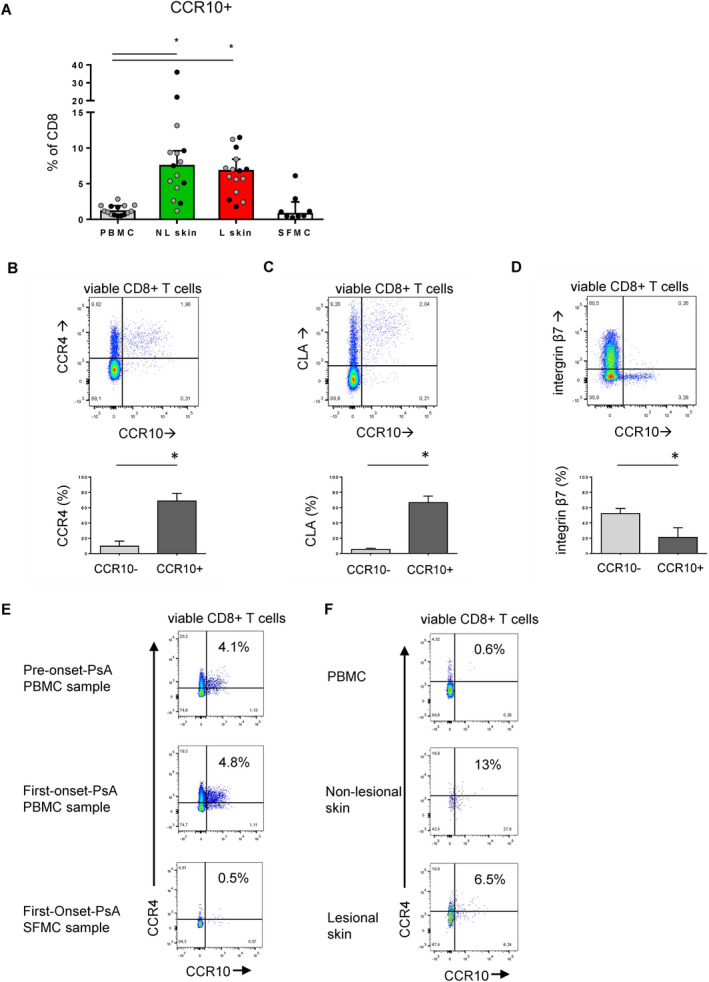
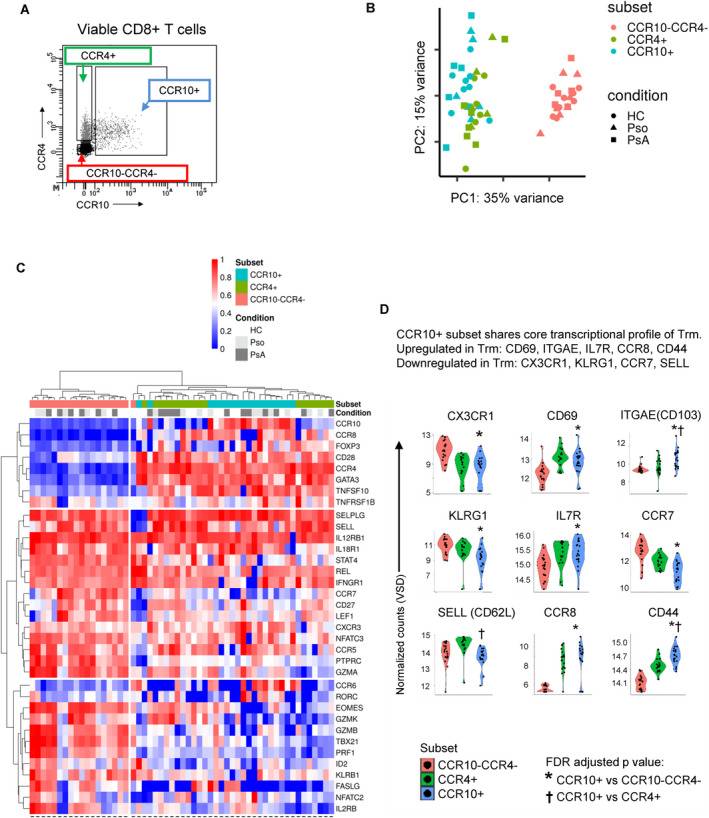
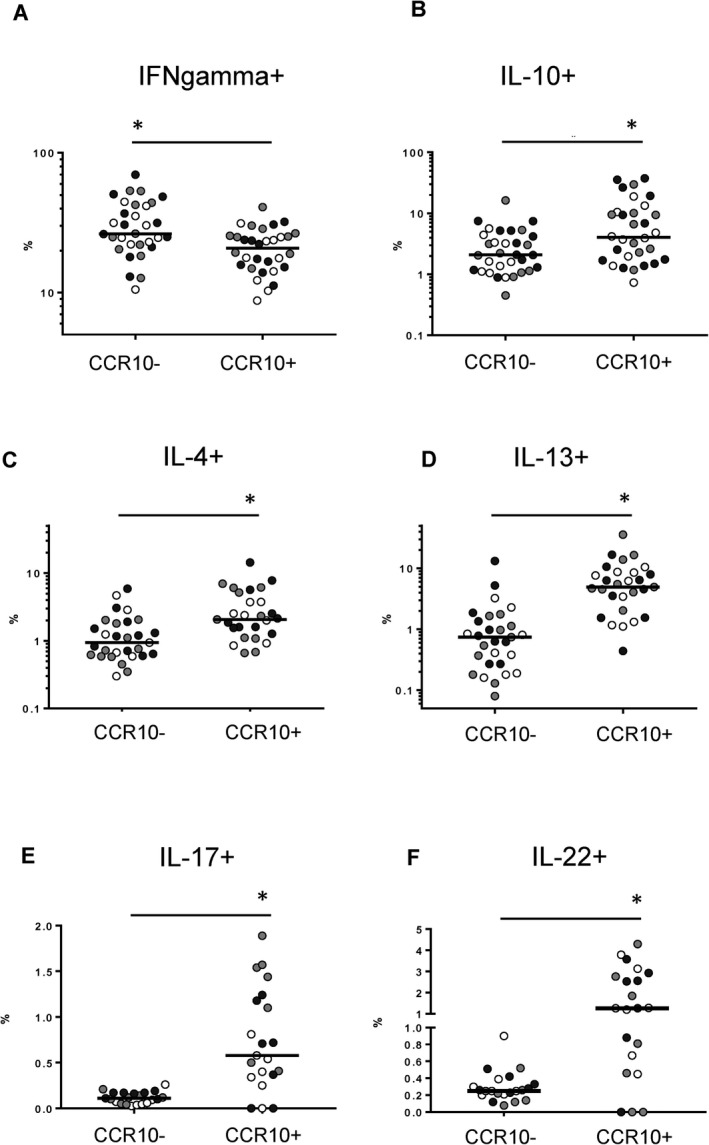
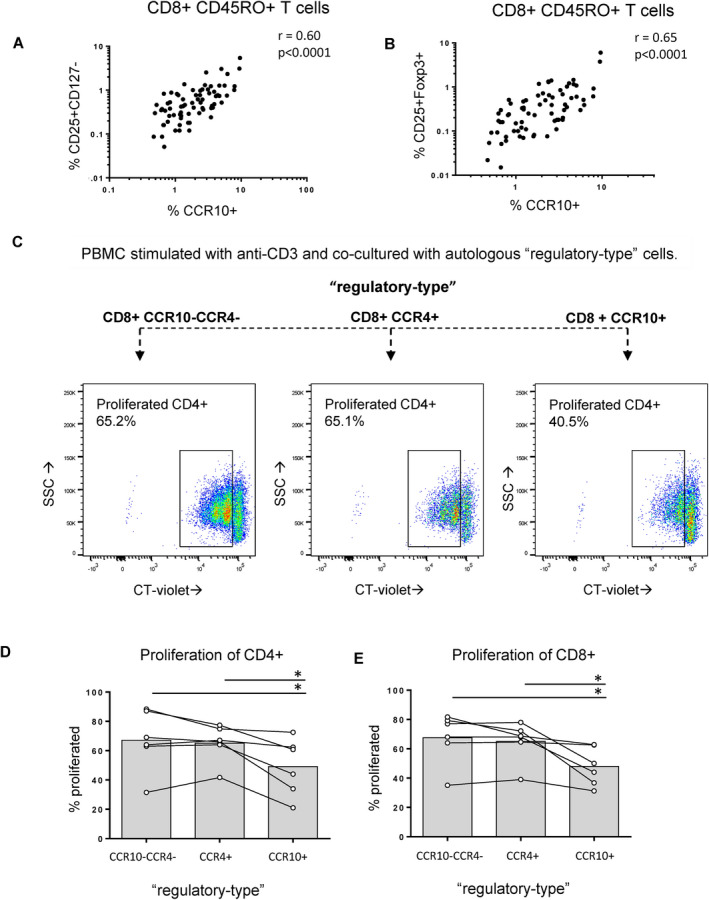
Results: Compared to healthy controls, the peripheral blood of patients with PsA was characterized by an increase in regulatory CD4+ T cells and interleukin-17A (IL-17A) and IL-22 coproducing CD8+ T cells. One population specifically differentiated PsA from psoriasis: i.e., CD8+CCR10+ T cells were enriched in PsA. CD8+CCR10+ T cells expressed high levels of DNAX accessory molecule 1 and were effector memory cells that coexpressed skin-homing receptors CCR4 and cutaneous lymphocyte antigen. CD8+CCR10+ T cells were detected under inflammatory and homeostatic conditions in skin, but were not enriched in SF. Gene profiling further revealed that CD8+CCR10+ T cells expressed GATA3, FOXP3, and core transcriptional signature of tissue-resident memory T cells, including CD103. Specific genes, including RORC, IFNAR1, and ERAP1, were up-regulated in PsA compared to psoriasis. CD8+CCR10+ T cells were endowed with a Tc2/22-like cytokine profile, lacked cytotoxic potential, and displayed overall regulatory function.

Conclusion: Tissue-resident memory CD8+ T cells derived from the skin are enhanced in the circulation of patients with PsA compared to patients with psoriasis alone. This may indicate that aberrances in cutaneous tissue homeostasis contribute to arthritis development.


Figures

Figure 1
Figure 1
Phenotype and function of circulating immune cell subsets in psoriatic arthritis (PsA), and frequencies of T cell and dendritic cell subsets in peripheral blood mononuclear cells. A, Heatmap showing the top 20 flow cytometry features that best distinguished the different groups studied (healthy controls [HCs] and patients with axial spondyloarthritis [AxSpA], psoriasis [Pso], or psoriatic arthritis [PsA]), as assessed by analysis of variance. B, CCR10+ cells within CD8+CD45RO+ T cells. C, IL‐17A+IL‐22+ cells within CD8+ T cells. D, FoxP3+CD25+CD45RO+ cells within CD4+ T cells. E, CD161+CCR6+ cells within CD8+CD45RO+ T cells. F, CD303+ cells within DR+CD14−CD16−cells. Symbols represent individual subjects; bars show the median. * = P < 0.05. IL‐17A = interleukin‐17A.
Figure 2
Figure 2
CD8+CCR10+ T cells are prototypically DNAM‐1high. A, CD8+CCR10+ T cells coexpressed high levels of DNAX accessory molecule 1 (DNAM‐1). B, Distinct populations of CD8+ T cells were distinguishable based on expression of DNAM‐1 and T cell immunoreceptor with Ig and immunoreceptor tyrosine‐based inhibition motif domains (TIGIT), including DNAM‐1highTIGIT−, DNAM‐1highTIGIT+, and DNAM‐1−TIGIT+. C, The majority of CD8+CCR10+ T cells were either DNAM‐1highTIGIT− or DNAM‐1highTIGIT+. D, Within CD8+CCR10+ T cells with high expression of DNAM‐1, TIGIT coexpression was reduced in patients with psoriatic arthritis (PsA). In C and D, symbols represent individual subjects (healthy controls [HCs] [white symbols], patients with psoriasis [Pso] [gray symbols], and patients with PsA [black symbols]); bars show the median and interquartile range. * = P < 0.05. Color figure can be viewed in the online issue, which is available at http://onlinelibrary.wiley.com/doi/10.1002/art.41652/abstract.
Figure 3
Figure 3
Enrichment of CD8+CCR10+ T cells in skin, but not in synovial fluid (SF). A, CD8+CCR10+ T cell frequency in paired nonlesional (NL) skin, lesional (L) skin, and peripheral blood mononuclear cells (PBMCs), and in nonpaired SF mononuclear cells (SFMCs). B–D, Expression of CCR4 (B), cutaneous lymphocyte antigen (CLA) (C), and β7 integrin (D) in CCR10+ versus CD8+CCR10− T cells. E, CD8+CCR10+ T cell frequency in PBMCs from a patient with psoriasis before psoriatic arthritis (PsA) onset and in PBMCs and SFMCs from the same patient at initial PsA onset. F, Frequency of CD8+CCR10+ T cells in paired nonlesional skin, lesional skin, and PBMCs from a patient with PsA. Symbols in A represent individual subjects (patients with psoriasis [Pso] [gray symbols] and patients with PsA (black symbols); bars in A–D show the median and interquartile range. * = P < 0.05. Color figure can be viewed in the online issue, which is available at http://onlinelibrary.wiley.com/doi/10.1002/art.41652/abstract.
Figure 4
Figure 4
CD8+CCR10+ T cells express GATA3 and FOXP3 and exhibit a tissue‐resident memory (Trm) cell profile. A, Three different subsets of CD8+ T cells were flow sorted based on the presence/absence of CCR10 and CCR4. Detailed data regarding the full gating strategy are shown in Supplementary Figure 5 (http://onlinelibrary.wiley.com/doi/10.1002/art.41652/abstract). B, Principal components (PC) analysis was performed based on preselection of 5,268 genes that were differentially expressed in any of the cell subsets (nominal P < 0.05). C, Heatmap shows expression levels, on CD8+ cell subsets from healthy controls (HCs) and patients with psoriasis (Pso) or psoriatic arthritis (PsA), of genes previously reported as being critical for CD8+ T cells. D, Violin plots indicate the main transcriptional features attributed to Trm cells. Expression on the CCR10+ subset was compared to expression on the CCR10−CCR4− subset and the CCR4+ subset. VSD = variance‐stabilized data; FDR = false discovery rate.
Figure 5
Figure 5
CD8+CCR10+ T cells exhibit a Tc2/Tc22‐like cytokine profile. Peripheral blood mononuclear cells were restimulated with phorbol 12‐myristate 13‐acetate and ionomycin calcium salt. The frequency of intracellular production of interferon‐γ (IFNγ) (A), interleukin‐10 (IL‐10) (B), IL‐4 (C), IL‐13 (D), IL‐17 (E), and IL‐22 (F) was compared between CD8+ T cells based on positivity or negativity for CCR10. Symbols represent individual subjects (healthy controls [white symbols], patients with psoriasis [gray symbols], and patients with psoriatic arthritis [black symbols]); bars show the median. * = P < 0.05.
Figure 6
Figure 6
CD8+CCR10+ T cells exhibit regulatory properties. A and B, In peripheral blood mononuclear cells (PBMCs), the ex vivo fraction of memory CD8+ T cells that expressed CCR10 strongly correlated with the ex vivo fraction of CD8+ T cells that were CD25+CD127− (A) and CD25+FoxP3+ (B). Circles indicate pooled data from healthy controls. Additional data are shown in Supplementary Table 1 (http://onlinelibrary.wiley.com/doi/10.1002/art.41652/abstract). C, Examples of suppression assays are shown. Fresh PBMCs from 5 healthy controls were incubated with CellTrace Violet (CT‐violet) and cocultured with different CD8+ T cell subsets. Data regarding the gating strategy used for flow sorting are shown in Supplementary Figure 5, http://onlinelibrary.wiley.com/doi/10.1002/art.41652/abstract). D and E, The suppressive effect on CD4+ (D) and CD8+ (E) T cell proliferation was determined on day 4. Symbols represent individual subjects; bars show the median.* = P < 0.05. Color figure can be viewed in the online issue, which is available at http://onlinelibrary.wiley.com/doi/10.1002/art.41652/abstract.

References

    1. Veale DJ, Fearon U. The pathogenesis of psoriatic arthritis. Lancet 2018;391:2273–84. - PubMed
    1. Ritchlin CT, Colbert RA, Gladman DD. Psoriatic arthritis. N Engl J Med 2017;376:957–70. - PubMed
    1. Sakkas LI, Bogdanos DP. Are psoriasis and psoriatic arthritis the same disease? The IL‐23/IL‐17 axis data [review]. Autoimmun Rev 2017;16:10–5. - PubMed
    1. Boehncke WH. Psoriasis and psoriatic arthritis: flip sides of the coin? Acta Derm Venereol 2016;96:436–41. - PubMed
    1. McGonagle D, Aydin SZ, Gül A, Mahr A, Direskeneli H. ’MHC‐I‐opathy’‐unified concept for spondyloarthritis and Behçet disease [review]. Nat Rev Rheumatol 2015;11:731–40. - PubMed

MeSH terms

Substances