

CircPVT1 promotes progression in clear cell renal cell carcinoma by sponging miR-145-5p and regulating TBX15 expression
- PMID: 33453148
- PMCID: PMC8019224
- DOI: 10.1111/cas.14814
CircPVT1 promotes progression in clear cell renal cell carcinoma by sponging miR-145-5p and regulating TBX15 expression
Abstract
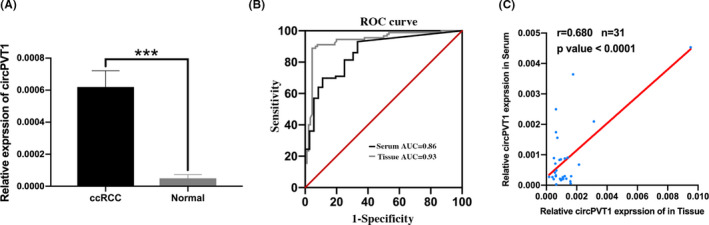
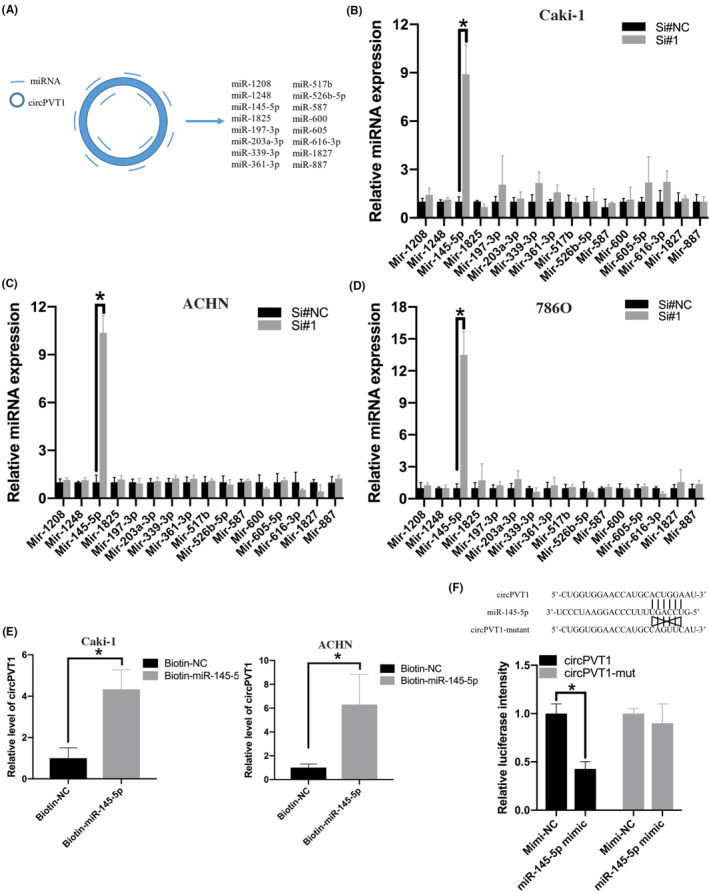
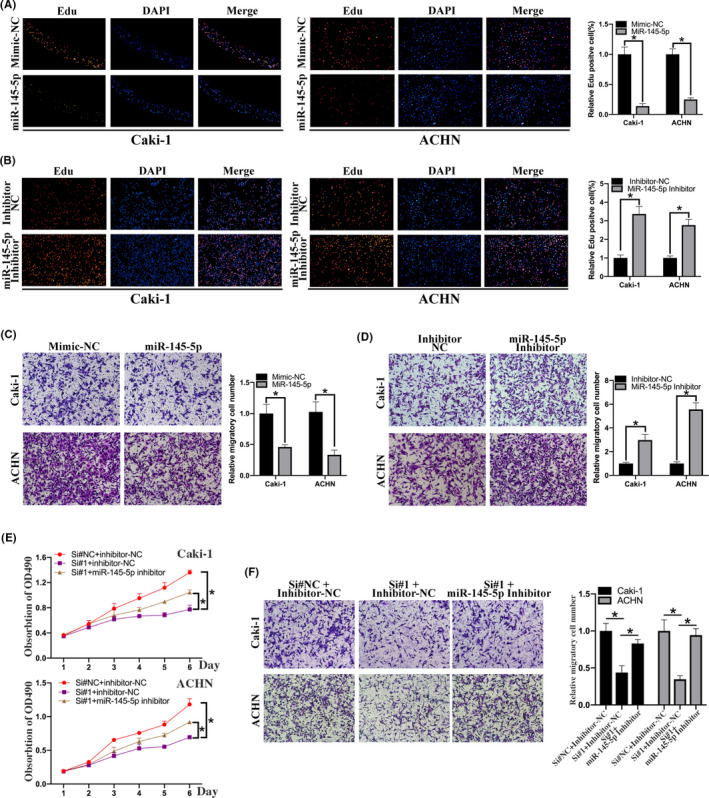
Emerging evidence revealed that circular RNAs (circRNAs) play significant roles in regulating tumorigenesis and cancer progression. However, few circRNAs were well characterized in clear cell renal cell carcinoma (ccRCC). We found that circPVT1 was significantly upregulated in ccRCC tissues and positively associated with the clinical stage. The Area Under Curve of tissue and serum circPVT1 expression in ccRCC were 0.93 and 0.86, respectively. Importantly, we demonstrated that circPVT1 promoted ccRCC growth and metastasis in vitro and in vivo. We also found that circPVT1 directly binds to miRNA-145-5p via the Biotin-labelled miRNA pulldown assay and dual-luciferase reporter assay, and miR-145-5p inhibitor significantly attenuated the effect of circPVT1 knockdown on ccRCC cells. Moreover, through RNA sequencing and bioinformatics analysis, we demonstrated that TBX15 was regulated by the circPVT1/miR-145-5p axis and predicted poor prognosis in ccRCC. These findings suggest that circPVT1 promotes ccRCC growth and metastasis through sponging miR-145-5p and regulating downstream target TBX15 expression. The circPVT1/miR-145-5p/TBX15 axis might be a potential diagnostic marker and therapeutic target in ccRCC.
Keywords: ccRCC; circPVT1; invasion; miR-145-5p; proliferation.
© 2021 The Authors. Cancer Science published by John Wiley & Sons Australia, Ltd on behalf of Japanese Cancer Association.
Conflict of interest statement
The authors have no conflict of interest.
Figures


Similar articles
-
MiR-212-5p inhibits the malignant behavior of clear cell renal cell carcinoma cells by targeting TBX15.Eur Rev Med Pharmacol Sci. 2019 Dec;23(24):10699-10707. doi: 10.26355/eurrev_201912_19770. Eur Rev Med Pharmacol Sci. 2019. PMID: 31858538
-
LINC01232 serves as a novel biomarker and promotes tumour progression by sponging miR-204-5p and upregulating RAB22A in clear cell renal cell carcinoma.Ann Med. 2021 Dec;53(1):2153-2164. doi: 10.1080/07853890.2021.2001563. Ann Med. 2021. PMID: 34783622 Free PMC article.
-
Long non-coding RNA ZFAS1 promotes proliferation and metastasis of clear cell renal cell carcinoma via targeting miR-10a/SKA1 pathway.Biomed Pharmacother. 2019 Mar;111:917-925. doi: 10.1016/j.biopha.2018.12.143. Epub 2019 Jan 7. Biomed Pharmacother. 2019. PMID: 30841471
-
The Emerging Roles of CircPVT1 in Cancer Progression.Curr Pharm Biotechnol. 2025;26(1):1-8. doi: 10.2174/0113892010282141240226112253. Curr Pharm Biotechnol. 2025. PMID: 38454774 Review.
-
A Concise Review on the Role of CircPVT1 in Tumorigenesis, Drug Sensitivity, and Cancer Prognosis.Front Oncol. 2021 Nov 4;11:762960. doi: 10.3389/fonc.2021.762960. eCollection 2021. Front Oncol. 2021. PMID: 34804965 Free PMC article. Review.
Cited by
-
Regulation mechanism and pathogenic role of lncRNA plasmacytoma variant translocation 1 (PVT1) in human diseases.Genes Dis. 2022 Jun 29;10(3):901-914. doi: 10.1016/j.gendis.2022.05.037. eCollection 2023 May. Genes Dis. 2022. PMID: 37396533 Free PMC article. Review.
-
Role of the circular RNAs/microRNA/messenger RNA axis in renal cell carcinoma: From gene regulation to metabolism and immunity.iScience. 2025 Mar 11;28(4):112183. doi: 10.1016/j.isci.2025.112183. eCollection 2025 Apr 18. iScience. 2025. PMID: 40212586 Free PMC article. Review.
-
Role of miRNA‑145‑5p in cancer (Review).Oncol Rep. 2025 Mar;53(3):39. doi: 10.3892/or.2025.8872. Epub 2025 Jan 31. Oncol Rep. 2025. PMID: 39886965 Free PMC article. Review.
-
Integrative Analysis of Epigenome and Transcriptome Data Reveals Aberrantly Methylated Promoters and Enhancers in Hepatocellular Carcinoma.Front Oncol. 2021 Nov 10;11:769390. doi: 10.3389/fonc.2021.769390. eCollection 2021. Front Oncol. 2021. PMID: 34858848 Free PMC article.
-
Unlocking the potential of non-coding RNAs in cancer research and therapy.Transl Oncol. 2023 Sep;35:101730. doi: 10.1016/j.tranon.2023.101730. Epub 2023 Jul 3. Transl Oncol. 2023. PMID: 37406550 Free PMC article.
References
-
- Capitanio U, Montorsi F. Renal cancer. Lancet. 2016;387:894‐906. - PubMed
-
- Siegel RL, Miller KD, Jemal A. Cancer statistics, 2016. CA Cancer J Clin. 2016;66:7‐30. - PubMed
-
- Rini BI, Campbell SC, Escudier B. Renal cell carcinoma. Lancet. 2009;373:1119‐1132. - PubMed
-
- Leibovich BC, Lohse CM, Crispen PL, et al. Histological subtype is an independent predictor of outcome for patients with renal cell carcinoma. J Urol. 2010;183:1309‐1315. - PubMed
-
- Beermann J, Piccoli MT, Viereck J, Thum T. Non‐coding RNAs in development and disease: background, mechanisms, and therapeutic approaches. Physiol Rev. 2016;96:1297‐1325. - PubMed
MeSH terms
Substances
Grants and funding
LinkOut - more resources
Full Text Sources
Other Literature Sources
Medical
