. 2021 Apr 1;28(4):764-778.e4.
doi: 10.1016/j.stem.2020.12.004. Epub 2021 Jan 15.

Single-cell analysis of the developing human testis reveals somatic niche cell specification and fetal germline stem cell establishment

Affiliations

Single-cell analysis of the developing human testis reveals somatic niche cell specification and fetal germline stem cell establishment

Jingtao Guo et al. Cell Stem Cell. .

Abstract

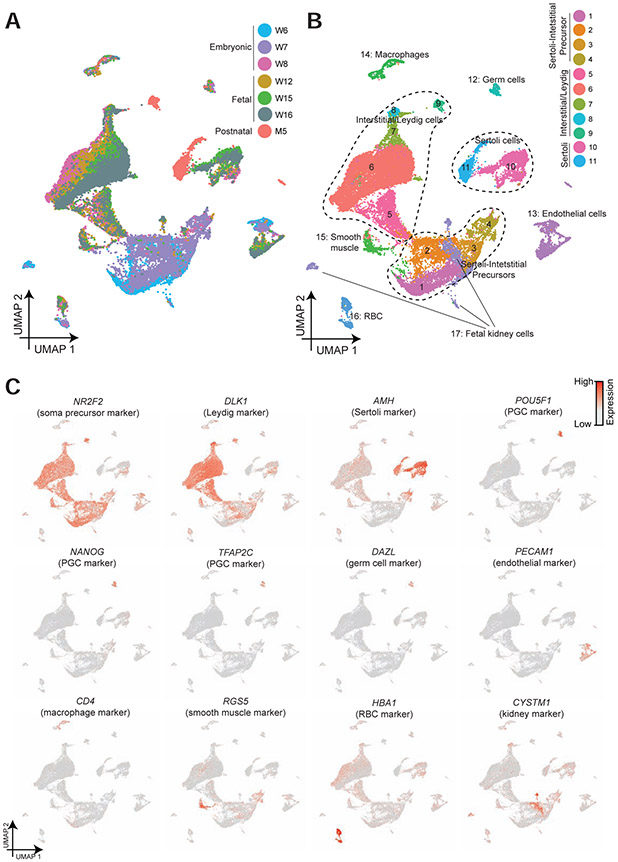
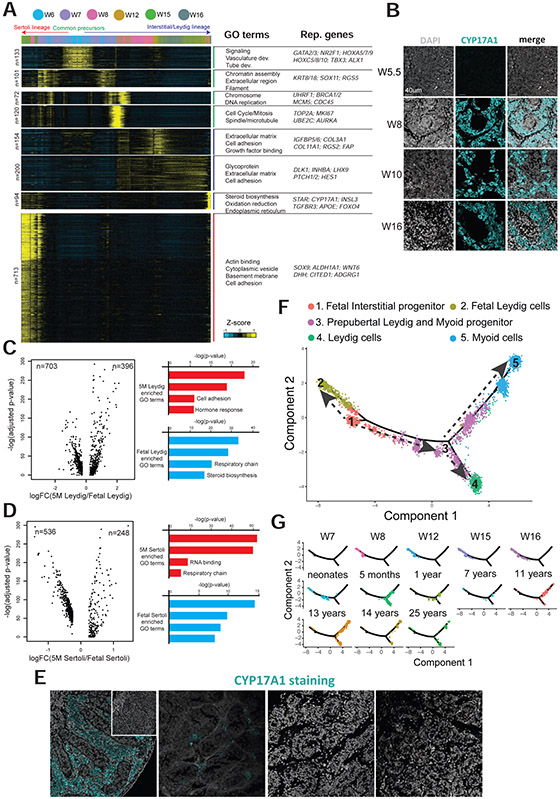
Human testis development in prenatal life involves complex changes in germline and somatic cell identity. To better understand, we profiled and analyzed ∼32,500 single-cell transcriptomes of testicular cells from embryonic, fetal, and infant stages. Our data show that at 6-7 weeks postfertilization, as the testicular cords are established, the Sertoli and interstitial cells originate from a common heterogeneous progenitor pool, which then resolves into fetal Sertoli cells (expressing tube-forming genes) or interstitial cells (including Leydig-lineage cells expressing steroidogenesis genes). Almost 10 weeks later, beginning at 14-16 weeks postfertilization, the male primordial germ cells exit mitosis, downregulate pluripotent transcription factors, and transition into cells that strongly resemble the state 0 spermatogonia originally defined in the infant and adult testes. Therefore, we called these fetal spermatogonia "state f0." Overall, we reveal multiple insights into the coordinated and temporal development of the embryonic, fetal, and postnatal male germline together with the somatic niche.

Keywords: Leydig cell; Sertoli cell; fetal testis development; interstitial cell; primordial germ cell; single-cell RNA sequencing; spermatogonial stem cell.


Conflict of interest statement

Declaration of interests The authors declare no competing interests.

Figures

Figure 1.
Figure 1.. Single cell transcriptome profiling and analysis of the human fetal and postnatal testis
(A) Dimension reduction presentation (via UMAP) of combined single-cell transcriptome data from embryonic, fetal and infant human testes (n=30,045). Each dot represents a single cell and is colored according to its age/donor of origin. (B) Dimension reduction presentation of combined single-cell transcriptome data from (Fig 1A) labeled with corresponding cell categories and colored according to its cell type identity. (C) Expression patterns of selected markers projected on the UMAP plot (Fig 1A). For each cell cluster, one cell marker is shown in the main figure accompanied by a gallery of additional markers in Figure S2. See also Figures S1 and S2.
Figure 2.
Figure 2.. Gene expression dynamic during the development of human PGCs to adult spermatogonia
(A) Focused analysis (t-SNE and pseudotime) of the profiled germ cells (Cluster 12 from Figure 1B) combined with infant germ cells and adult spermatogonia States (from Guo et al., 2018) revealed a single pseudo-developmental trajectory for germ cell development from embryo to adult. Cells are colored based on the ages of the donors. (B) Expression patterns of known PGC and germ cell markers projected onto the tSNE plot from Figure 2A. (C) K-means clustering of genes exhibiting differential expression (n=2448) along the germ cell pseudo-developmental trajectory. Each row represents a gene, and each column represents a single cell, with columns/cells placed in pseudotime order defined in Figure 2A. Differential gene expression levels utilize a Z-score as defined by the color key; associated GO terms (using DAVID v6.7) are given on the right of the corresponding gene clusters. D) Protein co-immunofluorescence for markers of proliferation (MKI67, yellow), pluripotency (NANOG, magenta) and germ cells (DDX4, cyan) in samples from 5 to 19 weeks, and their corresponding quantification. (E) Protein co-immunofluorescence for germ cell (DDX4) and State 0 (PIWIL4) markers in samples from 8 to 17 weeks. (F) Quantification of the proportion of PIWIL4+ germ cells (DDX4+) in W12-W16 fetal testis samples. At least 100 cells per replicate and 3 replicates were counted. Each replicate was from a unique donor. Data show the mean ± SEM (One-way ANOVA followed by a Tukey's post-test). Adjusted P-values *=0.0136;**=0.0048;***≤0.0008. See also Figures S3, S4 and Table S1.
Figure 3.
Figure 3.. The specification of interstitial and Sertoli lineages
(A) Focused analysis (UMAP and pseudotime) of the testicular niche cells (Clusters 1-11 from Figure 1B), with cells colored according to ages of the donors. (B) Deconvolution of the plot in Figure 3A according to the ages of donors. (C) Focused analysis (in Figure 3A) of the testicular niche cells (Clusters 1-11 from Figure 1B), with cells colored according to ages/donors of origin. (D) Expression patterns of known progenitor, interstitial/Leydig and Sertoli markers projected onto the plot from Figure 3A. See also Figure S5.
Figure 4.
Figure 4.. Gene expression dynamic during specification of interstitial and Sertoli lineages
(A) K-means clustering of genes exhibiting differential expression (n=1578) along interstitial/Leydig and Sertoli specification. Each row represents a gene, and each column represents a single cell, with columns/cells placed in pseudotime order defined in Figure 3A. Differential gene expression levels utilize a Z score as defined by the color key; associated GO terms (using DAVID v6.7) are given on the right of the corresponding gene clusters. (B) Immunostaining of Leydig marker, CYP17A1 (cyan), in samples from 5 to 16 weeks. (C-D) Analysis to reveal differentially expressed genes during Leydig (Fig 4C) or Sertoli (Fig 4D) cell differentiation from fetal to infant stages. Violin plot on the left of each panel display the fold change (x-axis) and adjusted p value (y-axis). Right part of each panel represents the enriched gene ontology terms and the associated p-value. (E) Immunostaining of Leydig marker, CYP17A1 (cyan), in fetal and postnatal testis samples. (F) Pseudotime trajectory (combined Monocle analysis) of fetal interstitial cells, prepubertal Leydig/myoid cells and the adult Leydig and myoid cells. Cells are colored according to their predicted locations along pseudotime. Neonatal data were from Sohni et al., 2019, 1 year and 25 year old data were from Guo et al., 2018, and 7-14 year old data were from Guo et al., 2020. (G) Deconvolution of the Monocle pseudotime plot according to ages/donors of origin. See also Figure S6 ant Table S2.
Figure 5.
Figure 5.. Key transcription factors involving the specification of interstitial and Sertoli cells
(A) Principal component analysis of testicular niche progenitors from 6- and 7 weeks cells, revealing the existence of interstitial/Leydig and Sertoli lineage bifurcation. (B) Expression patterns of key factors that show specific patterns during the progenitor differentiation. (C) Staining of transcription factors GATA3 (cyan) in the 5- and 8-week samples. (D) Staining of transcription factors GATA4 (cyan) in the 6- and 17-week samples. (E) Co-staining of Sertoli (DMRT1, magenta) and germ cell (DDX4, cyan) markers in the 5- and 8-week samples. (F) Co-staining of two Sertoli cell markers, DMRT1 and SOX9, in the 5.5- to 17-week samples. See also Figure S6.
Figure 6.
Figure 6.. Proposed models for human germline development and somatic niche cell specification during prenatal and postnatal stages.
(A) Schematic summarizing the combined gene expression programs and cellular events accompanying human PGCs differentiation into adult SSCs. (B) The timeline and proposed model for human testicular somatic niche cell development at embryonic, fetal and postnatal stages. Specification of a unique progenitor cell population towards Sertoli and interstitial/Leydig lineages begins at around 7 weeks post fertilization, when the cord formation occurs.

References

    1. Borgmann J, Tüttelmann F, Dworniczak B, Röpke A, Song H-W, Kliesch S, Wilkinson MF, Laurentino S, and Gromoll J (2016). The human RHOX gene cluster: target genes and functional analysis of gene variants in infertile men. Hum Mol Genet 25, 4898–4910. - PMC - PubMed
    1. Butler A, Hoffman P, Smibert P, Papalexi E, and Satija R (2018). Integrating single-cell transcriptomic data across different conditions, technologies, and species. Nat Biotechnol 36, 411–420. - PMC - PubMed
    1. Chen D, Sun N, Hou L, Kim R, Faith J, Aslanyan M, Tao Y, Zheng Y, Fu J, Liu W, et al. (2019). Human Primordial Germ Cells Are Specified from Lineage-Primed Progenitors. Cell Reports 29, 4568–4582.e5. - PMC - PubMed
    1. Gkountela S, Li Z, Vincent JJ, Zhang KX, Chen A, Pellegrini M, and Clark AT (2013). The ontogeny of cKIT+ human primordial germ cells: A resource for human germ line reprogramming, imprint erasure and in vitro differentiation. Nat Cell Biol 15, 113–122. - PMC - PubMed
    1. Gkountela S, Zhang KX, Shafiq TA, Liao W-W, Hargan-Calvopiña J, Chen P-Y, and Clark AT (2015). DNA Demethylation Dynamics in the Human Prenatal Germline. Cell 161, 1425–1436. - PMC - PubMed

Publication types