

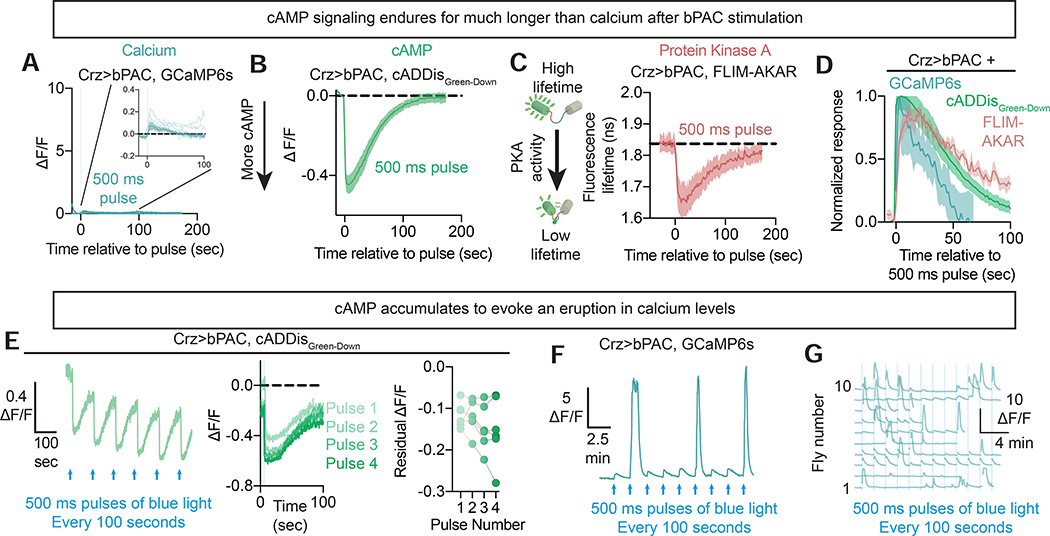
Biochemical evidence accumulates across neurons to drive a network-level eruption
- PMID: 33453167
- PMCID: PMC7924971
- DOI: 10.1016/j.molcel.2020.12.029
Biochemical evidence accumulates across neurons to drive a network-level eruption
Abstract
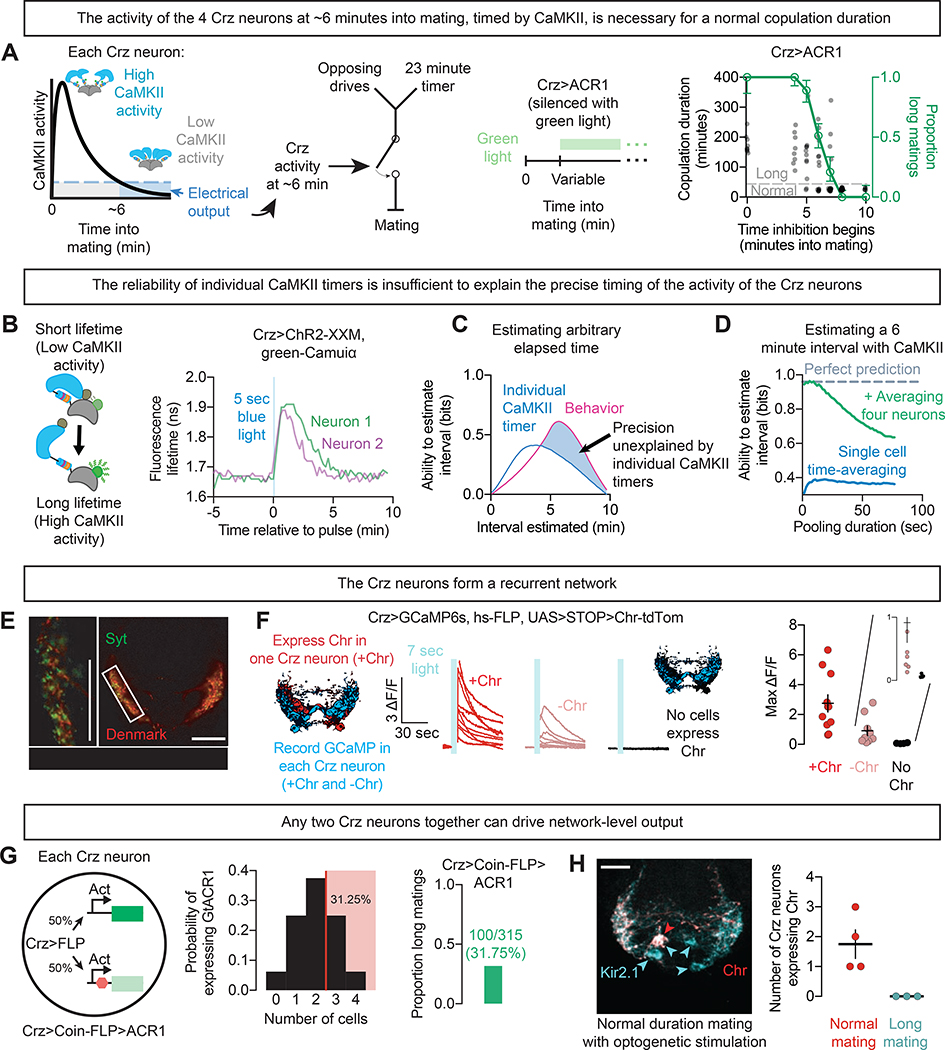
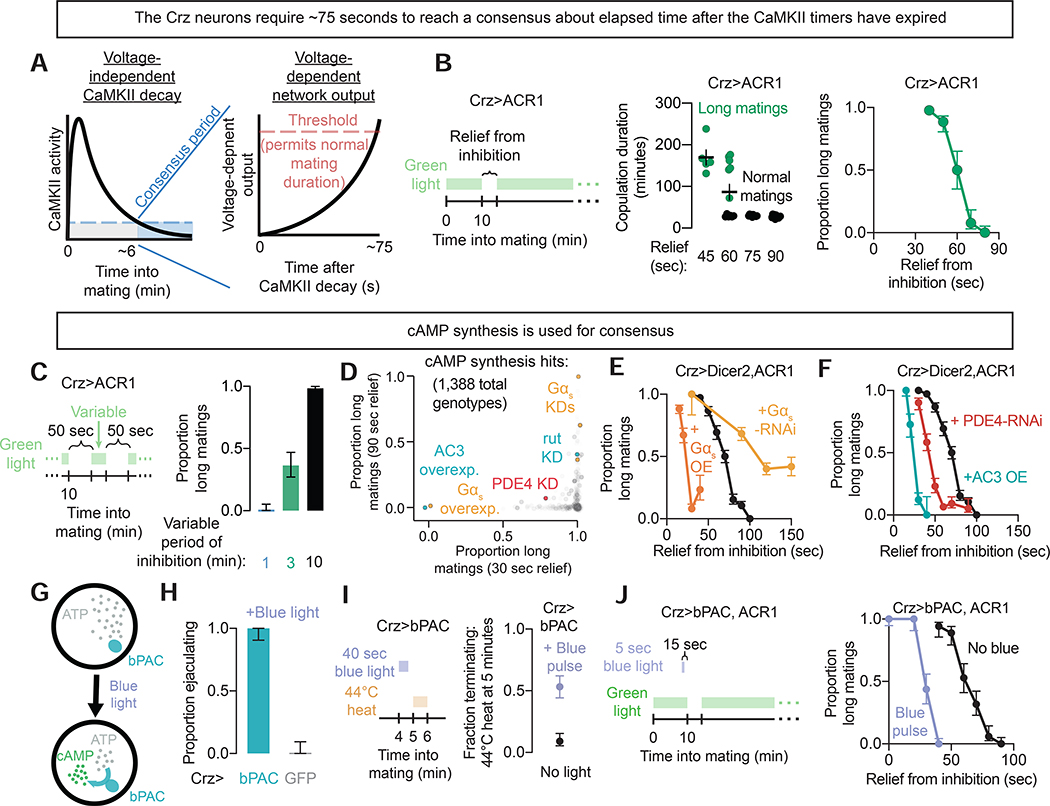
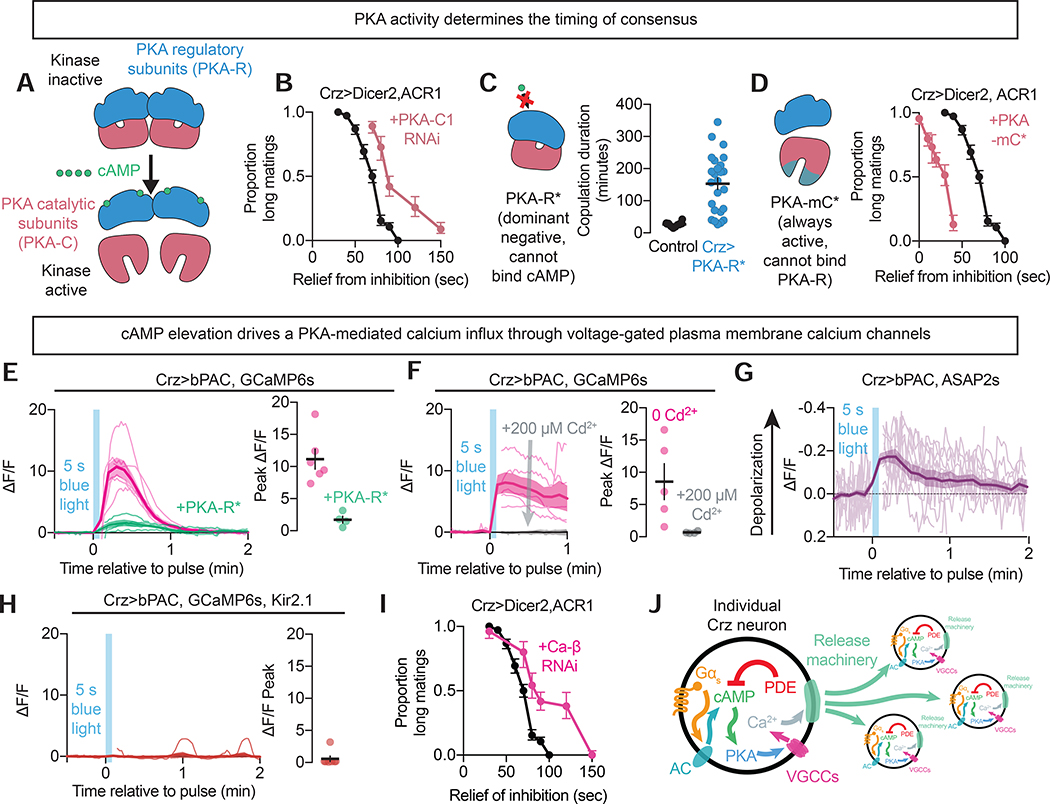
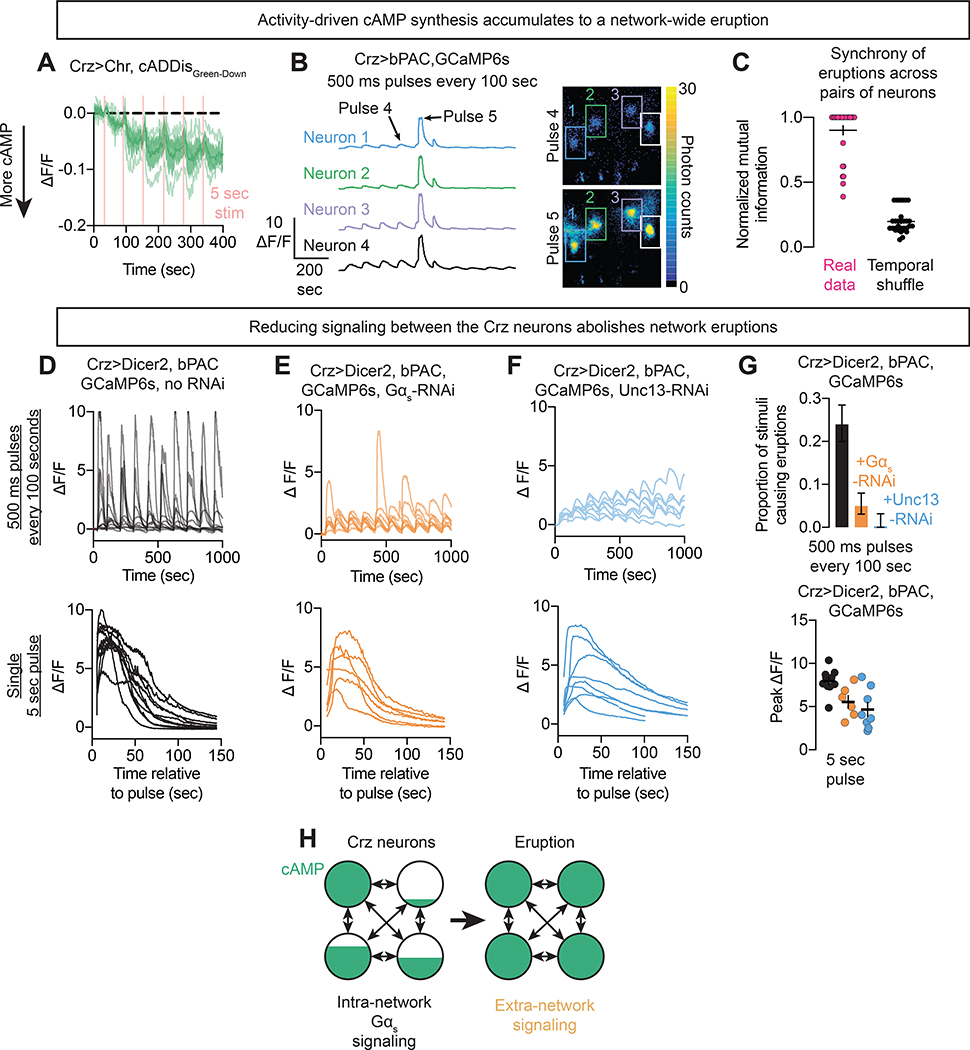
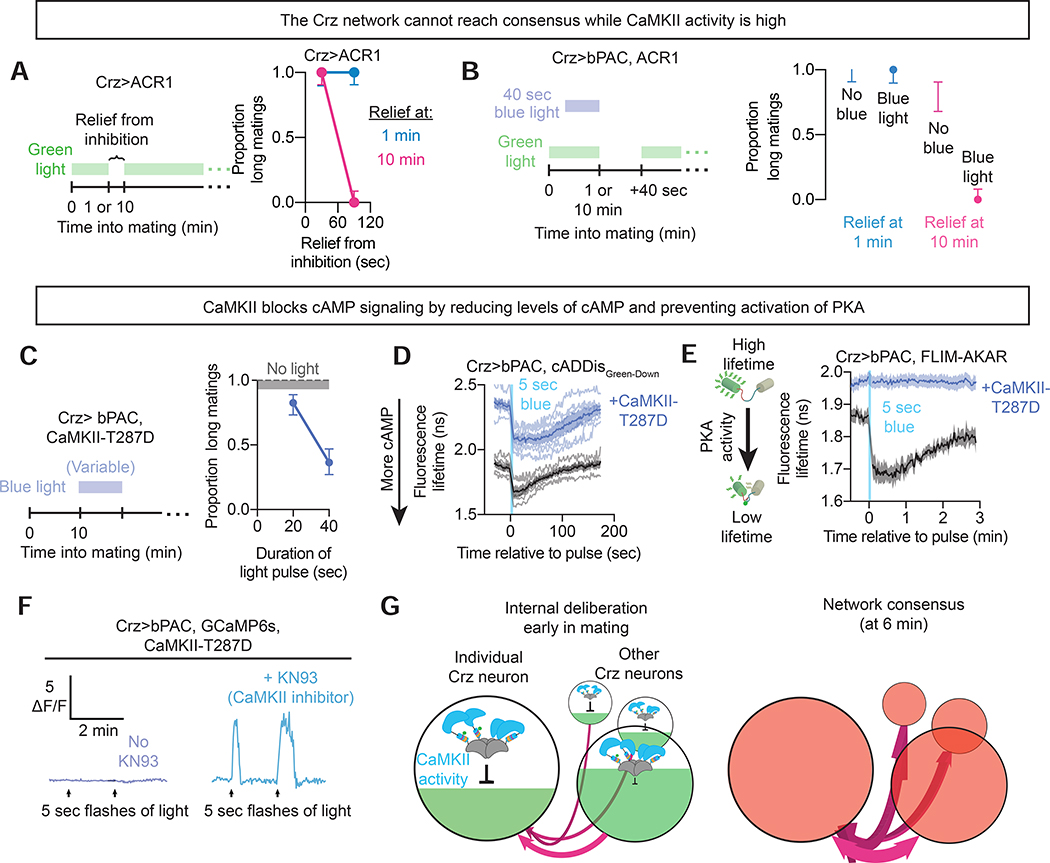
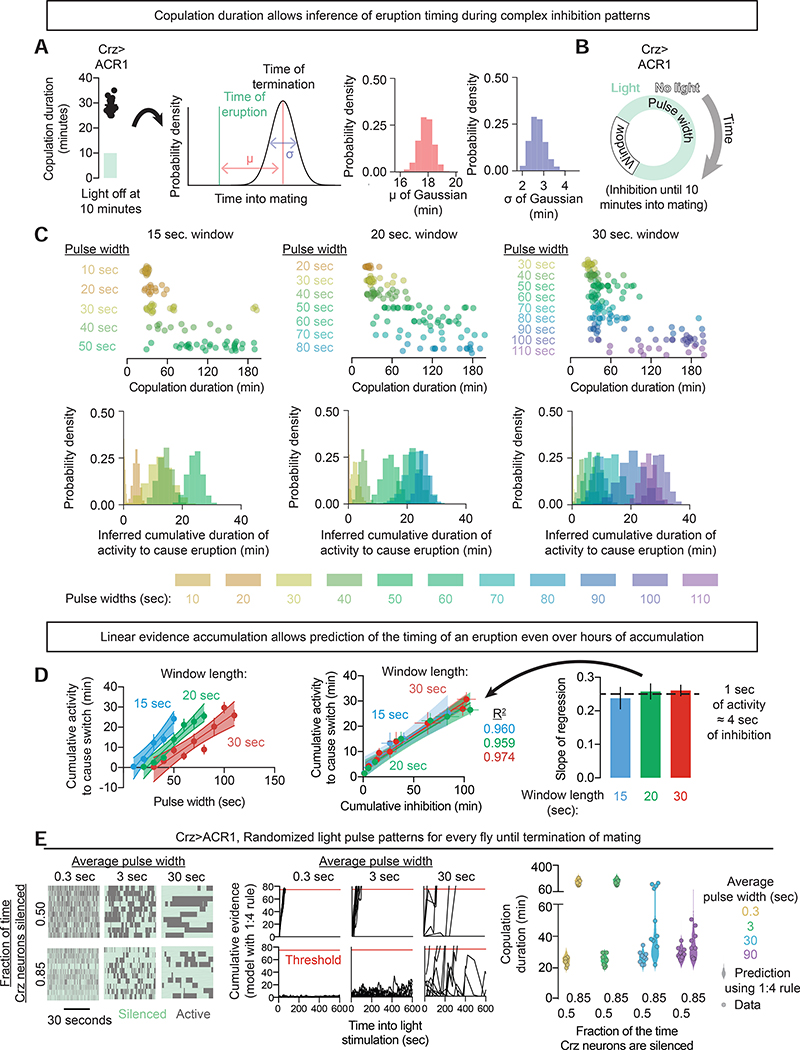
Neural network computations are usually assumed to emerge from patterns of fast electrical activity. Challenging this view, we show that a male fly's decision to persist in mating hinges on a biochemical computation that enables processing over minutes to hours. Each neuron in a recurrent network contains slightly different internal molecular estimates of mating progress. Protein kinase A (PKA) activity contrasts this internal measurement with input from the other neurons to represent accumulated evidence that the goal of the network has been achieved. When consensus is reached, PKA pushes the network toward a large-scale and synchronized burst of calcium influx that we call an eruption. Eruptions transform continuous deliberation within the network into an all-or-nothing output, after which the male will no longer sacrifice his life to continue mating. Here, biochemical activity, invisible to most large-scale recording techniques, is the key computational currency directing behavior and motivational state.
Keywords: Drosophila; FLIM; PKA; cAMP; eruption; evidence accumulation; motivation; neural networks; sexual behavior; time.
Copyright © 2020 Elsevier Inc. All rights reserved.
Conflict of interest statement
Declaration of interests The authors declare no competing interests.
Figures
References
-
- Abbott LF (2006). Where Are the Switches on This Thing? In 23 Problems in Systems Neuroscience, pp. 423–431.
Publication types
MeSH terms
Substances
Grants and funding
LinkOut - more resources
Full Text Sources
Other Literature Sources
Molecular Biology Databases
Miscellaneous
