

Host Cxcr2-Dependent Regulation of Pancreatic Cancer Growth, Angiogenesis, and Metastasis
- PMID: 33453178
- PMCID: PMC8027924
- DOI: 10.1016/j.ajpath.2021.01.002
Host Cxcr2-Dependent Regulation of Pancreatic Cancer Growth, Angiogenesis, and Metastasis
Abstract
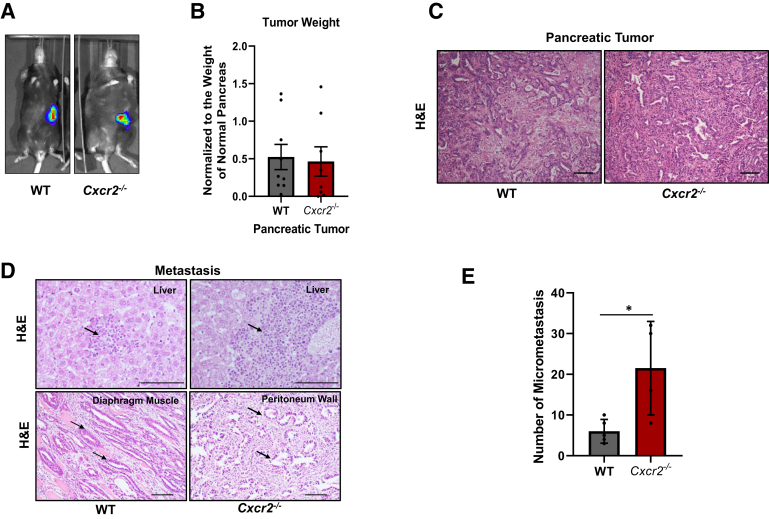
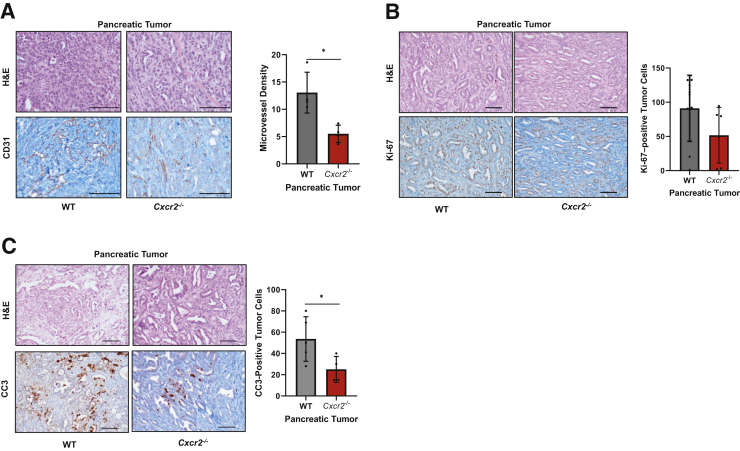
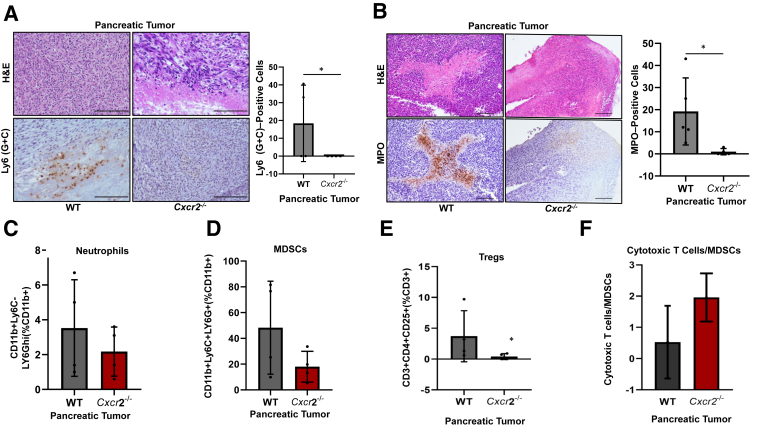
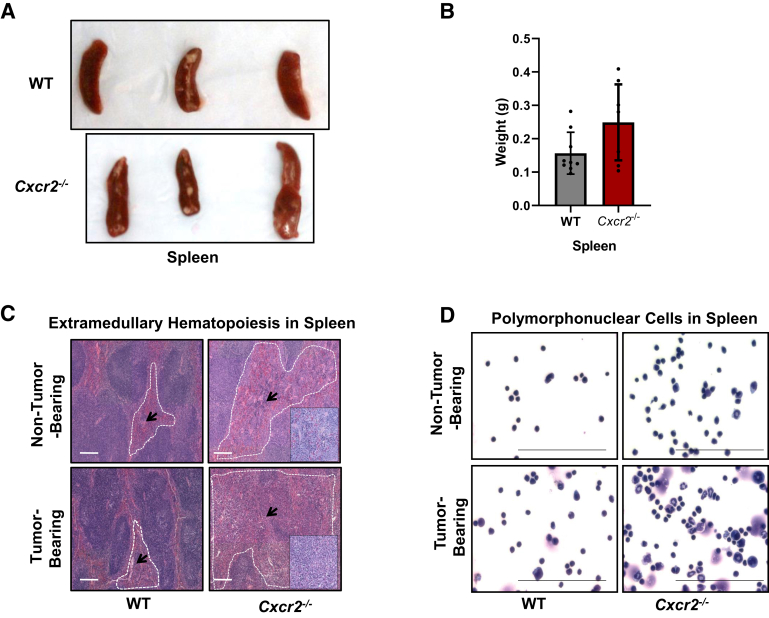
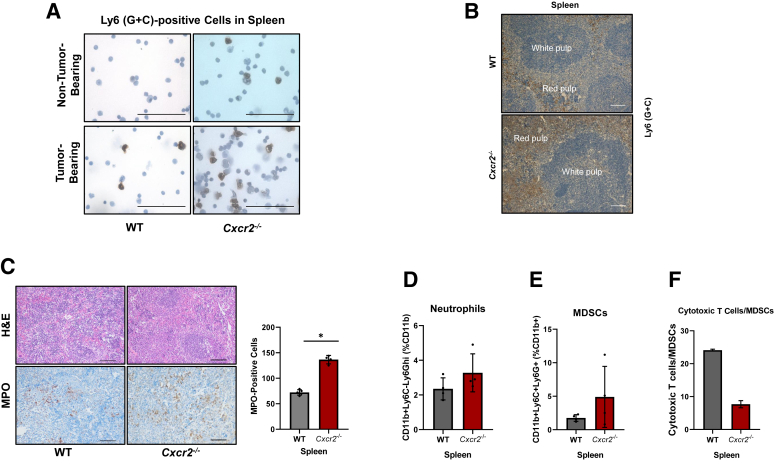
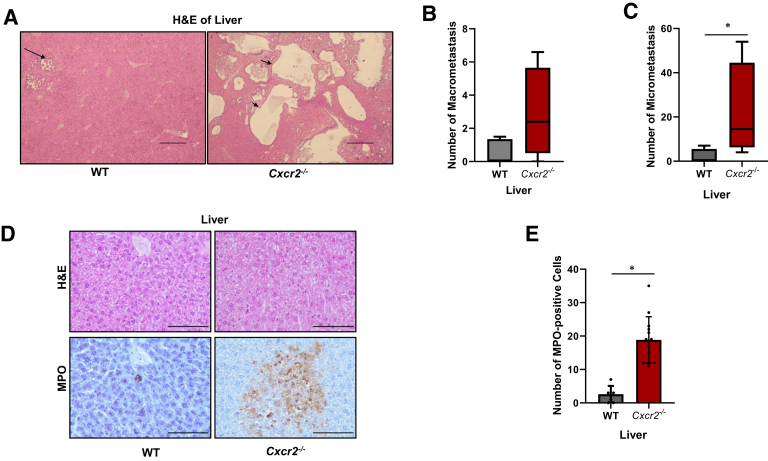
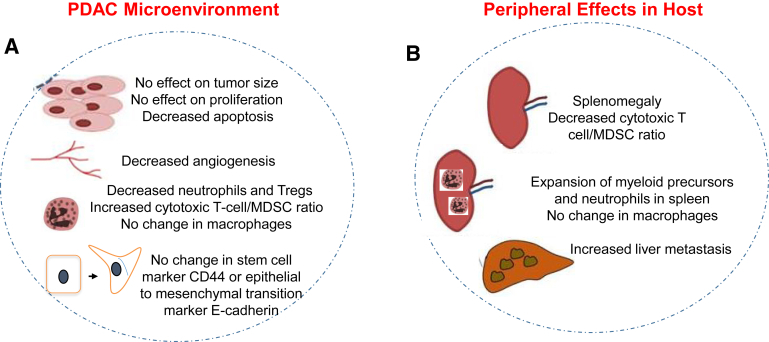
Pancreatic ductal adenocarcinoma (PDAC) manifests aggressive tumor growth and early metastasis. Crucial steps in tumor growth and metastasis are survival, angiogenesis, invasion, and immunosuppression. Our prior research showed that chemokine CXC- receptor-2 (CXCR2) is expressed on endothelial cells, innate immune cells, and fibroblasts, and regulates angiogenesis and immune responses. Here, we examined whether tumor angiogenesis, growth, and metastasis of CXCR2 ligands expressing PDAC cells are regulated in vivo by a host CXCR2-dependent mechanism. C57BL6 Cxcr2-/- mice were generated following crosses between Cxcr2-/+ female and Cxcr2-/- male. Cxcr2 ligands expressing Kirsten rat sarcoma (KRAS-PDAC) cells were orthotopically implanted in the pancreas of wild-type or Cxcr2-/- C57BL6 mice. No significant difference in PDAC tumor growth was observed. Host Cxcr2 loss led to an inhibition in microvessel density in PDAC tumors. Interestingly, an enhanced spontaneous and experimental liver metastasis was observed in Cxcr2-/- mice compared with wild-type mice. Increased metastasis in Cxcr2-/- mice was associated with an increase in extramedullary hematopoiesis and expansion of neutrophils and immature myeloid precursor cells in the spleen of tumor-bearing mice. These data suggest a dynamic role of host CXCR2 axis in regulating tumor immune suppression, tumor growth, and metastasis.
Copyright © 2021 American Society for Investigative Pathology. Published by Elsevier Inc. All rights reserved.
Figures
Similar articles
-
Host Cxcr2-dependent regulation of mammary tumor growth and metastasis.Clin Exp Metastasis. 2015 Jan;32(1):65-72. doi: 10.1007/s10585-014-9691-0. Epub 2014 Dec 16. Clin Exp Metastasis. 2015. PMID: 25511644 Free PMC article.
-
CXCR2 signaling promotes secretory cancer-associated fibroblasts in pancreatic ductal adenocarcinoma.FASEB J. 2020 Jul;34(7):9405-9418. doi: 10.1096/fj.201902990R. Epub 2020 May 26. FASEB J. 2020. PMID: 32453916 Free PMC article.
-
Inhibiting Cxcr2 disrupts tumor-stromal interactions and improves survival in a mouse model of pancreatic ductal adenocarcinoma.J Clin Invest. 2011 Oct;121(10):4106-17. doi: 10.1172/JCI42754. Epub 2011 Sep 19. J Clin Invest. 2011. PMID: 21926469 Free PMC article.
-
CXCR2 and RET single nucleotide polymorphisms in pancreatic cancer.World J Surg. 2009 Apr;33(4):710-5. doi: 10.1007/s00268-008-9826-z. World J Surg. 2009. PMID: 19057948 Review.
-
Potential roles and targeted therapy of the CXCLs/CXCR2 axis in cancer and inflammatory diseases.Biochim Biophys Acta Rev Cancer. 2019 Apr;1871(2):289-312. doi: 10.1016/j.bbcan.2019.01.005. Epub 2019 Jan 29. Biochim Biophys Acta Rev Cancer. 2019. PMID: 30703432 Review.
Cited by
-
The Involvement of Cysteine-X-Cysteine Motif Chemokine Receptors in Skin Homeostasis and the Pathogenesis of Allergic Contact Dermatitis and Psoriasis.Int J Mol Sci. 2024 Jan 13;25(2):1005. doi: 10.3390/ijms25021005. Int J Mol Sci. 2024. PMID: 38256077 Free PMC article. Review.
-
Cancer-Associated Fibroblasts and Tumor Cells in Pancreatic Cancer Microenvironment and Metastasis: Paracrine Regulators, Reciprocation and Exosomes.Cancers (Basel). 2022 Jan 31;14(3):744. doi: 10.3390/cancers14030744. Cancers (Basel). 2022. PMID: 35159011 Free PMC article. Review.
-
Small Molecule Targeting Immune Cells: A Novel Approach for Cancer Treatment.Biomedicines. 2023 Sep 24;11(10):2621. doi: 10.3390/biomedicines11102621. Biomedicines. 2023. PMID: 37892995 Free PMC article. Review.
-
Identification of gene signatures related to hypoxia and angiogenesis in pancreatic cancer to aid immunotherapy and prognosis.Front Oncol. 2023 Mar 30;13:1119763. doi: 10.3389/fonc.2023.1119763. eCollection 2023. Front Oncol. 2023. PMID: 37064125 Free PMC article.
-
MYBBP1A‑mediated IGFBP4 promoter methylation promotes epithelial‑mesenchymal transition and metastasis through activation of NOTCH pathway in liver cancer.Int J Oncol. 2025 Jan;66(1):4. doi: 10.3892/ijo.2024.5710. Epub 2024 Nov 29. Int J Oncol. 2025. PMID: 39611481 Free PMC article.
References
-
- Siegel R.L., Miller K.D., Jemal A. Cancer statistics, 2020. CA Cancer J Clin. 2020;70:7–30. - PubMed
-
- Erkan M., Reiser-Erkan C., Michalski C.W., Kleeff J. Tumor microenvironment and progression of pancreatic cancer. Exp Oncol. 2010;32:128–131. - PubMed
-
- Clark C.E., Hingorani S.R., Mick R., Combs C., Tuveson D.A., Vonderheide R.H. Dynamics of the immune reaction to pancreatic cancer from inception to invasion. Cancer Res. 2007;67:9518–9527. - PubMed
-
- Wormann S.M., Diakopoulos K.N., Lesina M., Algul H. The immune network in pancreatic cancer development and progression. Oncogene. 2014;33:2956–2967. - PubMed
Publication types
MeSH terms
Substances
Grants and funding
LinkOut - more resources
Full Text Sources
Other Literature Sources
Medical
Molecular Biology Databases
Miscellaneous
