

Early Prediction of Acute Esophagitis for Adaptive Radiation Therapy
- PMID: 33453309
- PMCID: PMC8180486
- DOI: 10.1016/j.ijrobp.2021.01.007
Early Prediction of Acute Esophagitis for Adaptive Radiation Therapy
Abstract
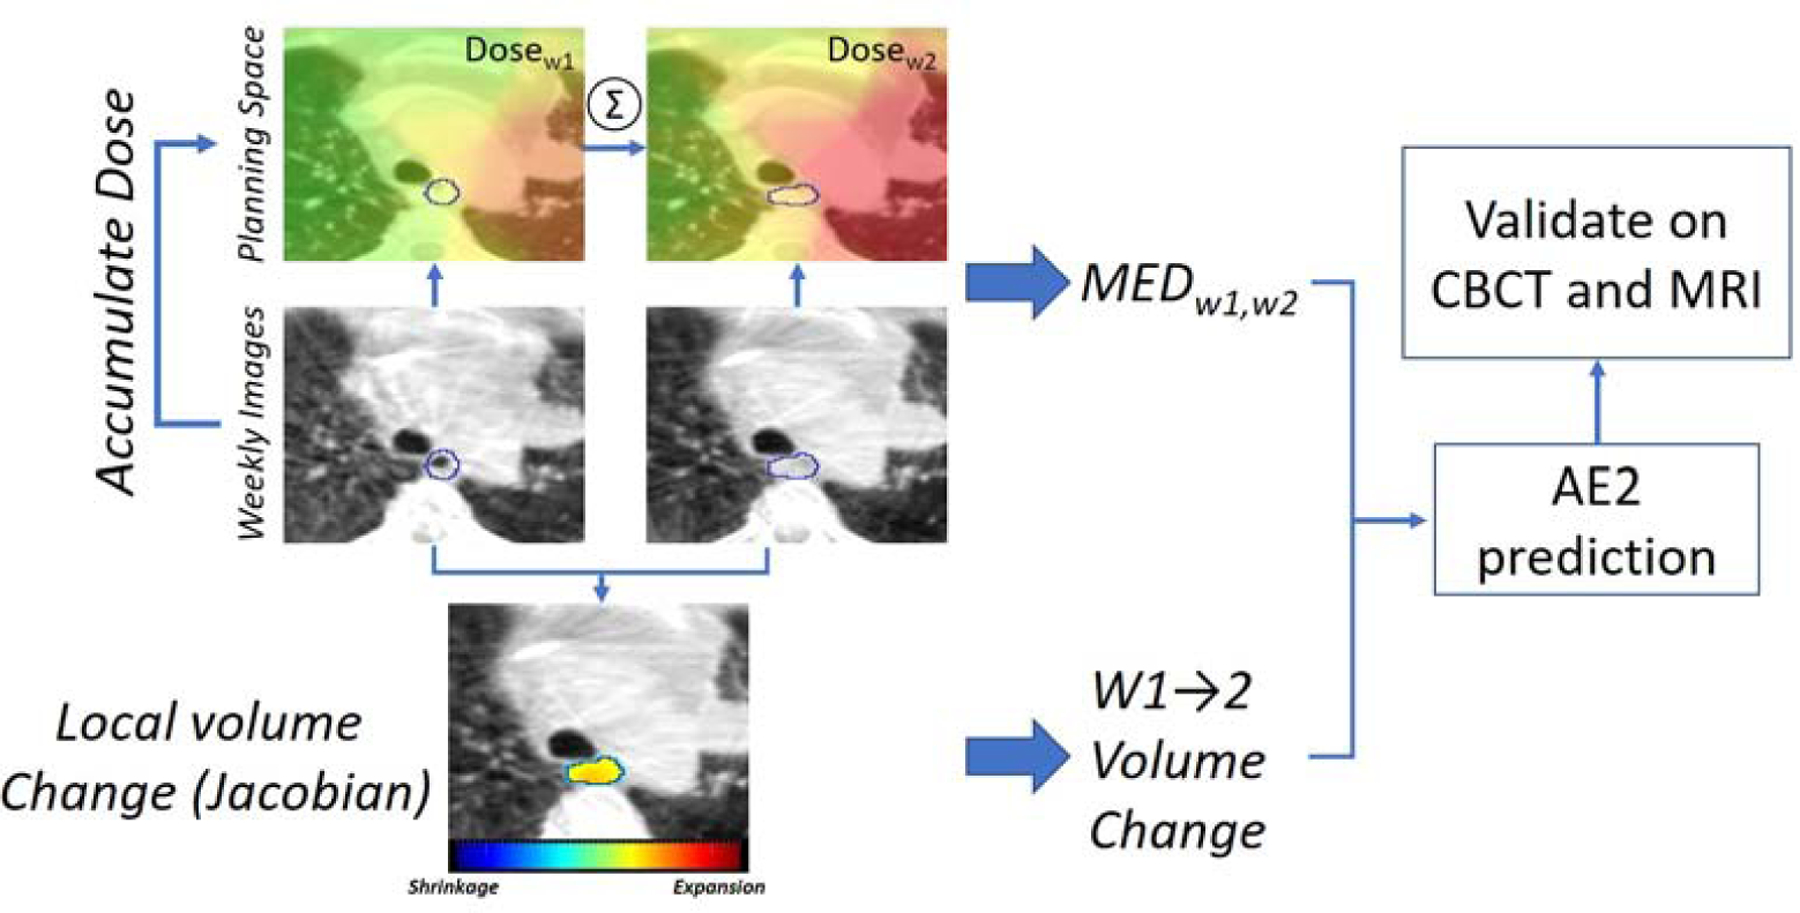
Purpose: Acute esophagitis (AE) is a common dose-limiting toxicity in radiation therapy of locally advanced non-small cell lung cancer (LA-NSCLC). We developed an early AE prediction model from weekly accumulated esophagus dose and its associated local volumetric change.
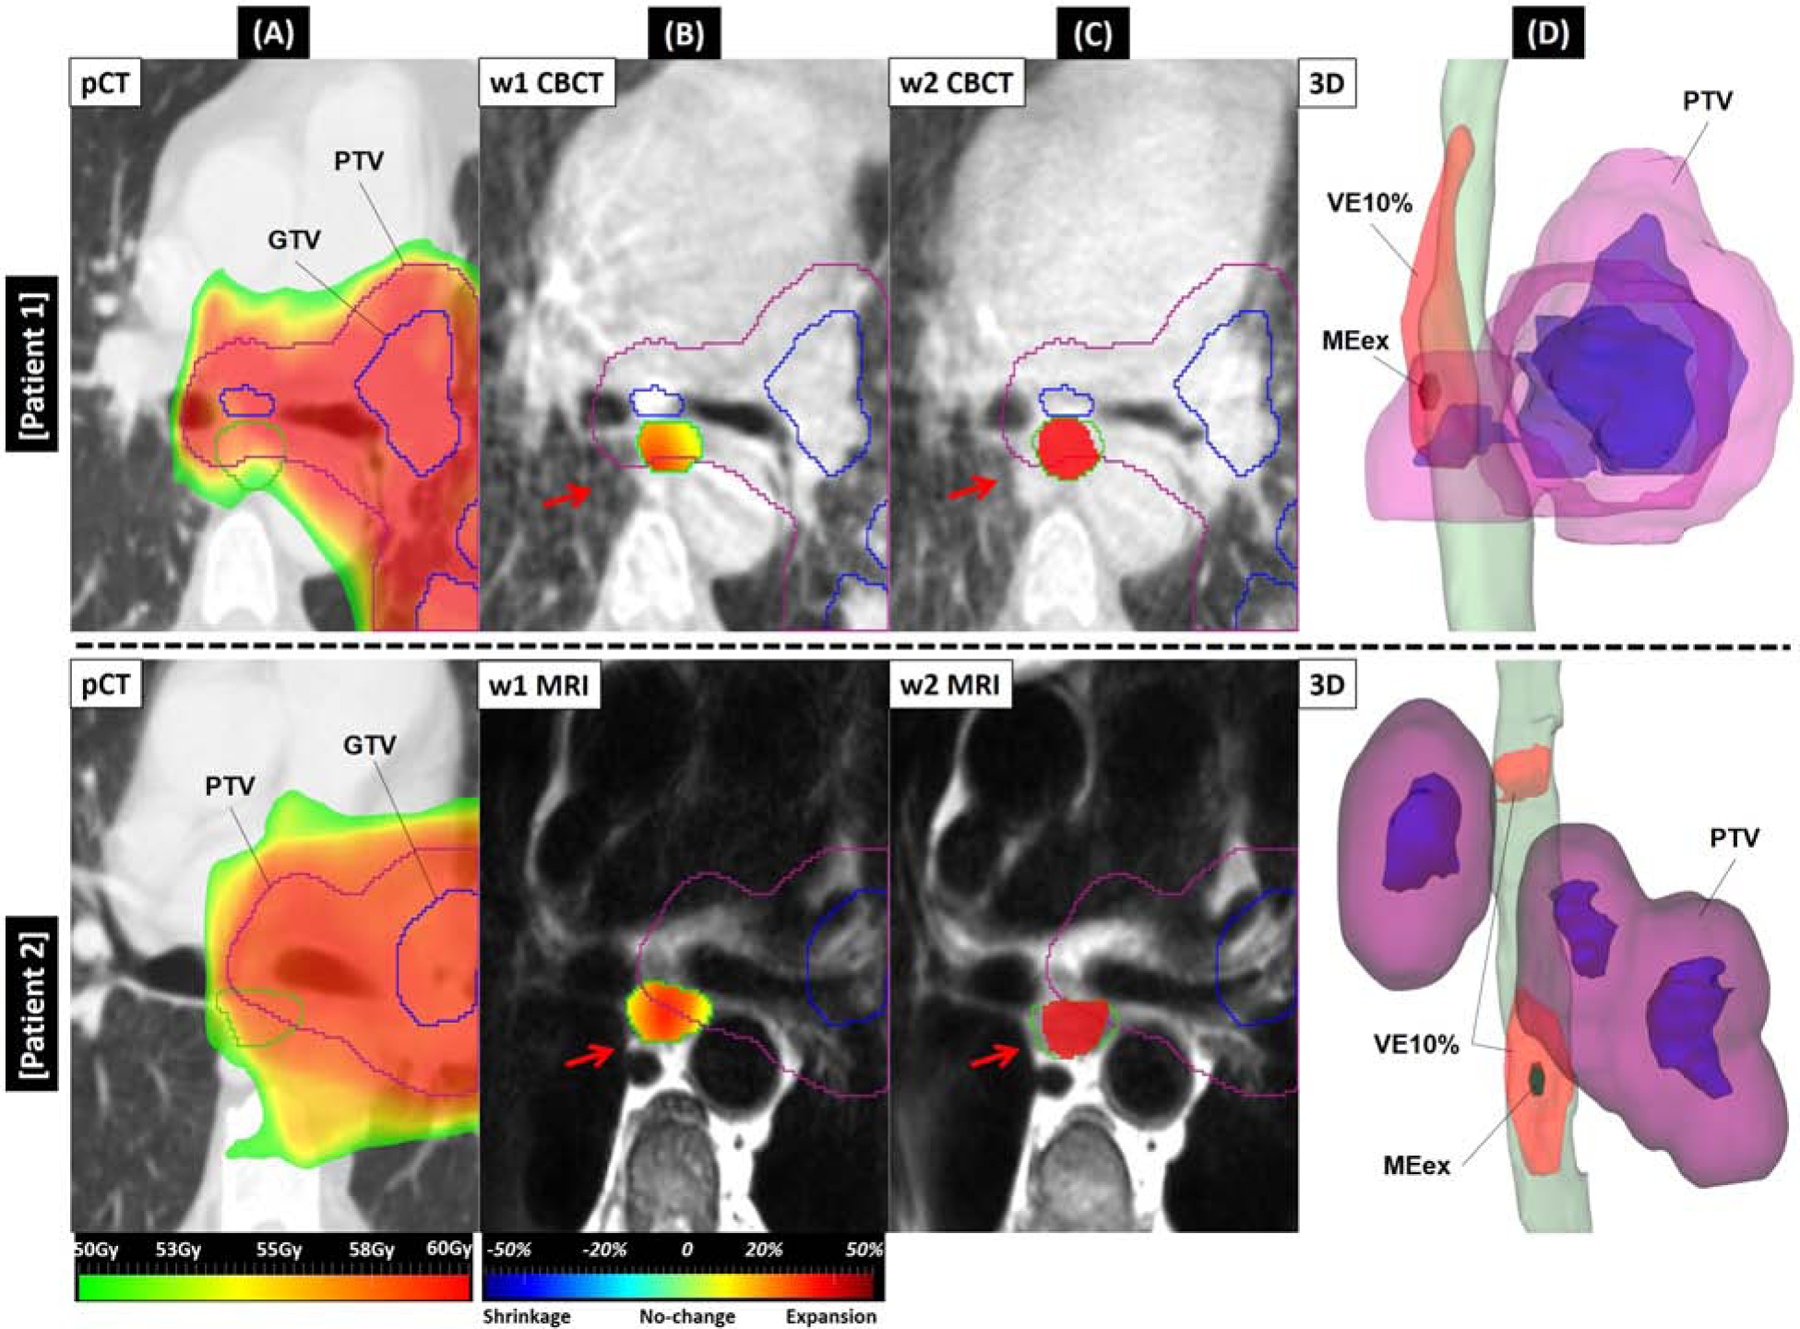
Methods and materials: Fifty-one patients with LA-NSCLC underwent treatment with intensity modulated radiation therapy to 60 Gy in 2-Gy fractions with concurrent chemotherapy and weekly cone beam computed tomography (CBCT). Twenty-eight patients (55%) developed grade ≥2 AE (≥AE2) at a median of 4 weeks after the start of radiation therapy. For early ≥AE2 prediction, the esophagus on CBCT of the first 2 weeks was deformably registered to the planning computed tomography images, and weekly esophagus dose was accumulated. Week 1-to-week 2 (w1→w2) esophagus volume changes including maximum esophagus expansion (MEex%) and volumes with ≥x% local expansions (VEx%; x = 5, 10, 15) were calculated from the Jacobian map of deformation vector field gradients. Logistic regression model with 5-fold cross-validation was built using combinations of the accumulated mean esophagus doses (MED) and the esophagus change parameters with the lowest P value in univariate analysis. The model was validated on an additional 18 and 11 patients with weekly CBCT and magnetic resonance imaging (MRI), respectively, and compared with models using only planned mean dose (MEDPlan). Performance was assessed using area under the curve (AUC) and Hosmer-Lemeshow test (PHL).
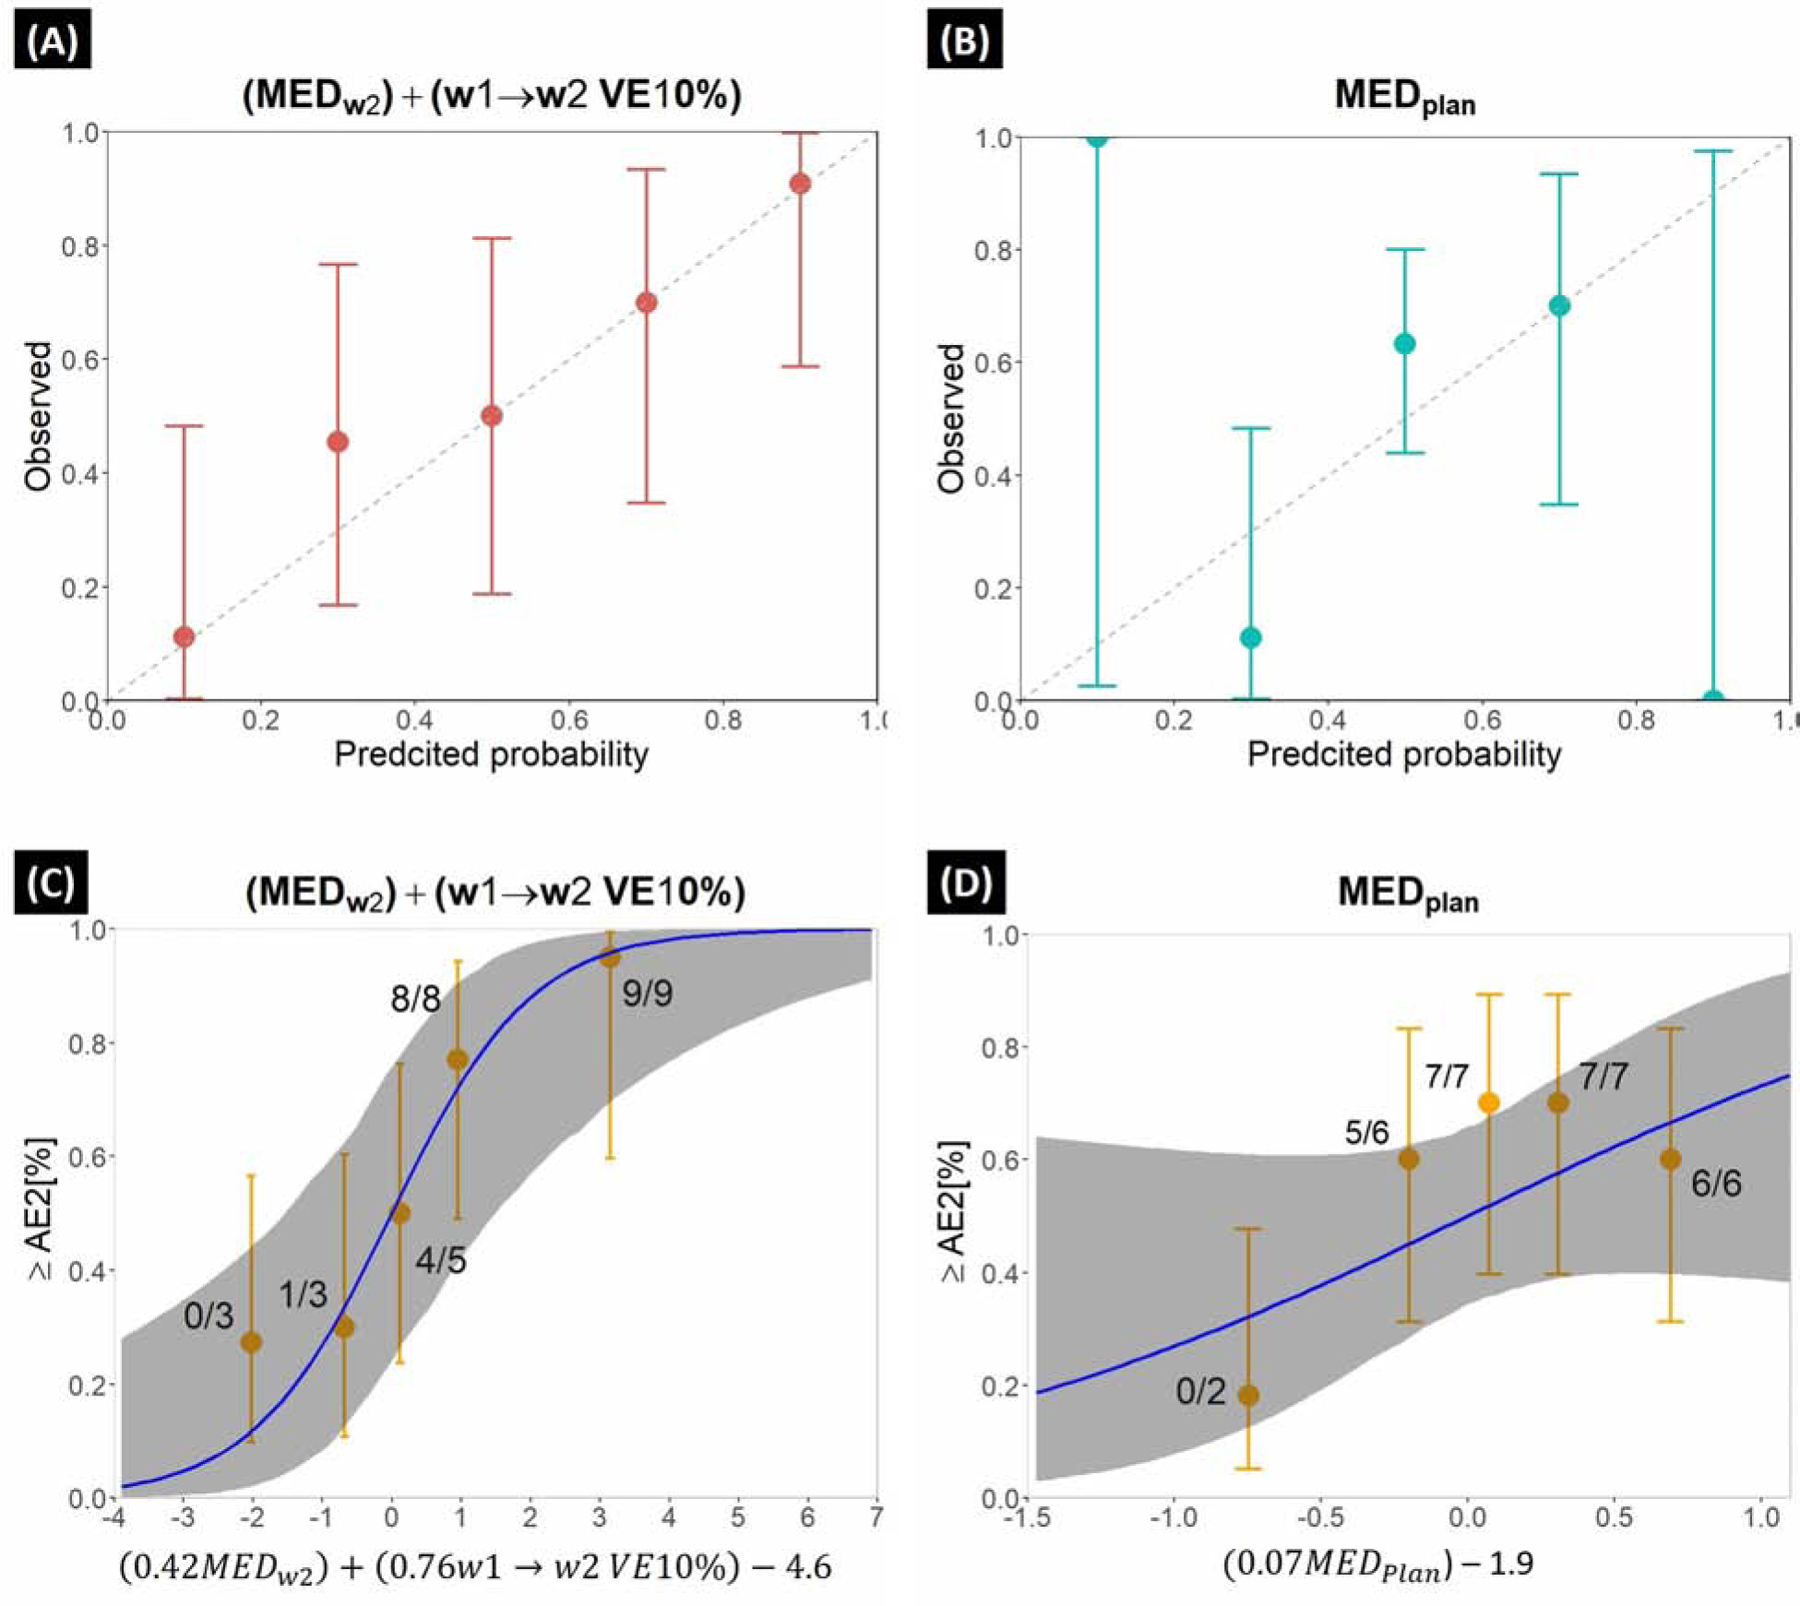
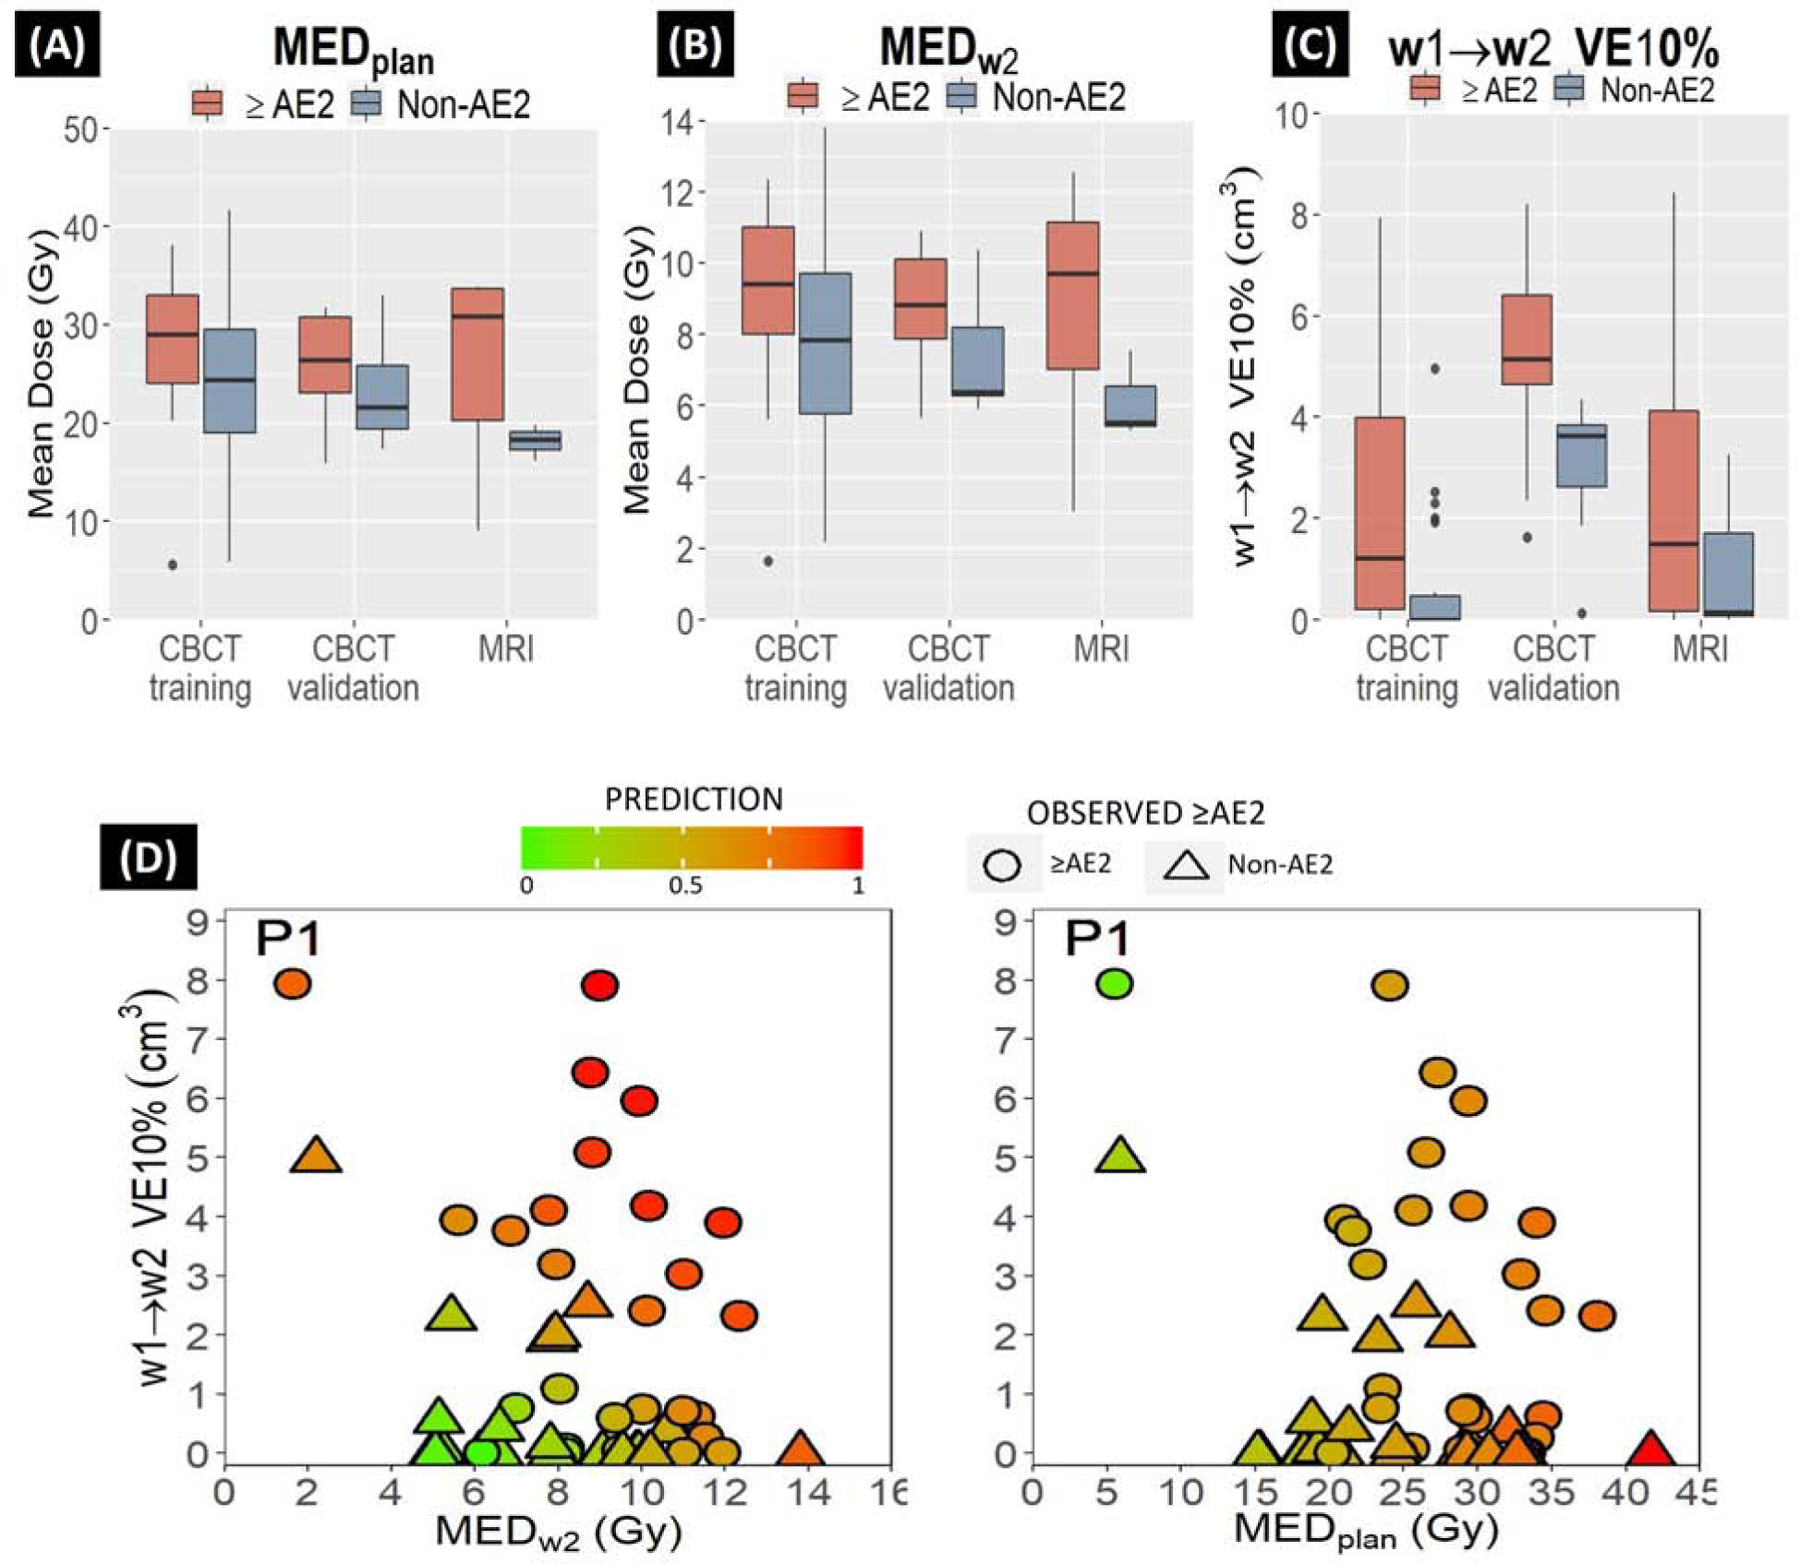
Results: Univariately, w1→w2 VE10% (P = .004), VE5% (P = .01) and MEex% (P = .02) significantly predicted ≥AE2. A model combining MEDW2 and w1→w2 VE10% had the best performance (AUC = 0.80; PHL = 0.43), whereas the MEDPlan model had a lower accuracy (AUC = 0.67; PHL = 0.26). The combined model also showed high accuracy in the CBCT (AUC = 0.78) and MRI validations (AUC = 0.75).
Conclusions: A CBCT-based, cross-validated, and internally validated model on MRI with a combination of accumulated esophagus dose and local volume change from the first 2 weeks of chemotherapy significantly improved AE prediction compared with conventional models using only the planned dose. This model could inform plan adaptation early to lower the risk of esophagitis.
Published by Elsevier Inc.
Conflict of interest statement
Figures
Comment in
-
In Regard to Alam et al.Int J Radiat Oncol Biol Phys. 2021 Jul 1;110(3):914-915. doi: 10.1016/j.ijrobp.2021.02.041. Int J Radiat Oncol Biol Phys. 2021. PMID: 34089686 No abstract available.
-
In Reply to Sabour.Int J Radiat Oncol Biol Phys. 2021 Jul 1;110(3):915-916. doi: 10.1016/j.ijrobp.2021.02.039. Int J Radiat Oncol Biol Phys. 2021. PMID: 34089687 No abstract available.
Similar articles
-
Treatment-related acute esophagitis for patients with locoregionally advanced non-small cell lung cancer treated with involved-field radiotherapy and concurrent chemotherapy.Am J Clin Oncol. 2014 Oct;37(5):433-7. doi: 10.1097/COC.0b013e31827de7a2. Am J Clin Oncol. 2014. PMID: 23388558
-
Quantification of accumulated dose and associated anatomical changes of esophagus using weekly Magnetic Resonance Imaging acquired during radiotherapy of locally advanced lung cancer.Phys Imaging Radiat Oncol. 2020 Jan;13:36-43. doi: 10.1016/j.phro.2020.03.002. Epub 2020 Mar 26. Phys Imaging Radiat Oncol. 2020. PMID: 32411833 Free PMC article.
-
A Contralateral Esophagus-Sparing Technique to Limit Severe Esophagitis Associated With Concurrent High-Dose Radiation and Chemotherapy in Patients With Thoracic Malignancies.Int J Radiat Oncol Biol Phys. 2015 Jul 15;92(4):803-10. doi: 10.1016/j.ijrobp.2015.03.018. Epub 2015 Mar 25. Int J Radiat Oncol Biol Phys. 2015. PMID: 26104934
-
Radiation dose-volume effects in the esophagus.Int J Radiat Oncol Biol Phys. 2010 Mar 1;76(3 Suppl):S86-93. doi: 10.1016/j.ijrobp.2009.05.070. Int J Radiat Oncol Biol Phys. 2010. PMID: 20171523 Free PMC article. Review.
-
Research progress of radiation esophagitis: A narrative review.Medicine (Baltimore). 2025 May 9;104(19):e42273. doi: 10.1097/MD.0000000000042273. Medicine (Baltimore). 2025. PMID: 40355243 Free PMC article. Review.
Cited by
-
Predicting spatial esophageal changes in a multimodal longitudinal imaging study via a convolutional recurrent neural network.Phys Med Biol. 2020 Nov 27;65(23):235027. doi: 10.1088/1361-6560/abb1d9. Phys Med Biol. 2020. PMID: 33245052 Free PMC article.
-
Performance Comparison of 10 State-of-the-Art Machine Learning Algorithms for Outcome Prediction Modeling of Radiation-Induced Toxicity.Adv Radiat Oncol. 2024 Nov 13;10(2):101675. doi: 10.1016/j.adro.2024.101675. eCollection 2025 Feb. Adv Radiat Oncol. 2024. PMID: 39717195 Free PMC article.
-
Inter- and intrafraction motion assessment and accumulated dose quantification of upper gastrointestinal organs during magnetic resonance-guided ablative radiation therapy of pancreas patients.Phys Imaging Radiat Oncol. 2022 Feb 17;21:54-61. doi: 10.1016/j.phro.2022.02.007. eCollection 2022 Jan. Phys Imaging Radiat Oncol. 2022. PMID: 35243032 Free PMC article.
-
Data Science Opportunities To Improve Radiotherapy Planning and Clinical Decision Making.Semin Radiat Oncol. 2024 Oct;34(4):379-394. doi: 10.1016/j.semradonc.2024.07.012. Semin Radiat Oncol. 2024. PMID: 39271273 Free PMC article. Review.
-
Cone beam computed tomography (CBCT) and megavoltage computed tomography (MVCT)-based radiomics in head and neck cancers: a systematic review and radiomics quality score assessment.Quant Imaging Med Surg. 2024 Sep 1;14(9):6963-6977. doi: 10.21037/qims-24-334. Epub 2024 Aug 28. Quant Imaging Med Surg. 2024. PMID: 39281127 Free PMC article. Review.
References
-
- Delgado BD, Enguix-Riego MV, Fernández de Bobadilla JC, et al. Association of single nucleotide polymorphisms at HSPB1 rs7459185 and TGFB1 rs11466353 with radiation esophagitis in lung cancer. Radiother Oncol 2019;135:161–169. - PubMed
Publication types
MeSH terms
Grants and funding
LinkOut - more resources
Full Text Sources
Other Literature Sources
Medical
