. 2021 Feb 20:164:271-284.
doi: 10.1016/j.freeradbiomed.2021.01.003. Epub 2021 Jan 13.

β-carotene oxygenase 2 deficiency-triggered mitochondrial oxidative stress promotes low-grade inflammation and metabolic dysfunction

Affiliations

β-carotene oxygenase 2 deficiency-triggered mitochondrial oxidative stress promotes low-grade inflammation and metabolic dysfunction

Lei Wu et al. Free Radic Biol Med. .

Abstract

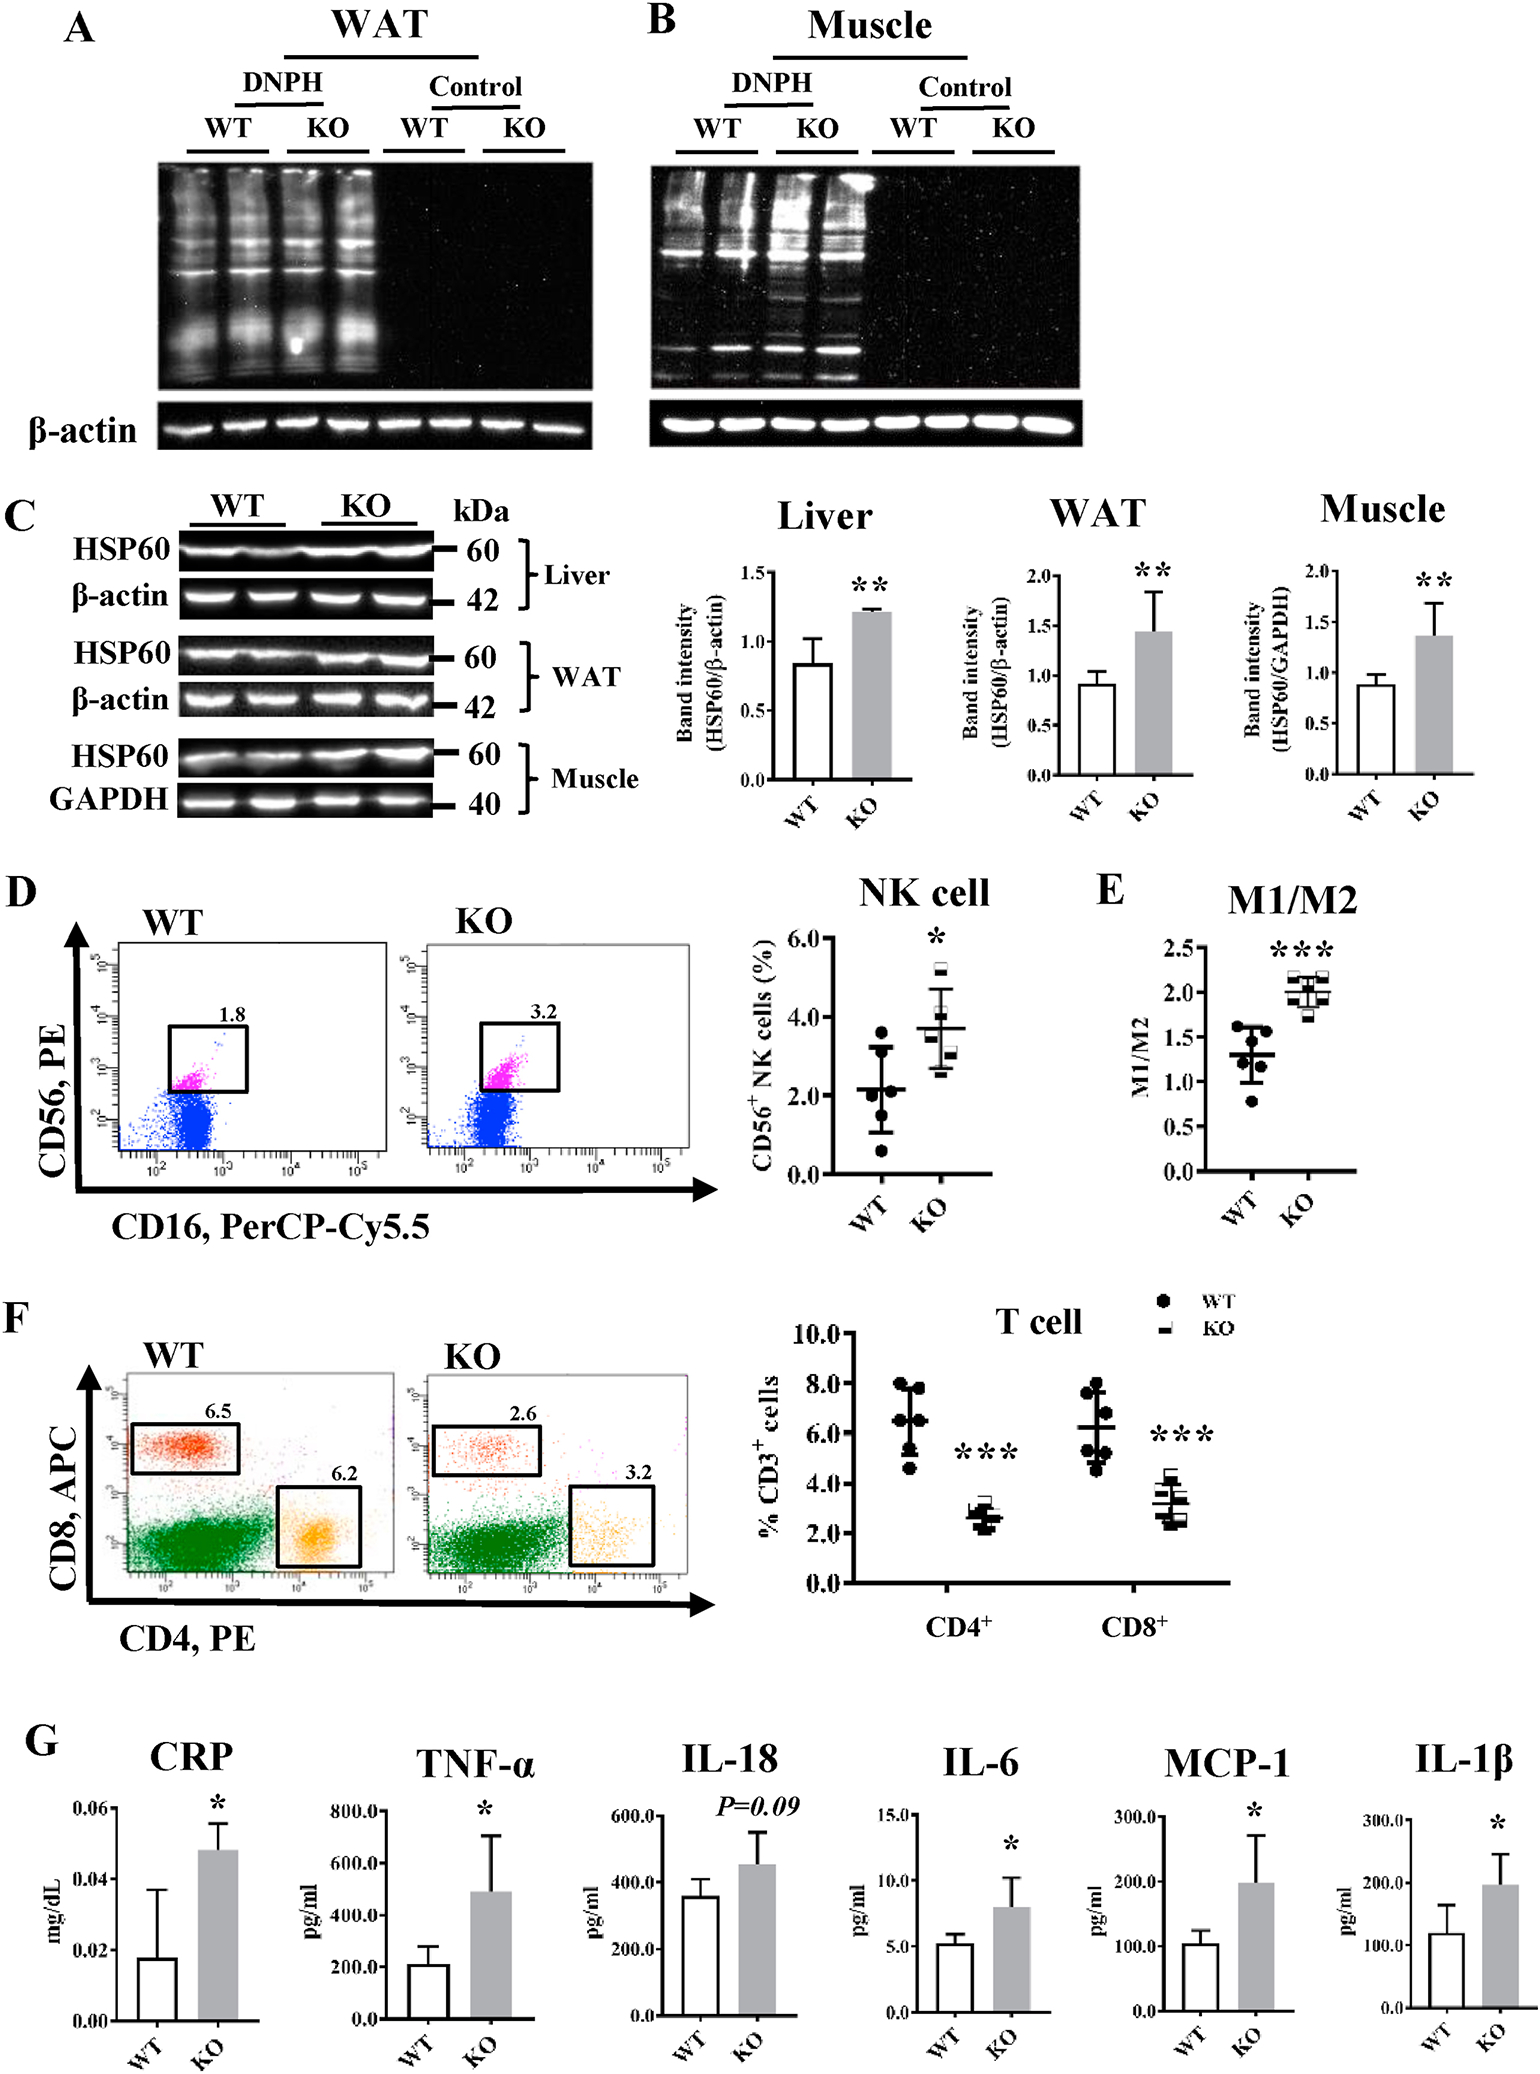
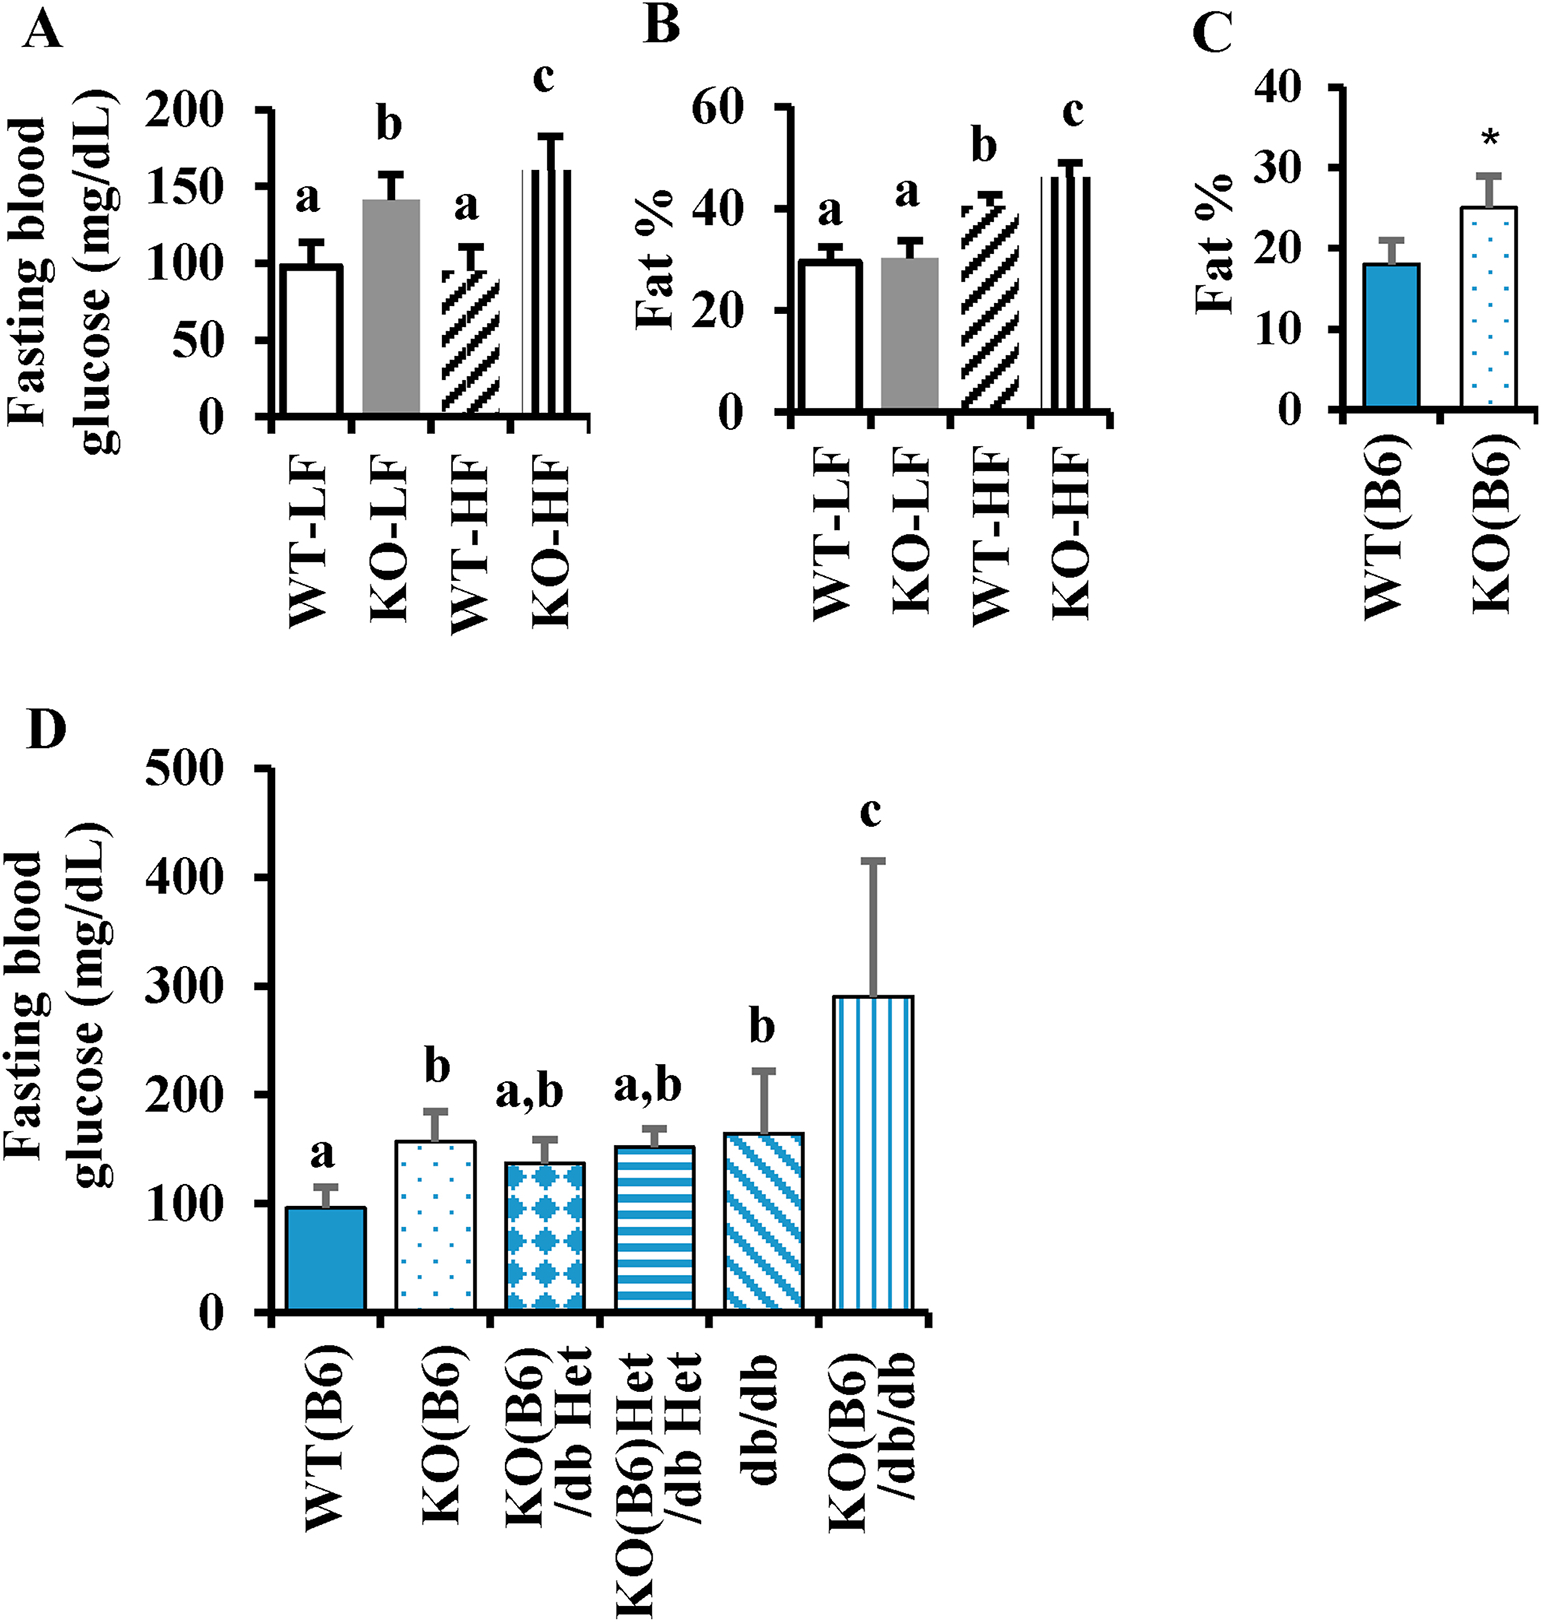
Low-grade inflammation is a critical pathological factor contributing to the development of metabolic disorders. β-carotene oxygenase 2 (BCO2) was initially identified as an enzyme catalyzing carotenoids in the inner mitochondrial membrane. Mutations in BCO2 are associated with inflammation and metabolic disorders in humans, yet the underlying mechanisms remain unknown. Here, we used loss-of-function approaches in mice and cell culture models to investigate the role of BCO2 in inflammation and metabolic dysfunction. We demonstrated decreases in BCO2 mRNA and protein levels and suppression of mitochondrial respiratory complex I proteins and mitochondrial superoxide dismutase levels in the liver of type 2 diabetic human subjects. Deficiency of BCO2 caused disruption of assembly of the mitochondrial respiratory supercomplexes, such as supercomplex III2+IV in mice, and overproduction of superoxide radicals in primary mouse embryonic fibroblasts. Further, deficiency of BCO2 increased protein carbonylation and populations of natural killer cells and M1 macrophages, and decreased populations of T cells, including CD4+ and/or CD8+ in the bone marrow and white adipose tissues. Elevation of plasma inflammatory cytokines and adipose tissue hypertrophy and inflammation were also characterized in BCO2 deficient mice. Moreover, BCO2 deficient mice were more susceptible to high-fat diet-induced obesity and hyperglycemia. Double knockout of BCO2 and leptin receptor genes caused a significantly greater elevation of the fasting blood glucose level in mice at 4 weeks of age, compared to the age- and sex-matched leptin receptor knockout. Finally, administration of Mito-TEMPO, a mitochondrial specific antioxidant attenuated systemic low-grade inflammation induced by BCO2 deficiency. Collectively, these findings suggest that BCO2 is essential for mitochondrial respiration and metabolic homeostasis in mammals. Loss or decreased expression of BCO2 leads to mitochondrial oxidative stress, low-grade inflammation, and the subsequent development of metabolic disorders.

Keywords: Diabetes; Human; Macrophage; Mitochondrial respiratory supercomplex assembly; Natural killer cell; Superoxide.


Conflict of interest statement

Competing interests

No competing interests declared

Figures

Figure 1
Figure 1. Expression of BCO2 is decreased in human diabetic liver specimens
Total RNA and protein lysates were extracted from three type 2 diabetic human liver specimens and healthy controls and subject to real-time PCR and immunoblotting. A, BCO2 mRNA expression. B, Relative BCO2 protein levels. C, Protein expression levels of NDUFB6, NDUFA9, and SOD2. D, Representative images of immunoblotting. Values are means ± S.D., n=3 with 2 technical replicates. * Different from control (e.g., healthy liver samples), P < 0.05. BCO2, β-carotene oxygenase 2; NDUFA9, NADH:ubiquinone oxidoreductase subunit A9; NDUFB6, NADH:ubiquinone oxidoreductase subunit B6; SOD2, superoxide dismutase 2, mitochondrial
Figure 2
Figure 2. Deficiency of BCO2 disrupts mitochondrial respiratory supercomplex assembly and stimulates mitochondrial superoxide production
Mitochondrial enriched fractions were isolated from the liver of 6-week old male β–carotene oxygenase 2 (BCO2) knockout (KO) and the isogenic background 129S6 (WT) mice. Respiratory supercomplex assembly was examined by blue native PAGE followed by immunoblotting using antibodies against A, NDUFB6 of CI and/or I, complex I; B, UQCRC2 of CIII and/or III, complex III; C, MTCO2 of CIV and/or IV, complex IV. III2, complex III homodimers; III2 + IV, supercomplex III2 + IV; IV2, complex IV homodimer; Other supercomplexes (SCs), supercomplexes containing CI, CIII, and CIV, the exact number of the I, III, and/or IV in the supercomplex unknown.?, non-identified in the literature. IB, immunoblotting. n=4. D, Primary mouse embryonic fibroblasts were stained with MitoSOX (red) and Mito-Tracker (green). MitoSOX and Mito-Tracker signals were quantified using ImageJ. Relative superoxide contents are expressed as MitoSOX/Mito-Tracker. Values are means ± S.D., n=6 with 2 technical replicates. ** Different from control (WT MEFs), P < 0.01. Scale bar, 25 μm
Figure 3
Figure 3. Deficiency of BCO2 leads to oxidative damage and systemic low-grade inflammation
Plasma, bone marrow, liver, white adipose tissues (WAT), and gastrocnemius muscles (Muscle) were collected from 6-week old male β–carotene oxygenase 2 (BCO2) knockout (KO) and the isogenic background 129S6 (WT) mice. A-B, OxylBlot analysis of protein oxidative damage in WAT (A) and Muscle (B). Left four lanes were DNPH-treated, and the right four lanes were negative controls. C, Representative immunoblotting and quantification results of HSP60 in the liver, WAT, and Muscle lysates. D, Representative flow cytometry dot plots and quantitative results of NK cells derived from the bone marrow. E, The ratio of M1 to M2 macrophages isolated from the bone marrow. F, Representative flow cytometry dot plots and quantitative results of CD4+ and CD8+ T cells derived from the bone marrow. G, Plasma levels of CRP, TNFα, MCP-1, IL-6, IL-1β, and IL-18. Data were analyzed by Student’s t-test. Values are means ± S.D., n=6–8, with 2 technical replicates. * Significant difference from WT, P < 0.05. *P < 0.05; **P <0.01; ***P < 0.001. CRP, C-reactive protein; HSP60, heat shock protein 60, mitochondrial; IL-1β, interleukin 1β; IL-6, interleukin 6, IL-18, interleukin 18; MCP-1, monocyte chemoattractant protein-1; NK cell, natural killer cell; TNF-α, tumor necrosis factor α
Figure 4
Figure 4. Deficiency of BCO2 is associated with dyslipidemia and impaired lipid metabolism in liver
6-week old male β–carotene oxygenase 2 (BCO2) knockout (KO) and the isogenic background 129S6 (WT) mice were used. A, Plasma total cholesterol (CHOL), HDL-C, LDL-C, NEFA, and TG levels. B, Percent of liver weight by body weight (BW). C, Liver TG content. D, Representative immunoblotting and quantification of liver lysate for proteins associated with lipid metabolism. E, Contents of hepatic DAG (e.g., 1,3-DPG and 1,2-DPG), HMG, and squalene. F, Representative immunoblotting and quantification of HMGCR in liver lysates. G, Brief scheme of altered cholesterol synthesis in BCO2 KO mice. Data were analyzed by Student’s t-test. Values are means ± S.D., n=6–8 with 2 technical replicates. * Significant difference from WT, P < 0.05. *P < 0.05; **P <0.01***p< 0.001. 1,2-DPG, 1,2-dipalmitoylglycerol; 1,3-DPG, 1,3-dipalmitoylglycerol; ACC, acetyl-CoA carboxylase; AMPKα, AMP-activated protein kinase α; ApoB, Apolipoprotein B; DAG, diacylglycerol; HDL-C, high-density lipoprotein cholesterol; HMG, 3-hydroxy-3-methylglutarate; HMGCR, HMG-CoA reductase; HMGCS, HMG-CoA synthase; IRS1, insulin receptor substrate 1; pSer636/639-IRS1, phosphorylation of IRS1 on Ser636/639; LDL-C, low-density lipoprotein cholesterol; NEFA, non-esterified fatty acid; SREBP1c, sterol regulatory element-binding protein 1 c; TG, triglyceride
Figure 5
Figure 5. Deficiency of β–carotene oxygenase 2 (BCO2) leads to adipocyte hypertrophy and inflammation in white adipose tissues (WAT) of male mice at 6 weeks of age
A, Total body fat% (n =6–8). B, Representative histology images of WAT depots (2 left panels) and quantification of adipocyte distribution (right) (n =6–8). Scale bar, 50 μm. C, Representative immunoblotting and quantification of perilipin, PPARγ, and FASN (n =6–8). D, Plasma adiponectin levels (n=8–10). E, IL6Ra+ NK cells in WAT (n =4–6). F, Real-time PCR analyses of genes associated with inflammation in WAT (n =6–7). G, immunohistochemistry of F4/80+ cells in WAT. Representative images are shown on the left, with quantification on the right (n =5). Scale bar, 50 μm. Values are means ± S.D., n various with 2 technical replicates. * Significant difference from WT, P < 0.05. *P < 0.05; **P <0.01***p< 0.001. CD11c, integrin alpha X; DAPI, 4′,6-diamidino-2-phenylindole; F4/80, F4/80, EGF-like module-containing mucin-like hormone receptor-like 1; FASN, fatty acid synthase; IL-1β, interleukin 1 β; IL-10, interleukin 10; MCP-1, monocyte chemoattractant protein-1; MIP-1α: macrophage inflammatory protein 1α; NK cells, natural killer cells; PPARγ, peroxisome proliferator-activated receptor γ; WT, wild type mice; TNF-α, tumor necrosis factor α; VCAM1: vascular cell adhesion protein 1
Figure 6
Figure 6. Deficiency of BCO2 increases the susceptibility to high-fat diet-induced obesity and hyperglycemia
Six-week-old male β–carotene oxygenase 2 (BCO2) knockout (KO) and the isogenic background 129S6 (WT) mice were fed low-fat (LF, 10 kCal % fat and 17 kCal % sucrose) or high-fat (HF, 45 kCal % fat and 17 kCal % sucrose) diets for 28 weeks. At the termination of the study, fasting blood glucose (A) and whole-body fat % (B) were measured and shown. Data were analyzed by two-way ANOVA. Values are means ± S.D., n=12. Labeled means without a common letter differ, P<0.05. Whole-body fat % in 6-week old male β–carotene oxygenase 2 (BCO2) knockout in a C57BL/6J background (KO(B6)) and the isogenic background C57BL/6J (WT(B6)) mice (C). Data were analyzed by Student’s t-test. Values are means ± S.D., n=8. * statistical significance compared to WT(B6), P<0.05. KO(B6) mice were backcrossed with db/db. Male offsprings with BCO2 and leptin receptor depletion (db/db) were subject to the fasting blood glucose test at 4 weeks of age (D). Data were analyzed with one-way ANOVA. Values are means ± S.D., n=6–8. Labeled means without a common letter differ, P<0.05. db/db, leptin receptor knockout homozygous; db Het, leptin receptor knockout heterozygous; KO-HF, KO fed HF diet; KO-LF, KO fed LF diet; KO(B6), BCO2 knockout homozygous in a C57BL/6J background; KO(B6)/db/db, BCO2 and leptin receptor double knockout homozygous; KO(B6)Het, BCO2 knockout heterozygous in C57BL/6J background; WT-HF, WT fed HF diet; WT-LF, WT fed LF diet
Figure 7
Figure 7. Mito-TEMPO attenuates BCO2 deficiency-induced systemic low-grade inflammation
Six-week-old male KO mice received intraperitoneal (i.p.) injection of Mito-TEMPO (3.5 mg/kg BW/day, KO-Tempo) or sterile PBS (KO-PBS) for 7 consecutive days [32]. Age- and gender-matched WT mice were injected intraperitoneally with sterile PBS as control (WT-PBS). Glucose tolerance test (GTT) was performed in mice on day 6 of the Mito-TEMPO administration. At the termination of the administration, mice were sacrificed for biochemical assessments. A, Plasma levels of TNFα, IL-1β, and IL-6. B, Quantification of NK cell, CD4+ T cell, CD8+ T cell, and the ratio of M1 to M2 macrophages in the bone marrow cells. C, Fasting blood glucose. D, Glucose tolerance test. E, Representative immunoblotting images and quantification of mTOR1, PCK1, and PCK2. F, Quantification of IL6Ra+ NK cell populations in WAT by flow cytometry. G, Plasma NEFA levels. H, Plasma levels of CHOL, HDL-C, LDL-C, and TG. Data were analyzed by Student’s t-test (* Significant difference from WT, P < 0.05. *P < 0.05; **P <0.01***p< 0.001) or one-way ANOVA (Labeled means without a common letter differ, P<0.05). Values are means ± S.D., n=4–8, with 2 technical replicates. CHOL, cholesterol; HDL-C, high-density lipoprotein cholesterol; IL-1β, interleukin 1 β; IL-6, interleukin 6; LDL-C, low-density lipoprotein cholesterol; Mito-TEMPO, (2-(2,2,6,6-Tetramethylpiperidin-1-oxyl-4-ylamino)-2-oxoethyl) triphenyl-phosphonium chloride, monohydrate; mTOR1, mammalian target of rapamycin 1; NEFA, non-esterified fatty acids; NK cells, natural killer cells; PCK1, phosphoenolpyruvate carboxykinase 1; PCK2, phosphoenolpyruvate carboxykinase 2; TG, triglyceride; TNF-α, tumor necrosis factor α; WAT, white adipose tissues

Similar articles

Cited by

References

    1. Antonelli M, Kushner I. It’s time to redefine inflammation. FASEB J 2017; 31: 1787–1791 (2017). doi: 10.1096/fj.201601326R - DOI - PubMed
    1. Ellulu MS, Patimah I, Khaza’ai H, et al.. Obesity and inflammation: the linking mechanism and the complications. Arch Med Sci 2017; 13(4): 851–863. doi: 10.5114/aoms.2016.58928 - DOI - PMC - PubMed
    1. Zatterale F, Longo M, Naderi J, et al.. Chronic adipose tissue inflammation linking obesity to insulin resistance and type 2 diabetes. Front Physiol 2020; 10.3389/fphys.2019.01607 - DOI - PMC - PubMed
    1. Furman D, Campisi J, Verdin E et al. Chronic inflammation in the etiology of disease across the life span. Nat Med 25, 1822–1832 (2019). 10.1038/s41591-019-0675-0 - DOI - PMC - PubMed
    1. Margină D, Ungurianu A, Purdel C, et al. Chronic inflammation in the context of everyday life: Dietary changes as mitigating factors.. Int J Environ Res Public Health 2020;17(11):4135. doi: 10.3390/ijerph17114135. - DOI - PMC - PubMed

Publication types