

The role of lymphocyte-monocyte ratio on axial spondyloarthritis diagnosis and sacroiliitis staging
- PMID: 33453722
- PMCID: PMC7811735
- DOI: 10.1186/s12891-021-03973-8
The role of lymphocyte-monocyte ratio on axial spondyloarthritis diagnosis and sacroiliitis staging
Abstract
Background: Axial spondyloarthritis (axial SpA) is a chronic inflammatory disorder could lead to disability due to the failure of timely treatment. The role of lymphocyte-to-monocyte ratio (LMR) in axial SpA remains unclear. The aim of this study was to investigate the role of LMR in axial SpA diagnosis, disease activity classification and sacroiliitis staging.
Methods: Seventy-eight axial SpA patients [51males and 27 females; mean age 41.0 (29-52) years] and 78 healthy controls (HCs) [55males and 23 females; mean age 40 (30-53) years] were enrolled in this study. The diagnosis of axial SpA was performed according to the New York criteria or the Assessment of Spondyloarthritis international Society (ASAS) classification criteria, whereas the staging of sacroiliitis in axial SpA patients was determined by X-ray examination. Comparisons of LMR levels between groups were performed using t test. Pearson or Spearman correlation analysis were used to assess correlations between LMR and other indicators. Receiver operating characteristic (ROC) curves were used to determine the role of LMR in the diagnosis of axial SpA.
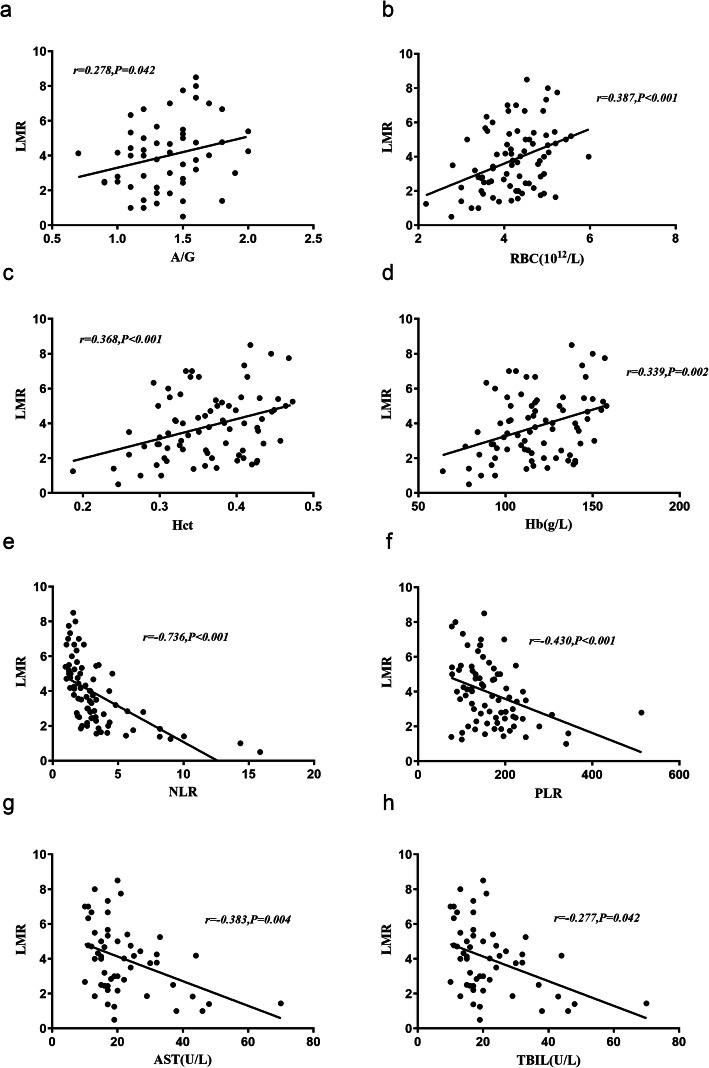
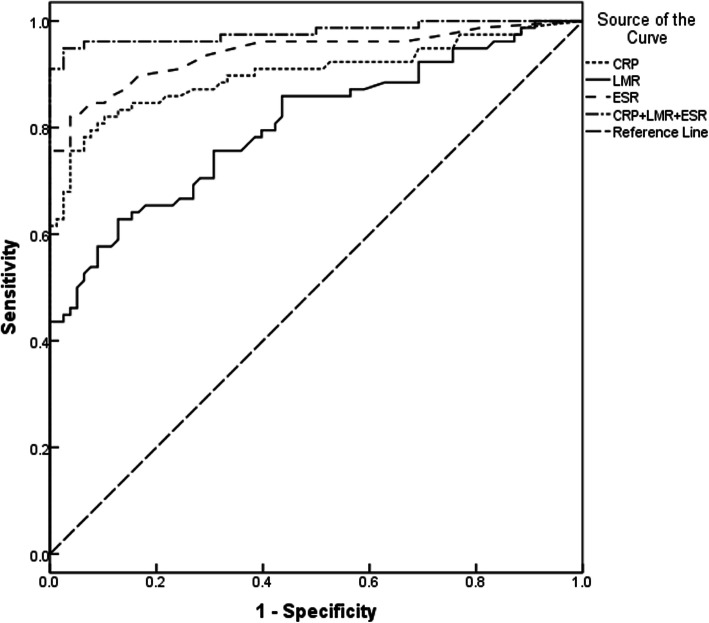
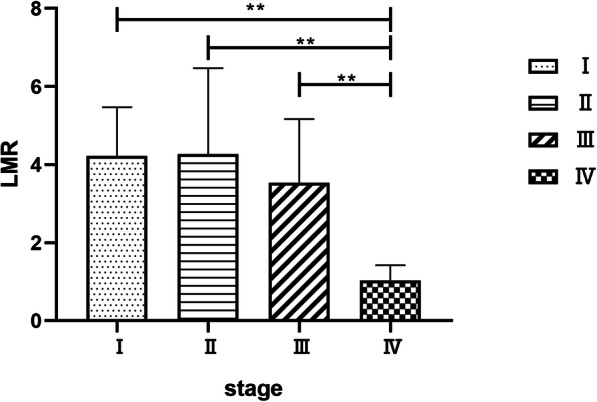
Results: Higher neutrophil-to-lymphocyte ratio(NLR), red blood cell distribution width(RDW), platelet-to-lymphocyte ratio(PLR), mean platelet volume(MPV), erythrocyte sedimentation rate (ESR), and C-reactive protein(CRP) levels and lower red blood cell (RBC), hemoglobin (Hb), Hematocrit (Hct), LMR, alanine aminotransferase (ALT), aspartate aminotransferase (AST), total bilirubin (TBIL) and albumin/globulin (A/G) levels were noted in axial SpA patients compared to HCs. Positive correlations were observed between LMR and RBC, Hb, Hct and A/G, whereas negative correlations were found between LMR and NLR, PLR, AST, and TBIL (P < 0.05). ROC curves showed that the area under the curve (AUC) for LMR in the diagnosis of ankylosing spondylitis was 0.803 (95% CI = 0.734-0.872) with a sensitivity and specificity of 62.8 and 87.2%, respectively, and the AUC (95% CI) for the combination of ESR, CRP and LMR was 0.975 (0.948-1.000) with a sensitivity and specificity of 94.9 and 97.4%, respectively. LMR levels were lower (P < 0.05) and significant differences in LMR values were observed among different stages (P < 0.05).
Conclusions: Our study suggested that LMR might be an important inflammatory marker to identify axial SpA and assess disease activity and X-ray stage of sacroiliitis.
Keywords: Axial spondyloarthritis (axial SpA); Disease activity; Lymphocyte-monocyte ratio (LMR); Stage; X-ray.
Conflict of interest statement
The authors declare that they have no financial or other conflicts of interest in relation to this research and its publication.
Figures
Similar articles
-
Neutrophil-to-Lymphocyte Ratio and Platelet-to-Lymphocyte Ratio as Biomarkers in Axial Spondyloarthritis: Observational Studies From the Program to Understand the Longterm Outcomes in Spondyloarthritis Registry.Arthritis Rheumatol. 2023 Feb;75(2):232-241. doi: 10.1002/art.42333. Epub 2022 Dec 23. Arthritis Rheumatol. 2023. PMID: 36053919 Free PMC article.
-
Relationship between monocytes to lymphocytes ratio and axial spondyloarthritis.Int Immunopharmacol. 2018 Apr;57:43-46. doi: 10.1016/j.intimp.2018.02.008. Epub 2018 Feb 22. Int Immunopharmacol. 2018. PMID: 29471252
-
Predictive values of the postoperative neutrophil-to-lymphocyte ratio, platelet-to-lymphocyte ratio, and lymphocyte-to-monocyte ratio for the diagnosis of early periprosthetic joint infections: a preliminary study.J Orthop Surg Res. 2020 Nov 30;15(1):571. doi: 10.1186/s13018-020-02107-5. J Orthop Surg Res. 2020. PMID: 33256763 Free PMC article.
-
A critical overview of the imaging arm of the ASAS criteria for diagnosing axial spondyloarthritis: what the radiologist should know.Diagn Interv Radiol. 2012 Nov-Dec;18(6):555-65. doi: 10.4261/1305-3825.DIR.5732-12.0. Epub 2012 Apr 6. Diagn Interv Radiol. 2012. PMID: 22484991 Review.
-
Classification criteria for psoriatic arthritis and ankylosing spondylitis/axial spondyloarthritis.Best Pract Res Clin Rheumatol. 2010 Oct;24(5):589-604. doi: 10.1016/j.berh.2010.05.007. Best Pract Res Clin Rheumatol. 2010. PMID: 21035082 Review.
Cited by
-
The role of bilirubin as a biomarker of rheumatic diseases: a systematic review and meta-analysis.Front Immunol. 2024 Jun 14;15:1369284. doi: 10.3389/fimmu.2024.1369284. eCollection 2024. Front Immunol. 2024. PMID: 38947324 Free PMC article.
-
Is the C-reactive protein-to-albumin ratio the most remarkable simple inflammatory marker showing active disease in patients with axial spondyloarthritis, psoriatic arthritis, and rheumatoid arthritis?Clin Rheumatol. 2023 Nov;42(11):2959-2969. doi: 10.1007/s10067-023-06703-8. Epub 2023 Jul 20. Clin Rheumatol. 2023. PMID: 37470884
-
The Usefulness of Cellular Immune Inflammation Markers and Ultrasound Evaluation in the Assessment of Disease Activity in Patients with Spondyloarthritis.J Clin Med. 2023 Aug 23;12(17):5463. doi: 10.3390/jcm12175463. J Clin Med. 2023. PMID: 37685529 Free PMC article.
-
Neutrophil-to-Lymphocyte Ratio and Platelet-to-Lymphocyte Ratio as Biomarkers in Axial Spondyloarthritis: Observational Studies From the Program to Understand the Longterm Outcomes in Spondyloarthritis Registry.Arthritis Rheumatol. 2023 Feb;75(2):232-241. doi: 10.1002/art.42333. Epub 2022 Dec 23. Arthritis Rheumatol. 2023. PMID: 36053919 Free PMC article.
-
Novel peripheral blood diagnostic biomarkers screened by machine learning algorithms in ankylosing spondylitis.Front Genet. 2022 Nov 1;13:1032010. doi: 10.3389/fgene.2022.1032010. eCollection 2022. Front Genet. 2022. PMID: 36386830 Free PMC article.
References
MeSH terms
Grants and funding
LinkOut - more resources
Full Text Sources
Other Literature Sources
Research Materials
Miscellaneous
