. 2020 Dec 18;295(51):17698-17712.
doi: 10.1074/jbc.RA120.015645.

Mapping the transition state for a binding reaction between ancient intrinsically disordered proteins

Affiliations

Mapping the transition state for a binding reaction between ancient intrinsically disordered proteins

Elin Karlsson et al. J Biol Chem. .

Abstract

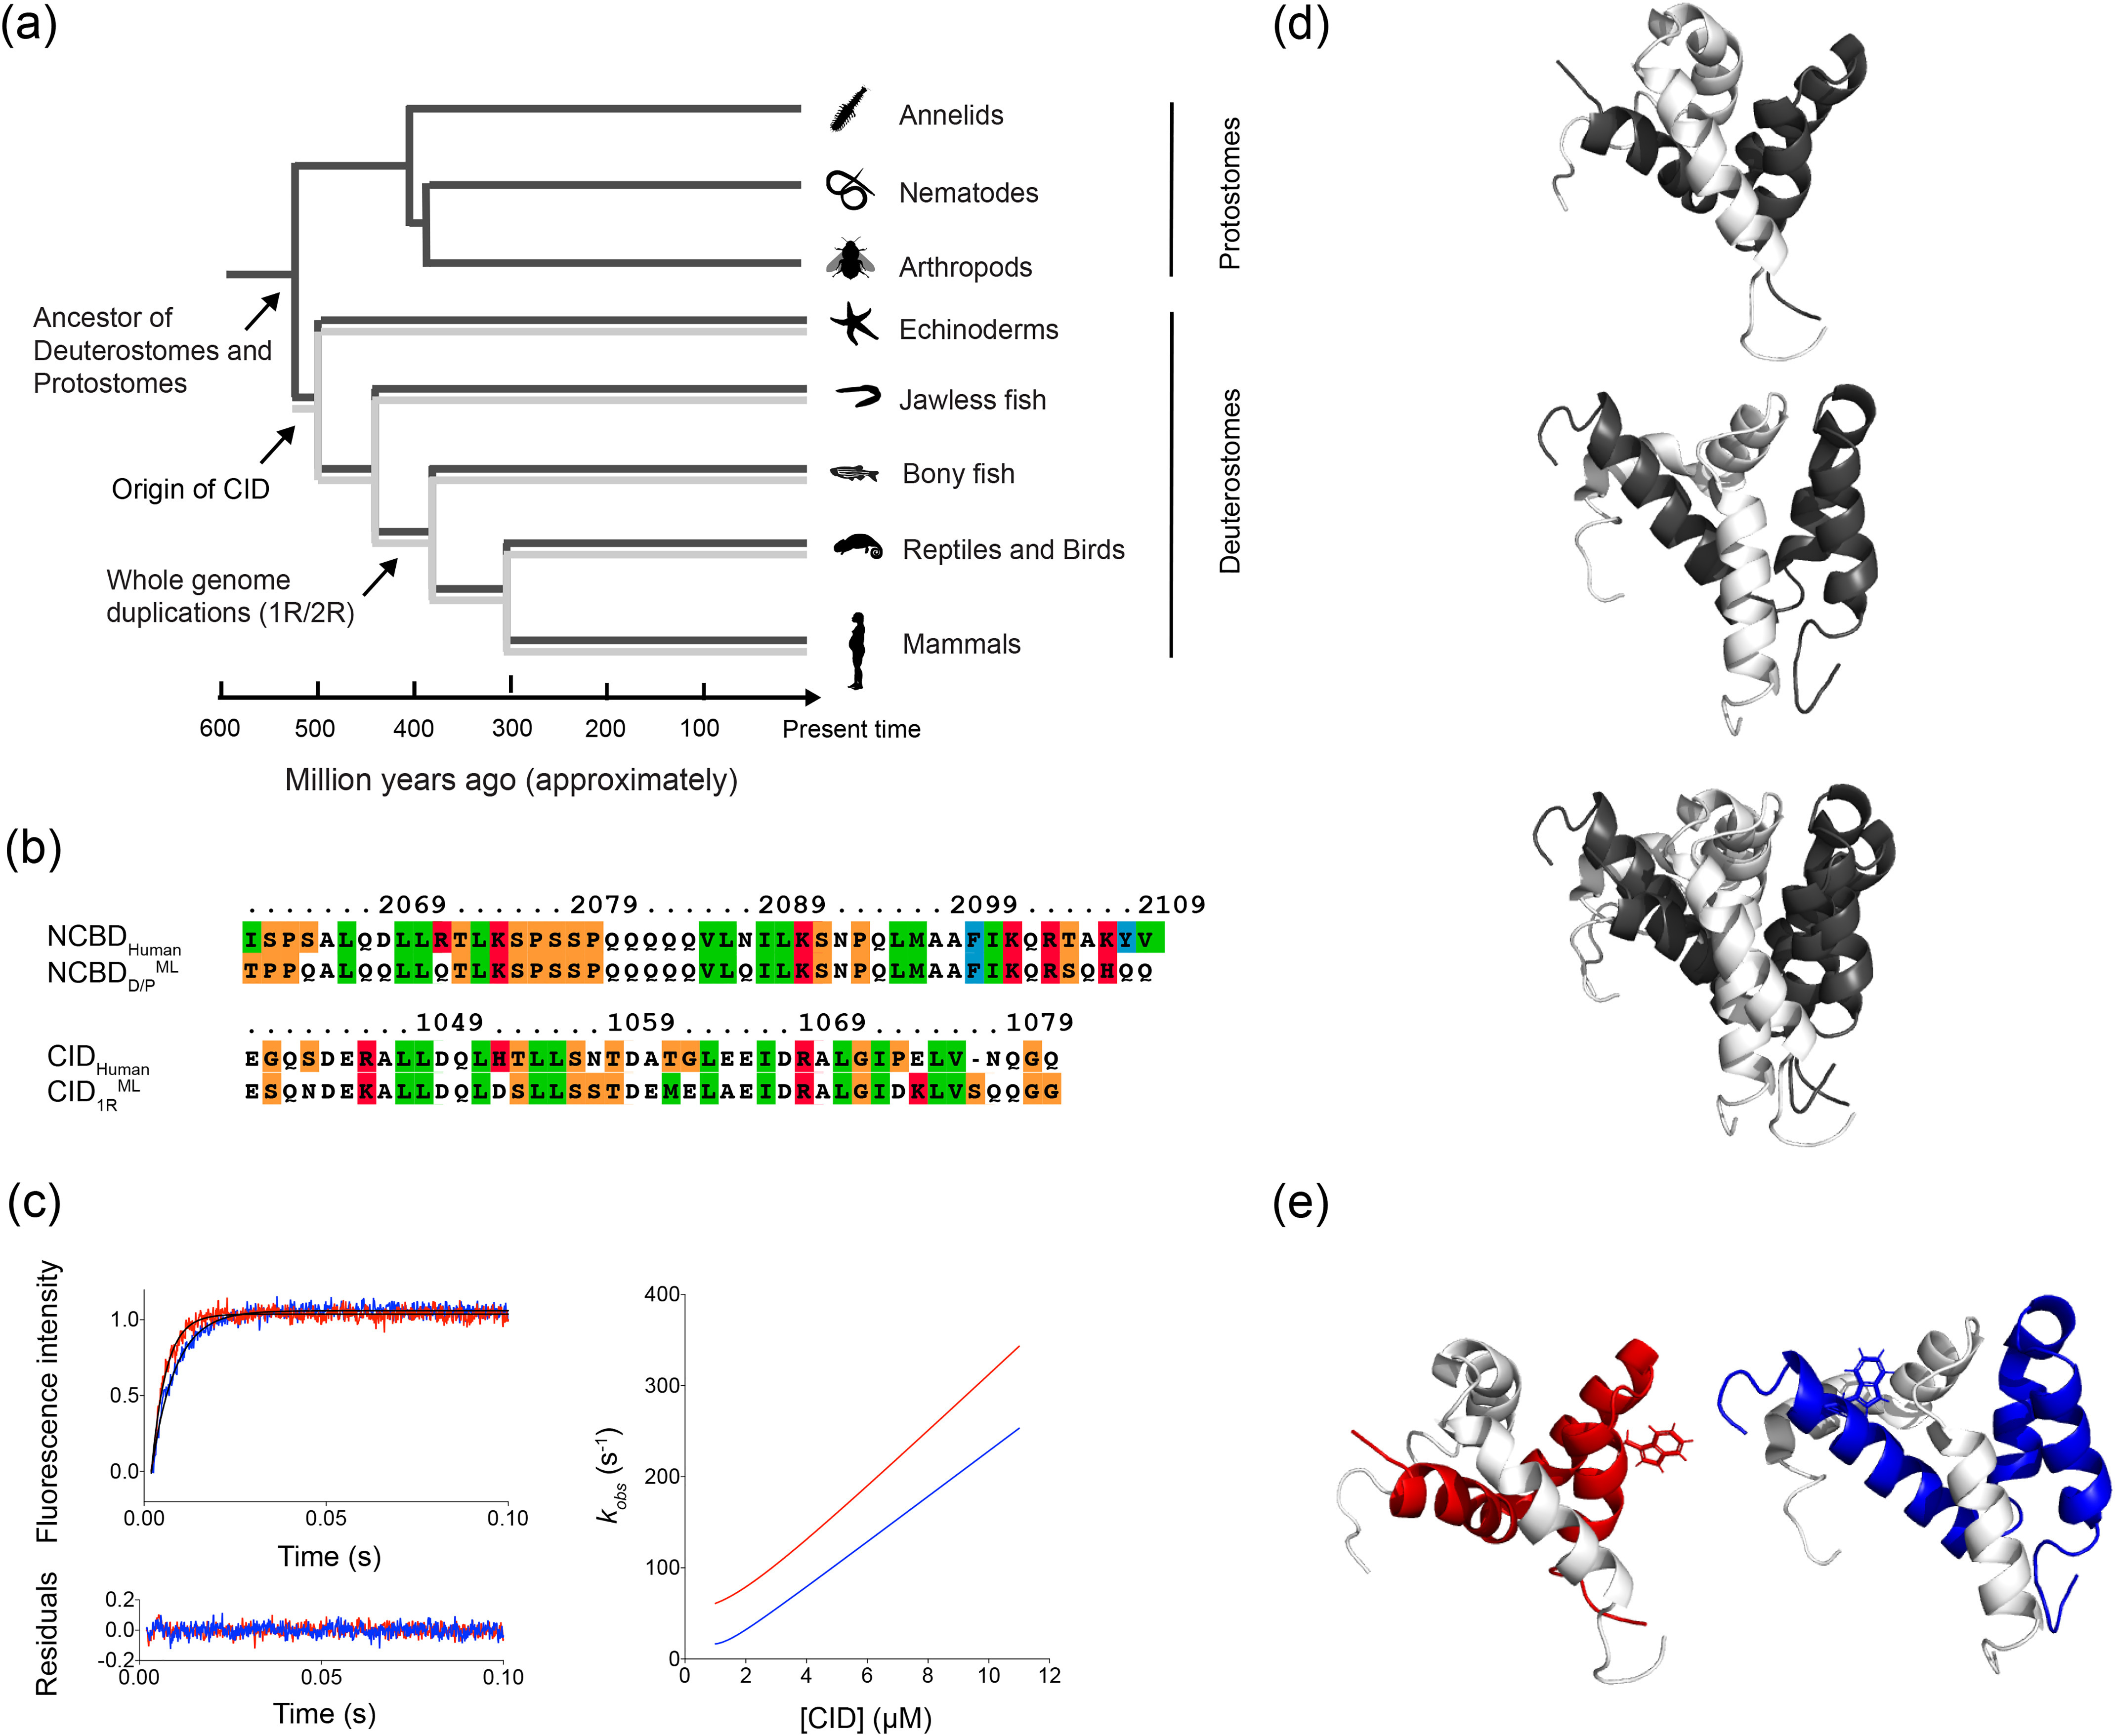
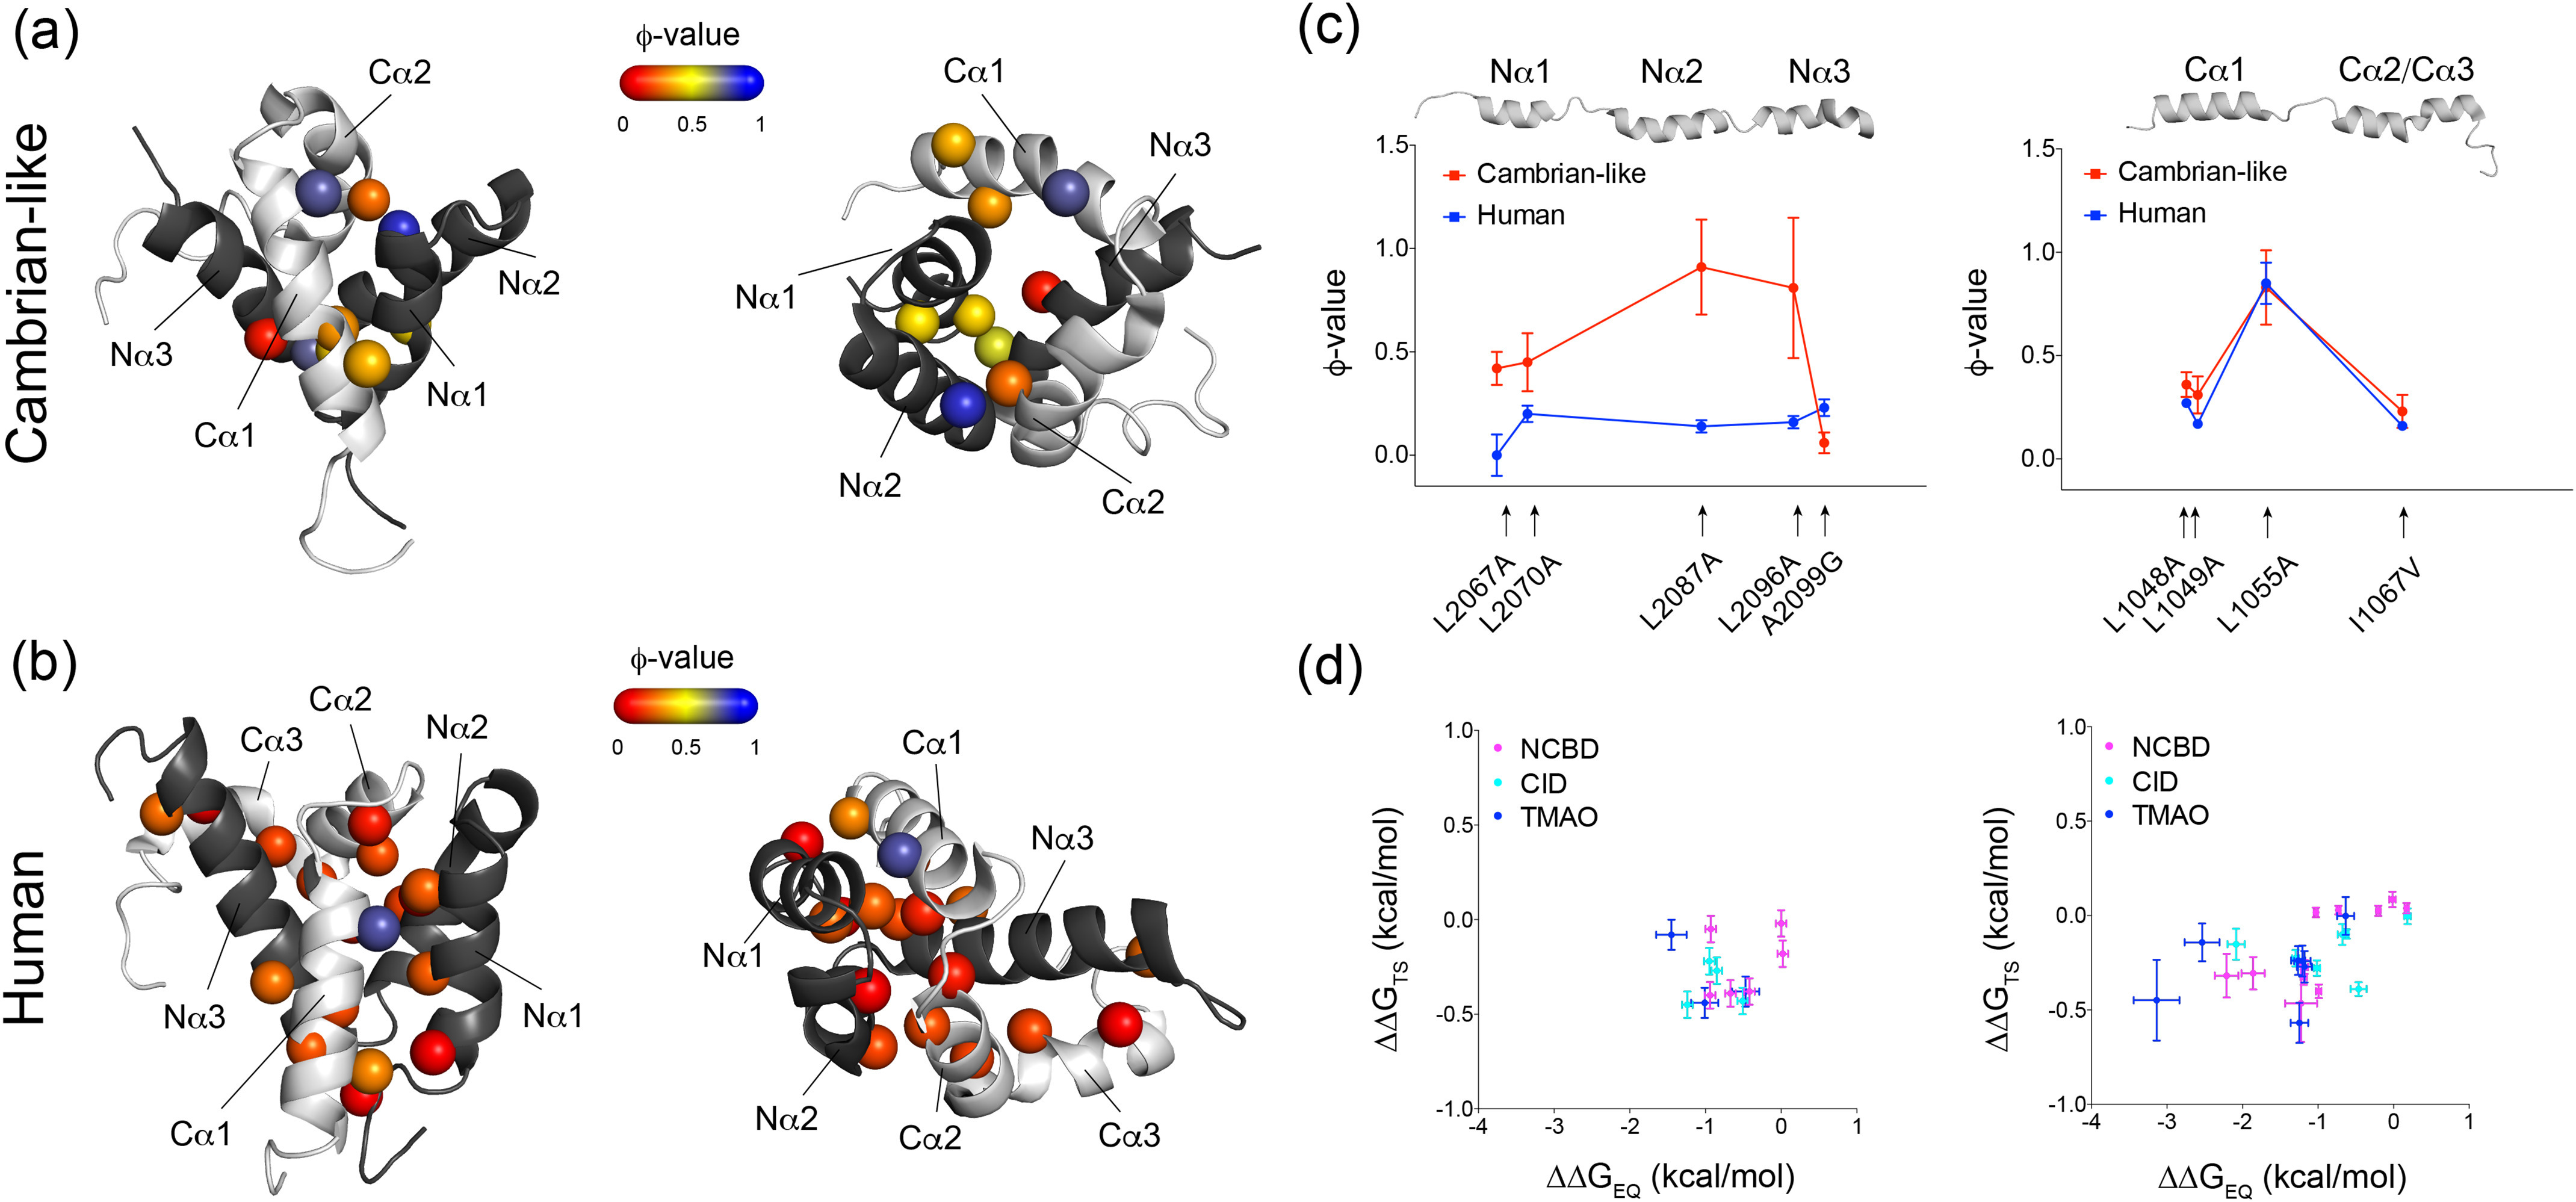
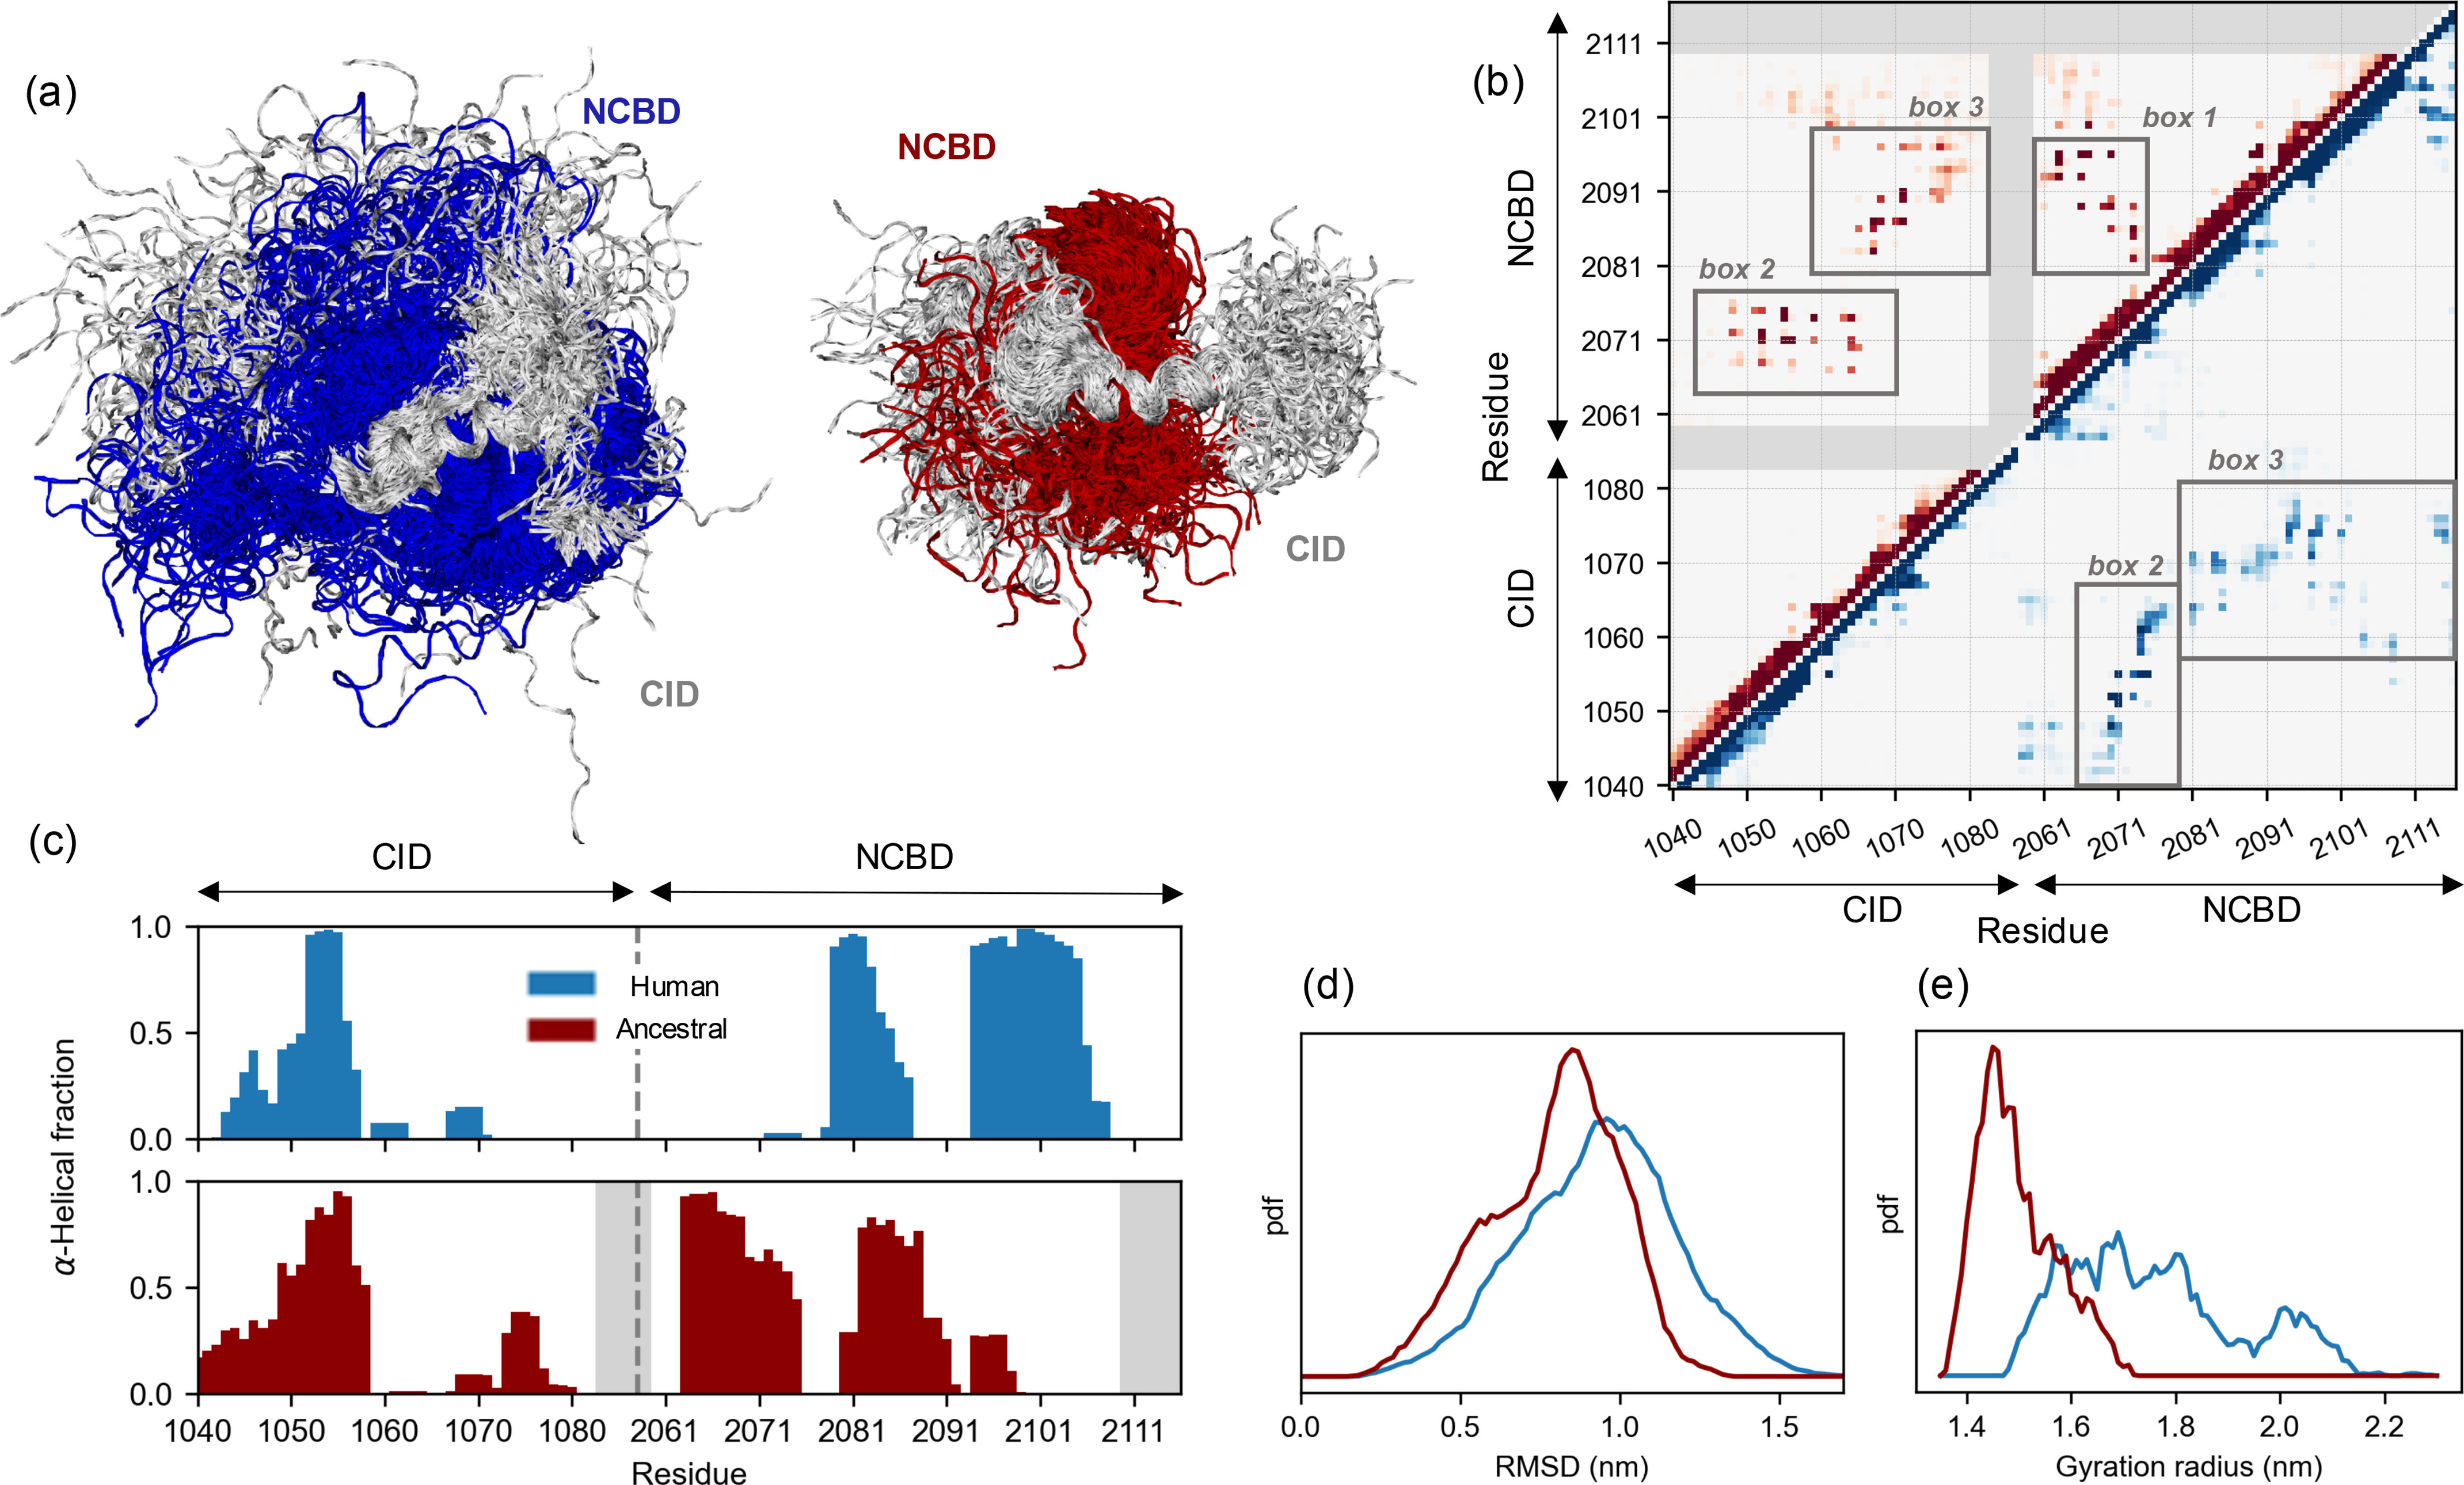
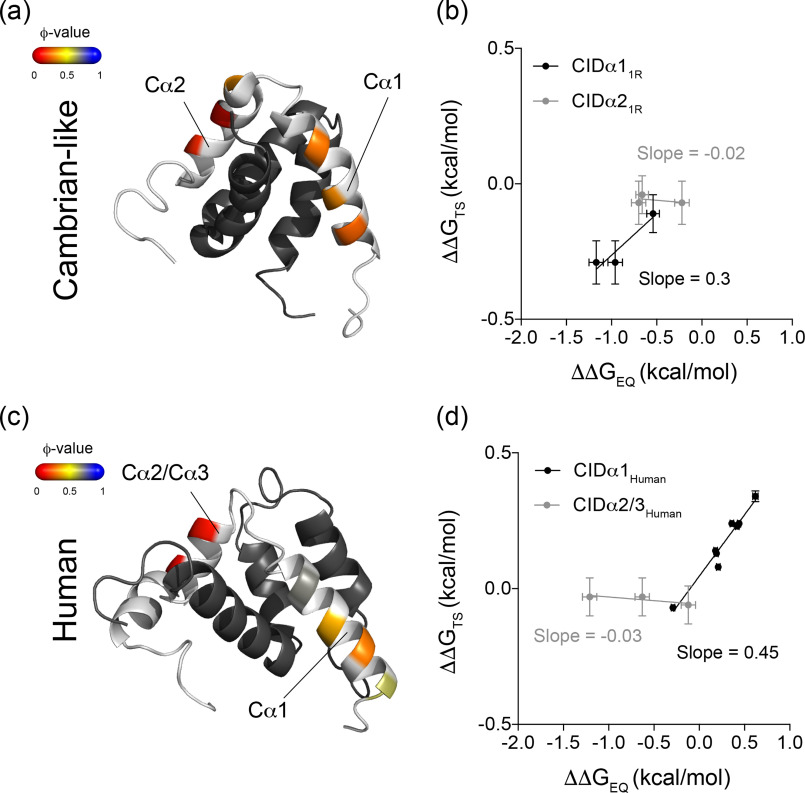
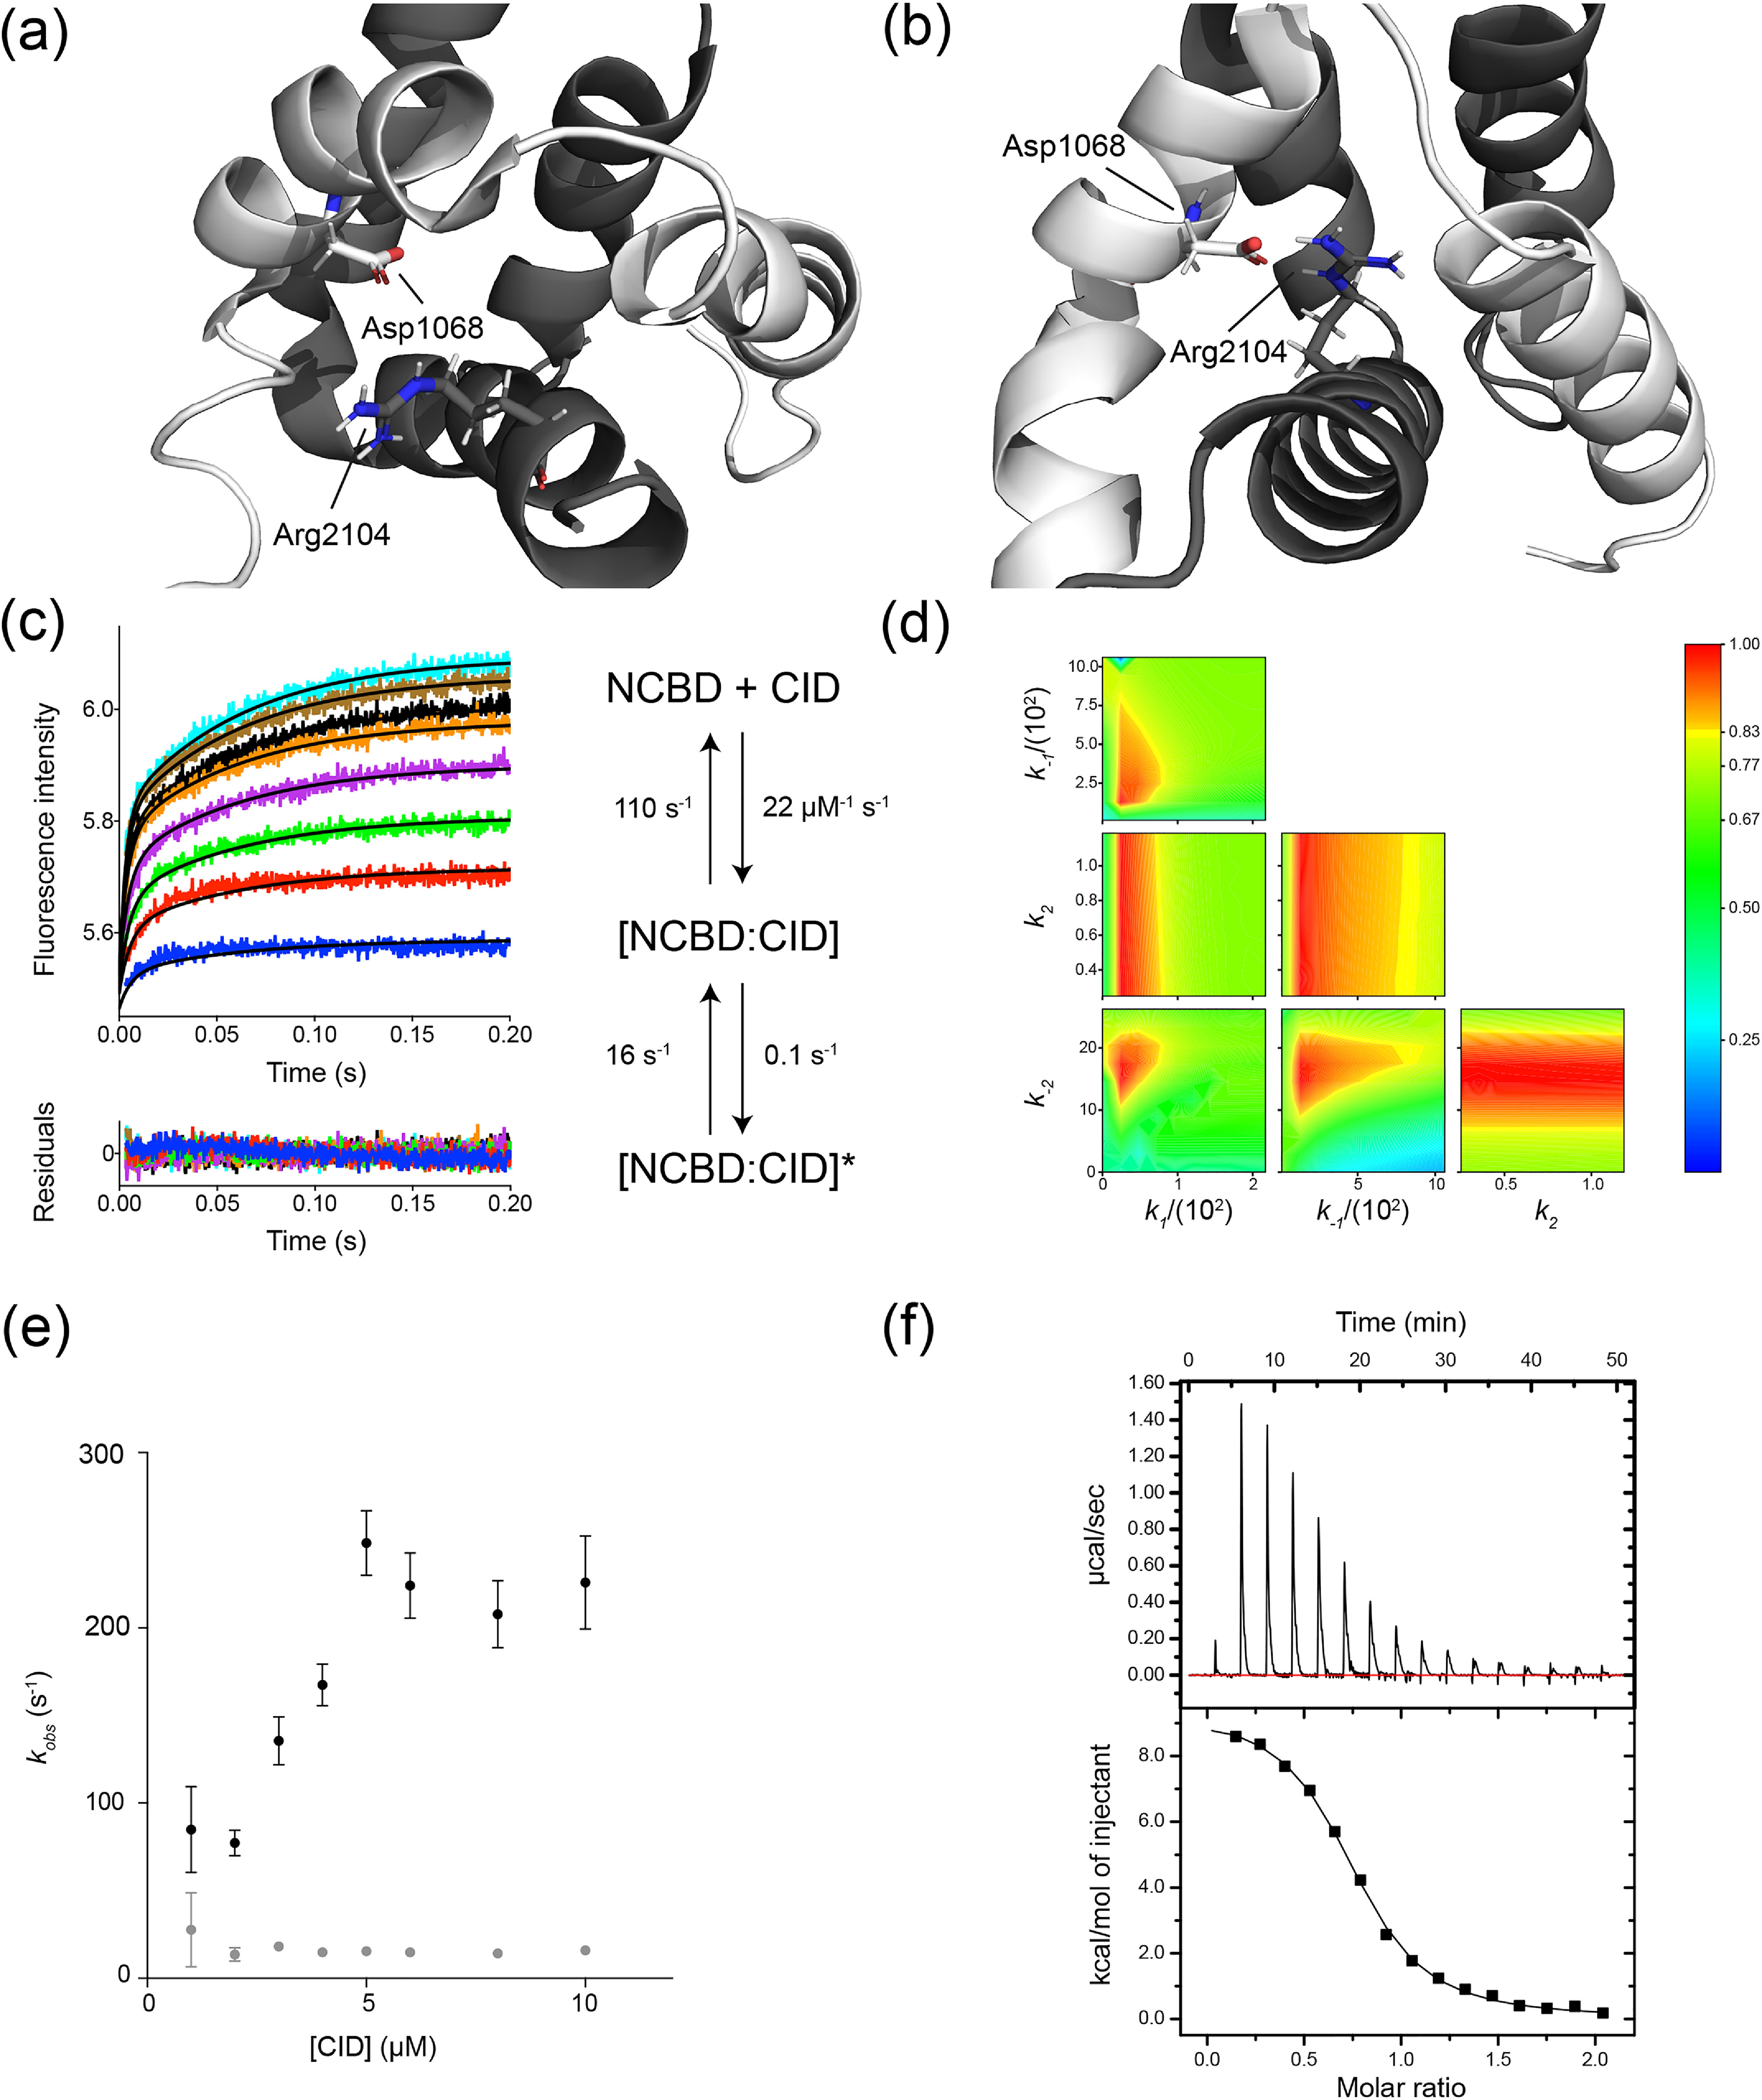
Intrinsically disordered protein domains often have multiple binding partners. It is plausible that the strength of pairing with specific partners evolves from an initial low affinity to a higher affinity. However, little is known about the molecular changes in the binding mechanism that would facilitate such a transition. We previously showed that the interaction between two intrinsically disordered domains, NCBD and CID, likely emerged in an ancestral deuterostome organism as a low-affinity interaction that subsequently evolved into a higher-affinity interaction before the radiation of modern vertebrate groups. Here we map native contacts in the transition states of the low-affinity ancestral and high-affinity human NCBD/CID interactions. We show that the coupled binding and folding mechanism is overall similar but with a higher degree of native hydrophobic contact formation in the transition state of the ancestral complex and more heterogeneous transient interactions, including electrostatic pairings, and an increased disorder for the human complex. Adaptation to new binding partners may be facilitated by this ability to exploit multiple alternative transient interactions while retaining the overall binding and folding pathway.

Keywords: IDP; coupled binding and folding; intrinsically disordered proteins; phi value analysis; pre-steady-state kinetics; protein binding; protein complex; protein evolution; protein folding; transition state.


Conflict of interest statement

Conflict of interest—The authors declare that they have no conflicts of interest with the contents of this article.

The authors declare that they have no conflicts of interest with the contents of this article

Figures

Figure 1.
Figure 1.
Extant and ancestral NCBD and CID variants. a, a schematic phylogenetic tree showing the evolutionary relationship between extant species and nodes corresponding to ancestral species for which ancestral NCBD (dark gray) and CID (light gray) variants were reconstructed. The animal pictures were obtained from PhyloPic, RRID:SCR_019139. b, the sequences of the reconstructed ancestral and extant human NCBD (top) and CID (bottom) that were used in the study. Human NCBD is from CBP and human CID is from NCOA3/ACTR. The color denotes residue type. c, examples of typical stopped-flow kinetic traces for the Cambrian-like complex (red) and human complex (blue; left panel). The concentrations used in this example were 1 µm NCBD and 6 µm CID for both experiments. The kinetic traces were fitted to a single exponential function (shown as a solid black line) and the residuals are displayed below the curve. Right panel: the dependence of the observed rate constant (kobs) on CID concentration for the Cambrian-like complex (red) and the human complex (blue), calculated using the rate constants obtained in global fitting (Table 3). d, solution structures of the Cambrian-like complex (top; PDB entry 6ES5), the human complex (middle; PDB entry 1KBH), and an alignment of the two complexes (bottom) with NCBD in dark gray and CID in light gray. e, structures of the Cambrian-like complex (left; NCBD in red and CID in light gray) and the extant human complex (right; NCBD in blue and CID in light gray) showing the position of the engineered Trp residues as stick model.
Figure 2.
Figure 2.
ϕ-values mapped onto the structures of the Cambrian-like and human complexes. a, ϕ-values for conservative deletion mutations (mostly Leu → Ala mutations) in the binding interface of the Cambrian-like complex. NCBD in dark gray and CID in light gray. The two structures represent the same complex from different angles. Most ϕ-values fall within the intermediate to high ϕ-value category (0.3–0.9; Dataset S1A). b, the previously published ϕ-values for conservative deletion mutations in the binding interface of the human NCBD/CID complex. Most ϕ-values are in the low region (<0.3). c, a site-to-site comparison between ϕ-values at corresponding positions in the Cambrian-like (red) and human (blue) complexes. The error bars denote propagated standard errors. d, Brønsted plots for the Cambrian-like (left; Dataset S1B) and human (right; Dataset S1C) NCBD/CID interaction. Data for human NCBD/CID were obtained from previous studies. The error bars are propagated standard errors. All structures were created using PyMOL.
Figure 3.
Figure 3.
Comparison of the transition state of human and ancestral Cambrian-like complexes. a, MD-determined structural ensembles of the human (NCBD in blue and CID in light gray) and ancestral (NCBD in red and CID in light gray) TS. Both ensembles are aligned on CID helix Cα1. b, map representing the contact probability between each pair of residues in the human (lower right, blue) and in the ancestral (upper left, red) TS ensembles. Probability goes from 0 (white) to 1 (dark blue/red); regions involving residues which are not present in the ancestral complex are shaded with gray. c, per-residue α-helical content of the human and ancestral TS. d and e, probability distribution, in arbitrary units, of the root mean square deviation and of the gyration radius for the human (blue) and ancestral (red) TS ensembles.
Figure 4.
Figure 4.
ϕ-values of helix formation in CID in the Cambrian-like and human complex. Ala → Gly mutations in surface-exposed positions in the helices of CIDHuman and CID1RML were introduced and the kinetic parameters for these helix-modulating mutations were obtained in stopped-flow kinetic experiments. The dissociation rate constants were obtained in displacement experiments if koff was less than ≈ 30 s−1 or otherwise from binding experiments. Using the kinetic parameters (kon and koff), ΔΔG in the transition state (ΔΔGTS) and in the bound state (ΔΔGEQ) was calculated for each mutant. The experimental conditions were 20 mm sodium phosphate, pH 7.4, and 150 mm NaCl, and the measurements were recorded at 4 °C. a, ϕ-values for helix-modulating mutations in helix 1 (Cα1) and helix 2 (Cα2) of CID1RML mapped onto the structure of the Cambrian-like protein complex (PDB entry 6ES5; Dataset S1A). b, Brønsted plot for the same helix-modulating mutations in CID1RML in the Cambrian-like complex (Dataset S1B). The data were fitted with linear regression, yielding slopes of 0.3 ± 0.1 (Cα1) and −0.02 ± 0.04 (Cα2). The error bars denote propagated standard errors. c, ϕ-values for helix-modulating mutations in helix 1 (Cα1) and helix 2/3 (Cα2/3) of CID in the human complex mapped onto the structure of the complex (PDB entry 1KBH; Dataset S1D). d, Brønsted plot for helix-modulating mutations in helix 1 (Cα1) and helix 2/3 (Cα2/3) of human CID in complex with human NCBD (Dataset S1C). Linear regression analysis yielded slopes of 0.45 ± 0.04 (Cα1) and −0.03 ± 0.02 (Cα2/3). The error bars show the propagated standard errors.
Figure 5.
Figure 5.
Mutation of a conserved salt-bridge in the Cambrian-like complex results in population of a minor bound state. The structure of (a) the Cambrian-like (PDB entry 6ES5) and (b) the human NCBD/CID complex with Arg-2104 and Asp-1068 forming the salt-bridge highlighted as stick model. NCBD is in dark gray and CID in light gray. c, stopped-flow kinetic traces were fitted globally to an induced-fit model to obtain the microscopic rate constants for each reaction step shown in the scheme. The black solid lines represent the best fit to the kinetic traces, and the residuals are shown below the curve. The experiments were performed in 20 mm sodium phosphate, pH 7.4, and 150 mm NaCl at 4 °C. d, the confidence contour plot shows the variation in χ2 as two parameters are systematically varied while the rest of the parameters are allowed to float, which can reveal covariation between parameters in a model. The color denotes the χ22min value according to the scale bar to the right. Here, the confidence contour plot showed that k2 was poorly defined. The yellow boundary represents a cutoff in χ22min of 0.8. e, the stopped-flow kinetic traces were fitted to a double exponential function to extract kobs values, which were plotted against the concentration of CID1RD1068A (Dataset S1E). The trends in the kobs values suggest one fast linear phase (black dots) which reports on binding and one slow phase with a constant kobs of 15 s−1 (gray dots). The error bars are standard errors from fitting to a double exponential function. f, binding of NCBDD/PR2104M/CID1RD1068A monitored by isothermal titration calorimetry in 20 mm sodium phosphate, pH 7.4, and 150 mm NaCl at 4 °C. Fitting to a two-state model yielded a Kd of 5.1 ± 0.3 µm (Dataset S1F).

Similar articles

Cited by

References

    1. Oates M. E., Romero P., Ishida T., Ghalwash M., Mizianty M. J., Xue B., Dosztányi Z., Uversky V. N., Obradovic Z., Kurgan L., Dunker A. K., and Gough J. (2013) D2P2: database of disordered protein predictions. Nucleic Acids Res. 41, D508–D516 10.1093/nar/gks1226 - DOI - PMC - PubMed
    1. Tantos A., Han K.-H., and Tompa P. (2012) Intrinsic disorder in cell signaling and gene transcription. Mol. Cell. Endocrinol. 348, 457–465 10.1016/j.mce.2011.07.015 - DOI - PubMed
    1. Thornton J. W. (2004) Resurrecting ancient genes: experimental analysis of extinct molecules. Nat. Rev. Genet. 5, 366–375 10.1038/nrg1324 - DOI - PubMed
    1. Hultqvist G., Åberg E., Camilloni C., Sundell G. N., Andersson E., Dogan J., Chi C. N., Vendruscolo M., and Jemth P. (2017) Emergence and evolution of an interaction between intrinsically disordered proteins. eLife 10.7554/eLife.16059 - DOI - PMC - PubMed
    1. Harman J. L., Loes A. N., Warren G. D., Heaphy M. C., Lampi K. J., and Harms M. J. (2020) Evolution of multifunctionality through a pleiotropic substitution in the innate immune protein S100A9. eLife 10.7554/eLife.54100 - DOI - PMC - PubMed

Publication types

MeSH terms

LinkOut - more resources