. 2021 Feb 12;144(1):70-91.
doi: 10.1093/brain/awaa336.

From biomechanics to pathology: predicting axonal injury from patterns of strain after traumatic brain injury

Affiliations

From biomechanics to pathology: predicting axonal injury from patterns of strain after traumatic brain injury

Cornelius K Donat et al. Brain. .

Abstract

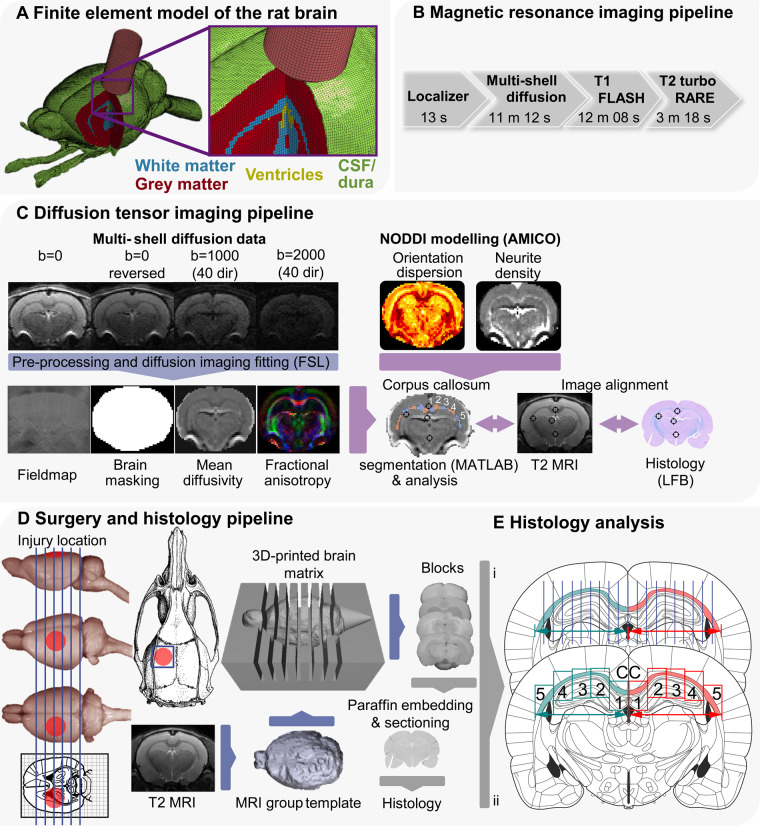
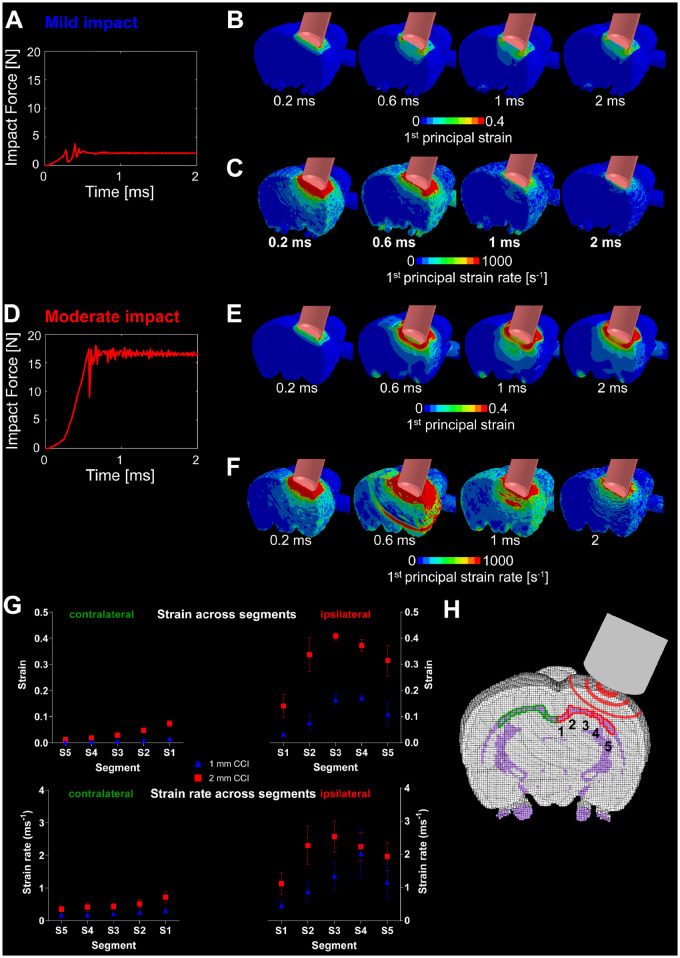
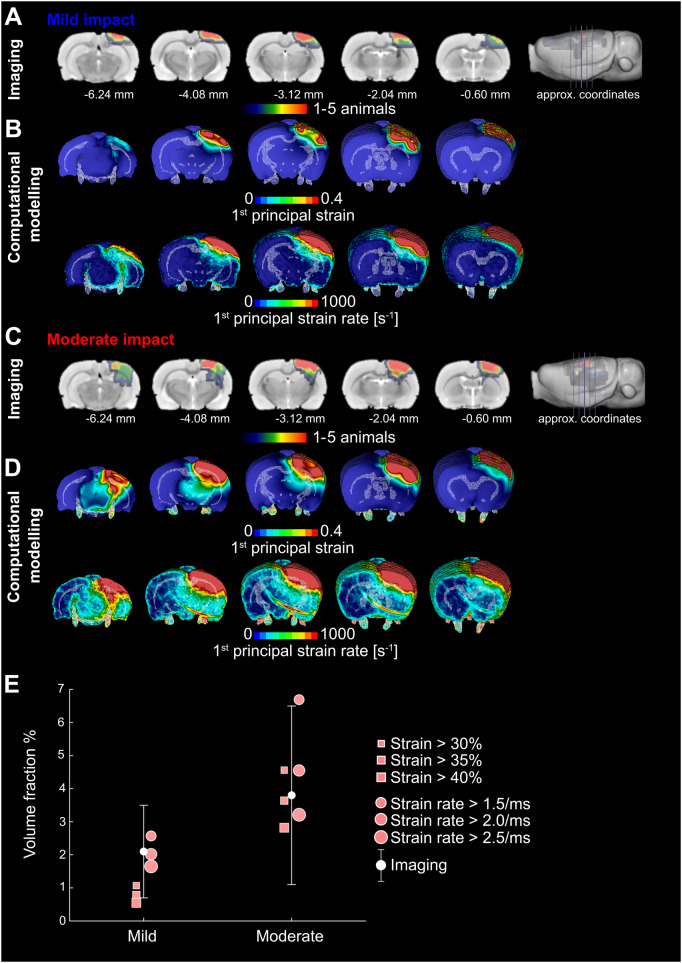
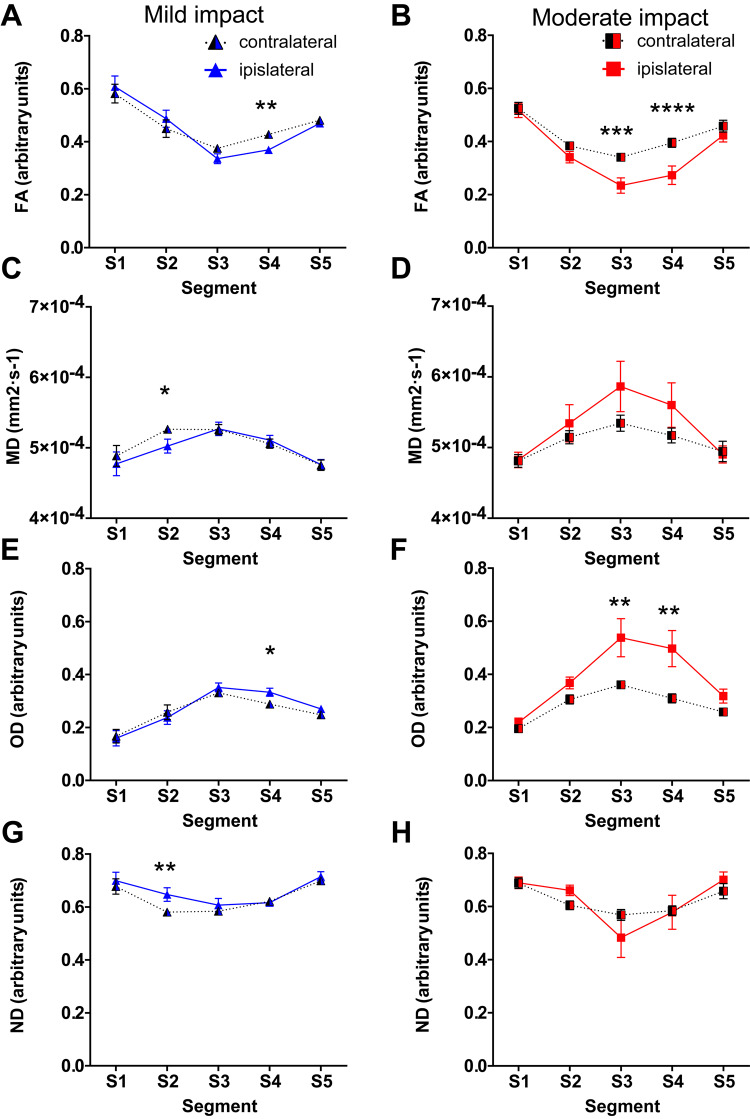
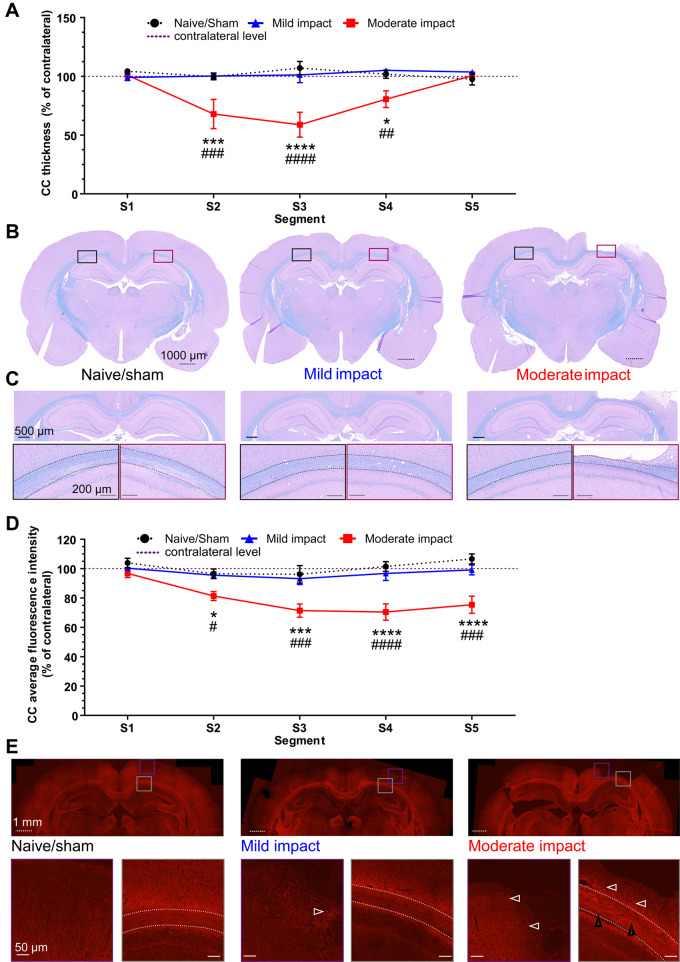
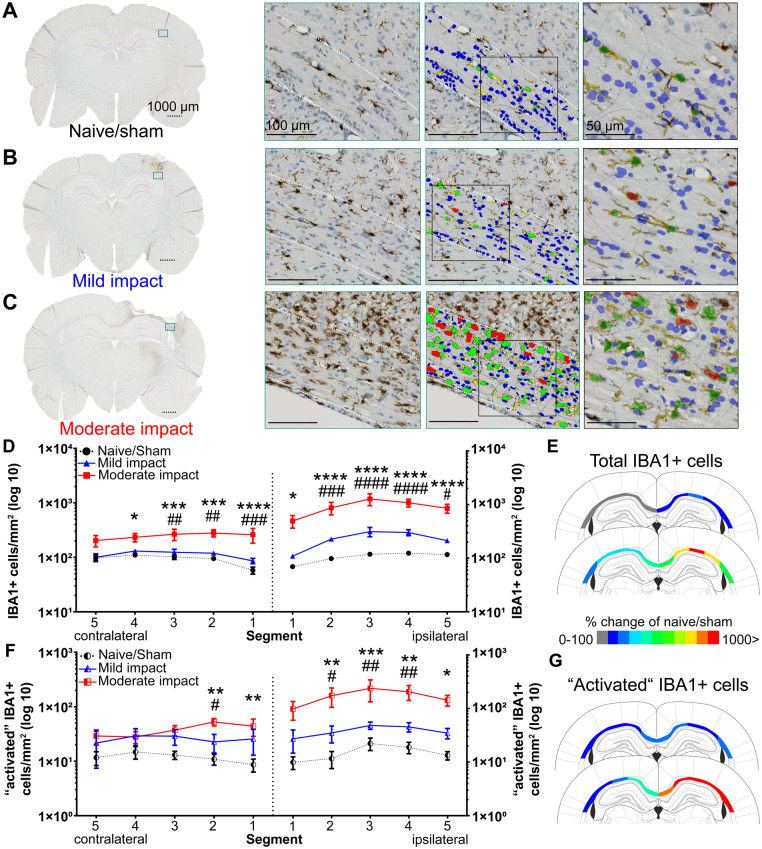
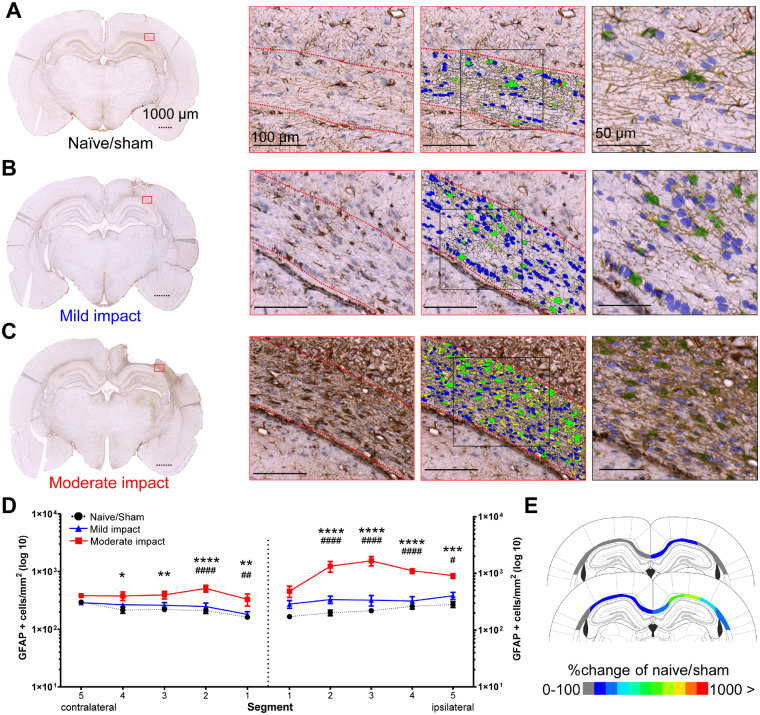
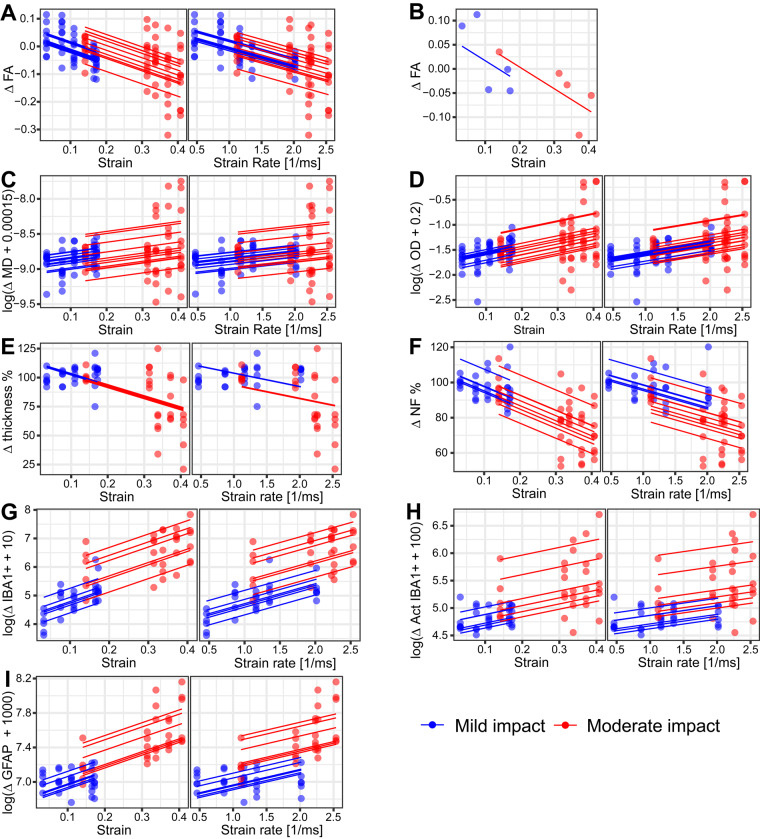
The relationship between biomechanical forces and neuropathology is key to understanding traumatic brain injury. White matter tracts are damaged by high shear forces during impact, resulting in axonal injury, a key determinant of long-term clinical outcomes. However, the relationship between biomechanical forces and patterns of white matter injuries, associated with persistent diffusion MRI abnormalities, is poorly understood. This limits the ability to predict the severity of head injuries and the design of appropriate protection. Our previously developed human finite element model of head injury predicted the location of post-traumatic neurodegeneration. A similar rat model now allows us to experimentally test whether strain patterns calculated by the model predicts in vivo MRI and histology changes. Using a controlled cortical impact, mild and moderate injuries (1 and 2 mm) were performed. Focal and axonal injuries were quantified with volumetric and diffusion 9.4 T MRI at 2 weeks post injury. Detailed analysis of the corpus callosum was conducted using multi-shell diffusion MRI and histopathology. Microglia and astrocyte density, including process parameters, along with white matter structural integrity and neurofilament expression were determined by quantitative immunohistochemistry. Linear mixed effects regression analyses for strain and strain rate with the employed outcome measures were used to ascertain how well immediate biomechanics could explain MRI and histology changes. The spatial pattern of mechanical strain and strain rate in the injured cortex shows good agreement with the probability maps of focal lesions derived from volumetric MRI. Diffusion metrics showed abnormalities in the corpus callosum, indicating white matter changes in the segments subjected to high strain, as predicted by the model. The same segments also exhibited a severity-dependent increase in glia cell density, white matter thinning and reduced neurofilament expression. Linear mixed effects regression analyses showed that mechanical strain and strain rate were significant predictors of in vivo MRI and histology changes. Specifically, strain and strain rate respectively explained 33% and 28% of the reduction in fractional anisotropy, 51% and 29% of the change in neurofilament expression and 51% and 30% of microglia density changes. The work provides evidence that strain and strain rate in the first milliseconds after injury are important factors in determining patterns of glial and axonal injury and serve as experimental validators of our computational model of traumatic brain injury. Our results provide support for the use of this model in understanding the relationship of biomechanics and neuropathology and can guide the development of head protection systems, such as airbags and helmets.

Keywords: controlled cortical impact; diffusion tensor imaging; finite element modelling; quantitative histology; traumatic brain injury.


Figures

Figure 1
Figure 1
Overview of methodology. (A) The FE model of the rat CCI. The image shows CSF (green), grey matter (red), white matter (blue), ventricles (yellow) and impactor (pink). The skull and dura are not shown. (B) MRI pipeline: diagram showing the acquisition protocol. (C) DTI pipeline: flow chart of diffusion MRI image analysis. Following the acquisition of scans, all files were converted from Bruker format to NIfTI. Post-processing was performed with FSL tools topup, bet and eddy correct before independent simultaneous diffusion and neurite orientation dispersion and density imaging fitting (AMICO). The last stage involved image alignment with T2 MRI, histology and vice versa. This alignment was based on anatomical landmarks identified in the histology staining, MRI, the Paxinos and Watson, and Waxholm rat brain atlases. The corpus callosum was manually outlined and automatically segmented. A representation of the five segments obtained across the corpus callosum in each hemisphere is presented and comparable to E(ii). (D) Surgery and histology pipeline: approximate location of craniotomy and impact is shown on the rat skull and brain. Animals were subjected to either 1 (n = 10) or 2 mm CCI (n = 11.) From T2 images, a grouped 3D template was derived, which was 3D printed with 2 mm intervals. Blocks were cut from a selection of animals (1 and 2 mm CCI: n = 6; naive/sham animals: n = 7) using the matrix and one block (4, containing the core of the contusion) was selected for paraffin embedding. From paraffinized blocks, 7 µm sections were cut and every fifth section collected on slides (three per slide), therefore covering roughly 100 µm. (E) Sections were stained and analysed according to the described protocols and segments of the corpus callosum analysed using FIJI and HALO (analysis approach i: LFB; ii: microglia, astrocytes and neurofilaments). These sections were aligned with the MRI data, based on the procedures described in C. Rat brain, skull and atlas images from Paxinos and Watson (2007) and the University of Wisconsin-Madison Brain collection (http://neurosciencelibrary.org/Specimens/rodentia/labrat/index.html).
Figure 2
Figure 2
Computational prediction of strain and strain rate following simulated impact. (A) Impact force as shown over time for mild impact. (B) Time-variant first principal strain contour for mild impact. (C) Time-variant first principal strain rate contour for mild impact. (D) Impact force as shown over time for moderate impact. (E) Time-variant first principal strain contour for moderate impact. (F) Time-variant first principal strain rate contour for moderate impact. (G) Computational prediction of strain and strain rate in five segments of the corpus callosum at approximately −3.12 mm posterior to bregma. These correspond to the maximum value of strain and strain rate for each element throughout the simulation (see Fig. 3B, D and E). Data are presented as mean (± SD) strain/strain rate of the values in each segment. (H) A sketch of the five ipsi- and contralateral segments of the corpus callosum located at approximately −3.12 mm posterior to bregma.
Figure 3
Figure 3
FE modelling predicts contusion as measured by T2 MRI. (A) Lesion probability maps after mild impact showing contusion/oedema with approximate coordinates from bregma. Colour scale indicates number of animals with visible lesions in T2-weighted images. Red–orange indicates regions where lesions were present in four or five (∼50%) of the CCI rats, green indicates regions where they were present in two or three (∼25%) and blue where a lesion was found in one post-surgery rat only; numbers indicate approximate coordinates from bregma. (B) First principal strain and strain rate predictions of the finite element model for mild injuries. These correspond to the maximum value of strain and strain rate for each element throughout the simulation. (C) Lesion probability maps after moderate injury showing contusion/oedema. (D) First principal strain and strain rate predictions of the finite element model for moderate injuries. These correspond to the maximum value of strain and strain rate for each element throughout the simulation. (E) Imaging: mean and standard deviation of the brain volume with contusion normalized by the total brain volume (volume fraction). These data are obtained from T2 lesion maps. The figure also shows the computational predictions of the volume of the brain that exceeds different values of strain and strain rate. The figure shows that the model prediction of the contusion volume is within one standard deviation of the empirical data.
Figure 4
Figure 4
Diffusion tensor imaging measures show white matter damage in corpus callosum segments subjected to highest strain. Diffusion tensor imaging measures in segments of the corpus callosum across the ipsilateral and contralateral hemispheres. Fourteen days after mild/moderate impact, mean values of: (A and B) FA; (C and D) MD; (E and F) Orientation dispersion (OD); and (G and H) Neurite density (ND). All data are presented as mean ± SEM. Mild impact: n = 10, moderate CCI: n = 11. *P < 0.05, **P < 0.01, ***P < 0.001 and ****P < 0.0001 as compared to the contralateral side.
Figure 5
Figure 5
Moderate impact causes thinning of corpus callosum in segments subjected to the high strain. (A) Thickness quantification of individual segments of the ipsilateral corpus callosum (in % of the respective contralateral segment) as measured every 500 µm. (B) Representative whole brain photomicrographs of sections stained with LFB from naive/sham animals (left), mild impact (middle) and moderate impact. (C) The entirety of the analysed corpus callosum (dotted outline) of the respective groups, with coloured rectangles showing magnified views of the contralateral and ipsilateral corpus callosum. Black dotted scale bars = 1000 µm (whole brain sections); black solid lines = 500 µm (entire corpus callosum); grey solid lines = 200 µm (magnifications). All data are presented as mean ± SEM. Naive/sham: n = 7; Mild impact: n = 6, Moderate impact CCI: n = 6. *P < 0.05, **P < 0.01, ***P < 0.001 and ****P < 0.0001 represent significant difference of moderate impact versus naive/sham animals. #P < 0.05, ##P < 0.01, ###P < 0.001 and ####P < 0.0001) represent significant difference of moderate versus mild impact. (D) Quantification of Alexa 568 immunofluorescence intensity for neurofilament staining in five segments of the corpus callosum. (E) Neurofilament Alexa 568 immunofluorescence in naive/sham (left block), mildly injured (middle block) and moderately injured animals (right block). Coloured rectangles show magnified areas of the pericontusional cortex (purple) and CC segments (grey) below the impact, indicating axonal spheroid bulbs (white arrowhead), axonal swelling and disorganization (black arrowheads) prominently in moderately injured animals (right block). White dotted scale bars correspond to 1000 µm (half brain sections) and white solid lines to 50 µm (insets). White dashed lines indicate the outline of the corpus callosum. All data are presented as mean ± SEM. Naive/sham: n = 5; mild impact: n = 6, moderate impact: n = 8. *P < 0.05, **P < 0.01, ***P < 0.001 and ****P < 0.0001 represent significant difference of moderate impact versus naive/sham animals. #P < 0.05, ##P < 0.01, ###P < 0.001 and ####P < 0.0001 represent significant difference of moderate versus mild impact.
Figure 6
Figure 6
Moderate impact causes a significant microglial response in the corpus callosum. IBA1+ cells in the corpus callosum (dotted outline) of naive/sham animals (A) and following mild (B) and moderate (C) impact. Representative whole brain photomicrographs are shown in the left panel, with a coloured rectangle showing the magnified area (middle left). Middle right: The colour-coded overlay of detected IBA+ cells (green; red indicating ‘activated’ IBA+ cells) with processes (yellow) and haematoxylin+ cells not classified as microglia (blue). Right: A magnified view with transparent overlay. Dotted scale bars = 1000 µm, solid lines = 100/50 µm. (D) HALO quantification of total IBA1+ cells in five segments of the ipsilateral and contralateral corpus callosum. (E) Colour-coded heat map, showing per cent changes of total IBA1+ cells (rounded, compared to naive/sham animals) in the individual segments of the corpus callosum of animals subjected to mild (top) and moderate impact (bottom) (F) HALO quantification of IBA1+ cells classified as ‘activated' in five segments of the ipsilateral and contralateral corpus callosum. (G) Colour-coded heat map, showing per cent changes of IBA1+ ‘activated' cells (rounded, compared to naïve/sham animals) in the individual segments of the corpus callosum of animals subjected to mild (top) and moderate impact (bottom). All data are presented as mean ± SEM. Naive/sham: n = 7; mild impact: n = 6, moderate impact: n = 6. *P < 0.05, **P < 0.01, ***P < 0.001 and ****P < 0.0001 represent significant difference of moderate impact versus naive/sham animals. #P < 0.05, ##P < 0.01, ###P < 0.001 and ####P < 0.0001 represent significant difference of moderate versus mild impact.
Figure 7
Figure 7
Moderate impact causes a significant astrocytic response in the corpus callosum. GFAP+ cells in the corpus callosum (dotted outline) of naive/sham animals (A) and following mild (B) and moderate (C) impact. Representative whole brain photomicrographs (left), with a coloured rectangle showing the magnified area (middle left). Middle: Colour-coded overlay of detected GFAP+ cells (green) with processes (yellow) and haematoxylin+ cells not classified as astrocytes (blue). Right: A magnified view with transparent overlay. Dotted scale bars = 1000 μm, solid lines = 100/50 μm. (D) HALO quantification of GFAP+ cells in five segments of the ipsilateral corpus callosum and one contralateral segment. (E) Colour-coded heat map, showing per cent changes of GFAP+ cells (rounded, compared to naïve/sham animals) in the individual segments of the corpus callosum after mild (top) and moderate impact (bottom). All data are presented mean ± SEM. Naive/sham: n = 7; 1 mm impact: n = 6, 2 mm impact: n = 6. *P < 0.05, **P < 0.01, ***P < 0.001 and ****P < 0.0001 significance difference of moderate impact versus naive/sham animals. #P < 0.05, ##P < 0.01, ###P < 0.001 and ####P < 0.0001) significant difference of moderate versus mild impact.
Figure 8
Figure 8
Linear mixed effects model correlations of FE modelling predicted strain and strain rate with DTI and histopathology measures in the corpus callosum of animals subjected to impact. Dots demonstrate experimental data (DTI and histopathology measures) in five segments of the corpus callosum. Solid lines exemplify the model predictions for individual subjects. Relationship of (A) FA and strain (left) and strain rate (right) for all animals. (B) An example of FA values in an animal subjected to mild and an animal subjected to moderate impact. Relationship of: (C) MD with strain (left) and strain rate (right); (D) orientation dispersion (OD) with strain (left) and strain rate (right); (E) corpus callosum thickness with strain (left) and strain rate (right); (F) Alexa 568 average immunofluorescence intensity for neurofilament staining with strain (left) and strain rate (right); (G) IBA1+ cells/mm2 with strain (left) and strain rate (right); (H) ‘activated’ IBA1+ cells/mm2 with strain (left) and strain rate (right); and (I) GFAP+ cells/mm2 with strain (left) and strain rate (right).

References

    1. Bain AC, Meaney DF. Tissue-level thresholds for axonal damage in an experimental model of central nervous system white matter injury. J Biomech Eng 2000; 122: 615–22. - PubMed
    1. Bayly PV, Clayton EH, Genin GM. Quantitative imaging methods for the development and validation of brain biomechanics models. Annu Rev Biomed Eng 2012; 14: 369–96. - PMC - PubMed
    1. Bechmann I, Nitsch R. Astrocytes and microglial cells incorporate degenerating fibers following entorhinal lesion: a light, confocal, and electron microscopical study using a phagocytosis-dependent labeling technique. Glia 1997; 20: 145–54. - PubMed
    1. Bennett RE, Mac Donald CL, Brody DL. Diffusion tensor imaging detects axonal injury in a mouse model of repetitive closed-skull traumatic brain injury. Neurosci Lett 2012; 513: 160–5. - PMC - PubMed
    1. Braun M, Vaibhav K, Saad NM, Fatima S, Vender JR, Baban B, et al. White matter damage after traumatic brain injury: a role for damage associated molecular patterns. Biochim Biophy Acta Mol Basis Dis 2017; 1863 (Pt B): 2614–26. - PMC - PubMed

Publication types