. 2021 Sep 2;22(5):bbaa405.
doi: 10.1093/bib/bbaa405.

Computational methods for the prediction of chromatin interaction and organization using sequence and epigenomic profiles

Affiliations

Computational methods for the prediction of chromatin interaction and organization using sequence and epigenomic profiles

Huan Tao et al. Brief Bioinform. .

Abstract

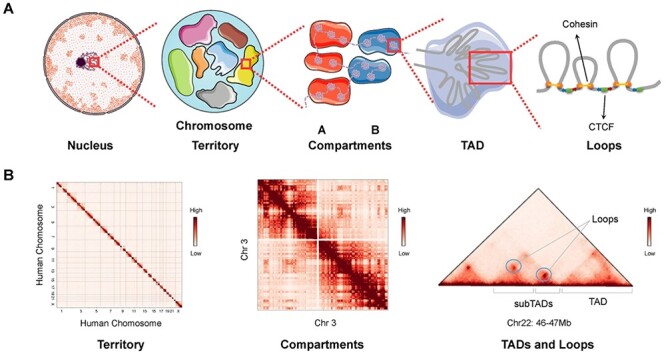
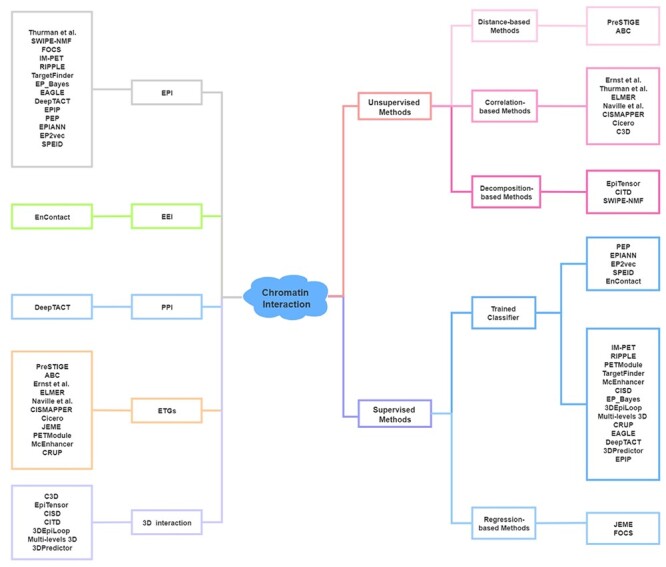
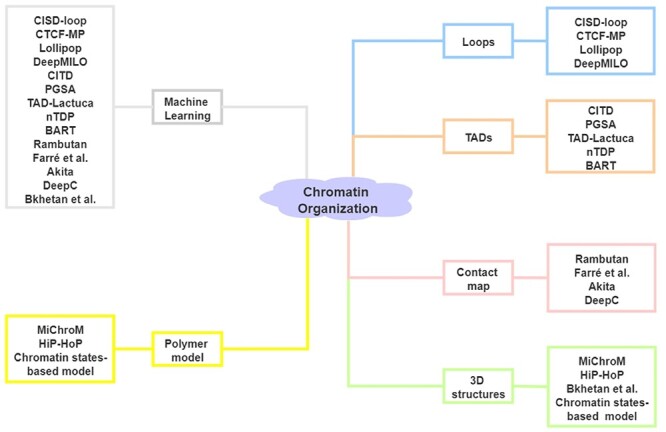
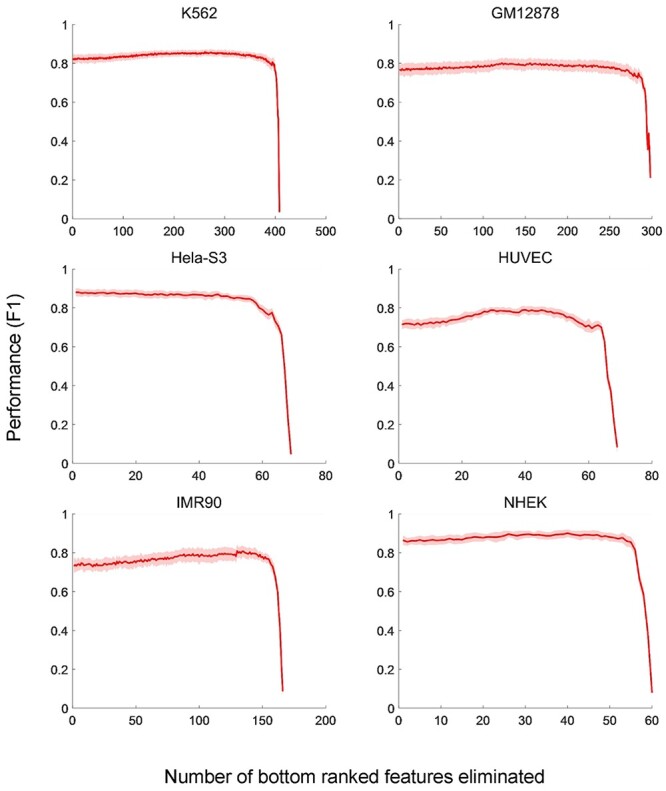
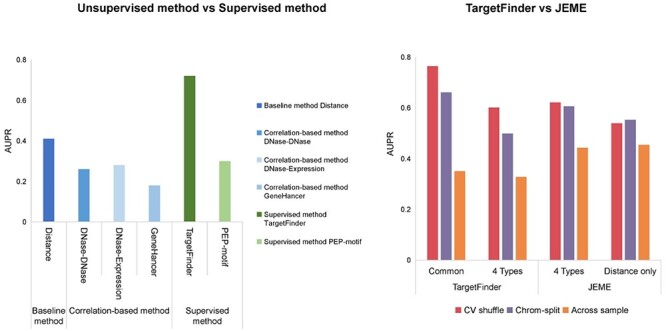
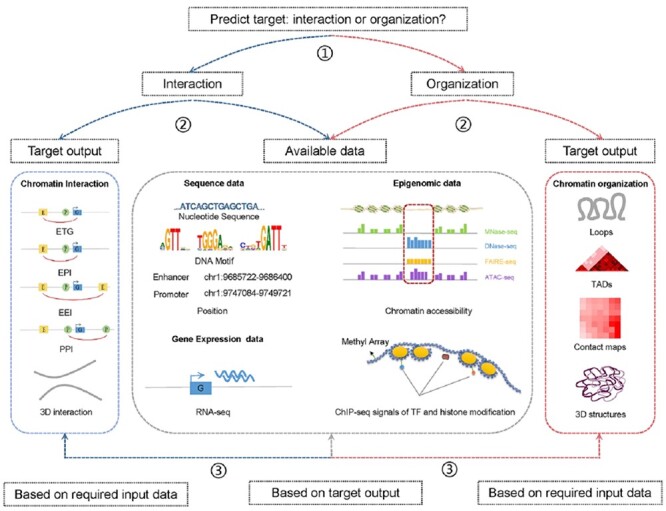
The exploration of three-dimensional chromatin interaction and organization provides insight into mechanisms underlying gene regulation, cell differentiation and disease development. Advances in chromosome conformation capture technologies, such as high-throughput chromosome conformation capture (Hi-C) and chromatin interaction analysis by paired-end tag (ChIA-PET), have enabled the exploration of chromatin interaction and organization. However, high-resolution Hi-C and ChIA-PET data are only available for a limited number of cell lines, and their acquisition is costly, time consuming, laborious and affected by theoretical limitations. Increasing evidence shows that DNA sequence and epigenomic features are informative predictors of regulatory interaction and chromatin architecture. Based on these features, numerous computational methods have been developed for the prediction of chromatin interaction and organization, whereas they are not extensively applied in biomedical study. A systematical study to summarize and evaluate such methods is still needed to facilitate their application. Here, we summarize 48 computational methods for the prediction of chromatin interaction and organization using sequence and epigenomic profiles, categorize them and compare their performance. Besides, we provide a comprehensive guideline for the selection of suitable methods to predict chromatin interaction and organization based on available data and biological question of interest.

Keywords: DNA sequence and epigenomic features; gene regulation; methods evaluation; three-dimensional genome organization.


Figures

Figure 1
Figure 1
Hierarchical genome organization. (A) Multilevel 3D genome organizations. Chromosome territory, compartments, TADs and loops can be observed from left to right. Each chromosome territory is denoted by different colors. Compartment A and B are indicated by red and blue background, respectively. TADs are formed by LE. The ring-shaped cohesin squeeze the chromatin into loops and halt when they encounter the boundary elements CTCF in the specific orientation (indicated by the blue and red arrows) at two sites of cohesin ring. (B) Hi-C matrices of hierarchical chromatin organizations. Interchromosomal interaction between human chromosomes presents the organization of chromosome territories. Intrachromosomal interaction between chromosome 3 indicates the chromatin compartments. Matrix of a 1 Mb width subregion on chromosome 22 shows TADs, subTADs and loops, which are denoted as punctate signals. Hi-C matrices in panel B are generated from Rao’s (access code GSE63525) Hi-C data in GM12878 cell line.
Figure 2
Figure 2
Computational methods for the prediction of chromatin interaction. Left: Category of methods based on output. Right: Category of methods based on algorithm. Sequence-based methods (PEP, EPIANN, EP2vec, SPEID and EnContact) of trained classifier methods are listed separately.
Figure 3
Figure 3
Computational methods for the prediction of chromatin organization. Left: Category of methods based on algorithm. Right: Category of methods based on output.
Figure 4
Figure 4
Performances of TargetFinder using different sets of genomic features by feature elimination. On six cell lines, the F1 scores of TargerFinder are evaluated by 10-fold cross-validation with the input genomic features eliminated one by one recursively according to their predictive importance. The mean values and the SDs of F1 scores in each 10-fold cross-validation are presented.
Figure 5
Figure 5
Performance of unsupervised and supervised methods. (A) Comparison of performance between distance-based, correlation-based and supervised methods using BENGI datasets. The AUPR scores of these six methods were evaluated by Moore et al [48]. (B) Comparison of regression-based model and trained classifier methods. Performances of TargetFinder and JEME on JEMEs ‘random target’ datasets using cross-validation with shuffling and chromosome-split strategies [82]. TargetFinder was validated with all features common in K562 and GM12878, and four epigenomic features (DNase-seq data and ChIP-seq data of H3K4me1, H3K27ac and H3K27me3) applied in JEME. JEME was validated with its four input features and distance feature, respectively. Across sample validation: TargetFinder and JEME were trained with K562 data and tested with GM12878 data. The AUPR scores of TargetFinder and JEME were evaluated by Cao and Fullwood [82].
Figure 6
Figure 6
Pipeline of selecting computational methods for the prediction of chromatin and organization. ① Determine the predict target. ② Select method based on target output or available data. ③ Choose method based on required input data or target output within methods filtered from the second step.

Similar articles

Cited by

References

    1. Dekker J, Rippe K, Dekker M, et al. . Capturing chromosome conformation. Science 2002;295:1306–11. - PubMed
    1. Simonis M, Klous P, Splinter E, et al. . Nuclear organization of active and inactive chromatin domains uncovered by chromosome conformation capture-on-chip (4C). Nat Genet 2006;38:1348–54. - PubMed
    1. Dostie J, Richmond TA, Arnaout RA, et al. . Chromosome conformation capture carbon copy (5C): a massively parallel solution for mapping interactions between genomic elements. Genome Res 2006;16:1299–309. - PMC - PubMed
    1. Lieberman-Aiden E, Berkum N, Williams L, et al. . Comprehensive mapping of long-range interactions reveals folding principles of the human genome. Science 2009;326:289–93. - PMC - PubMed
    1. Forcato M, Nicoletti C, Pal K, et al. . Comparison of computational methods for hi-C data analysis. Nat Methods 2017;14:679–85. - PMC - PubMed

Publication types