

Age-related miRNome landscape of cumulus oophorus cells during controlled ovarian stimulation protocols in IVF cycles
- PMID: 33454781
- PMCID: PMC8058597
- DOI: 10.1093/humrep/deaa364
Age-related miRNome landscape of cumulus oophorus cells during controlled ovarian stimulation protocols in IVF cycles
Abstract
Study question: Is the microRNA (miRNA) expression pattern of cumulus oophorus cells (COCs) in women undergoing medically assisted reproduction (MAR) procedures differentially modulated according to patient age and gonadotropin treatment strategy?
Summary answer: Maternal age is an independent factor impacting miRNA expression in COCs while gonadotropin treatment may affect follicular miRNA expression and IVF efficacy.
What is known already: Epigenetic mechanisms in female infertility are complex and poorly studied. DNA methylation, histone modifications, miRNAs and nucleosome positioning influence cellular machinery through positive and negative feedback mechanisms either alone or interactively. miRNAs are important regulators during oogenesis, spermatogenesis and early embryogenesis, and are reported to play a role in regulating crosstalk between the oocyte and COCs. Although miRNome analysis has been performed in female human reproductive tissues (endometrium, myometrium, cervix and ovaries), epigenetic modifications in women with infertility have not been explored in detail. In addition, the impact of gonadotropin treatments during MAR on miRNA expression in COCs has not been fully investigated.
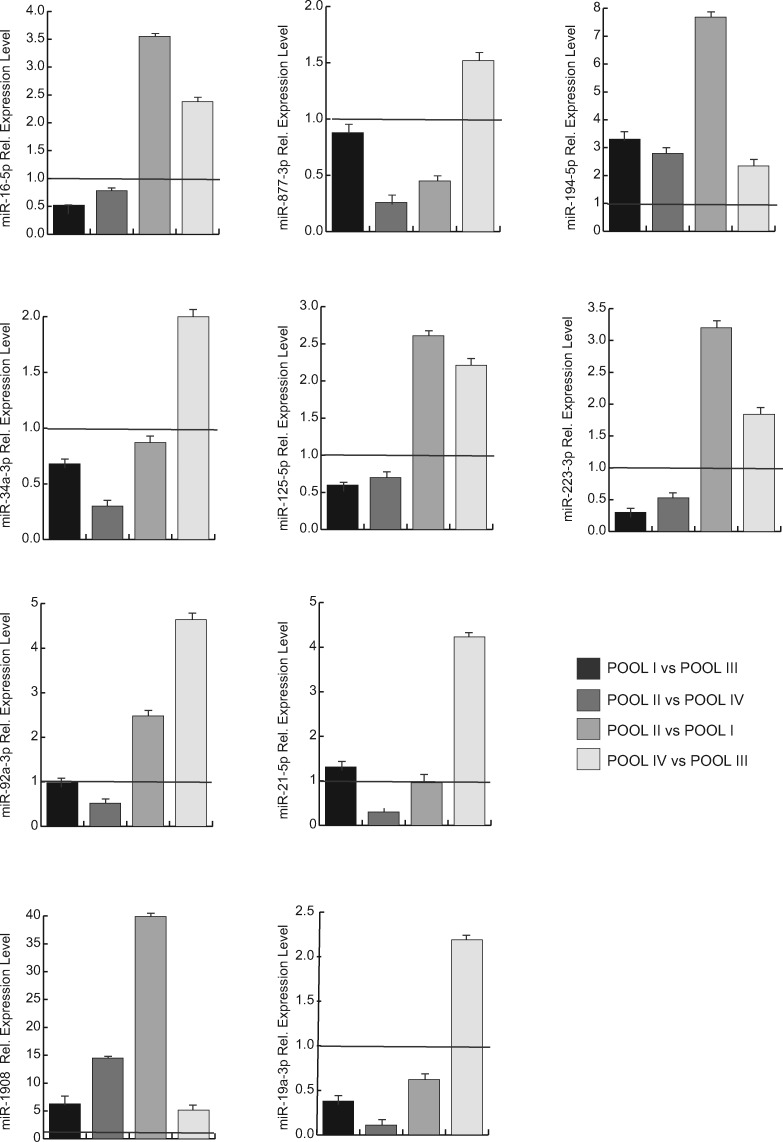
Study design, size, duration: This study was carried out in 53 COC samples obtained from mature metaphase II (MII) oocytes in 53 women undergoing MAR treatment. A total of 38 samples for assay development were pooled by maternal age and gonadotropin treatment into four predetermined subgroups: ≥36 years and recombinant human FSH (r-hFSH), n = 10; ≥36 years and r-hFSH+ recombinant human-luteinizing hormone (r-hLH), n = 10; ≤35 years and r-hFSH, n = 9; ≤35 years and r-hFSH+r-hLH, n = 9. miRNome profiles were determined and compared between subgroups. Expression of defined miRNAs was validated in the remaining fifteen samples, representative of each subgroup, by quantitative polymerase chain reaction (PCR).
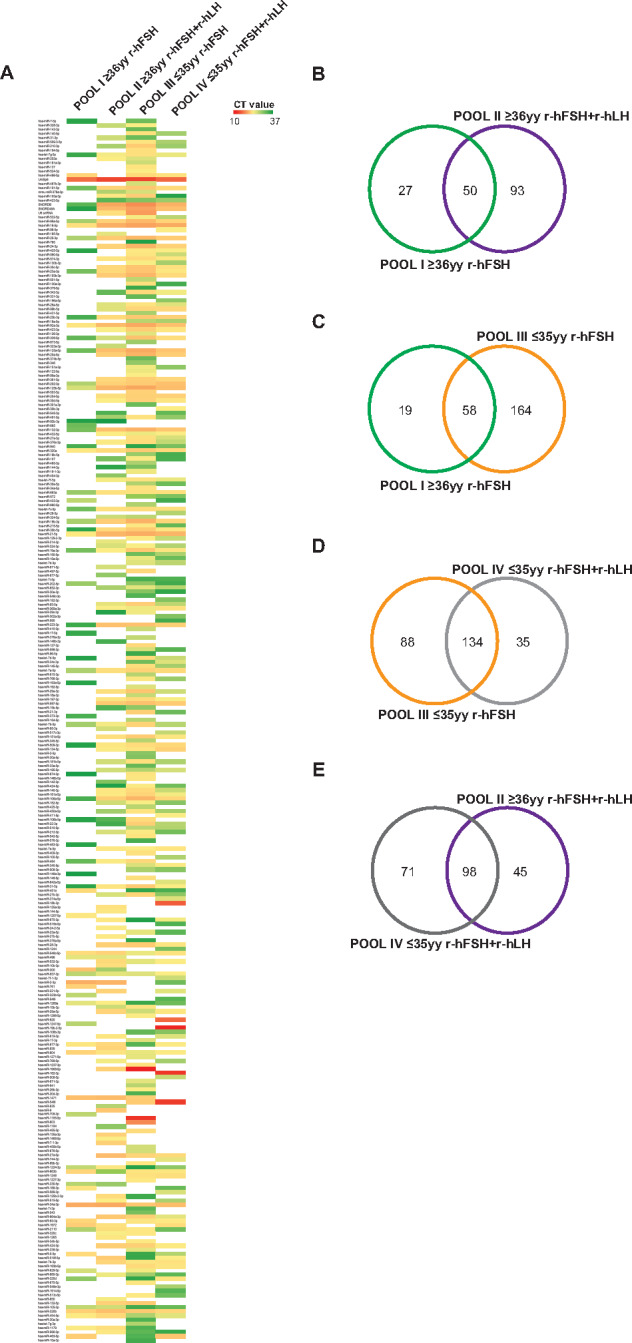
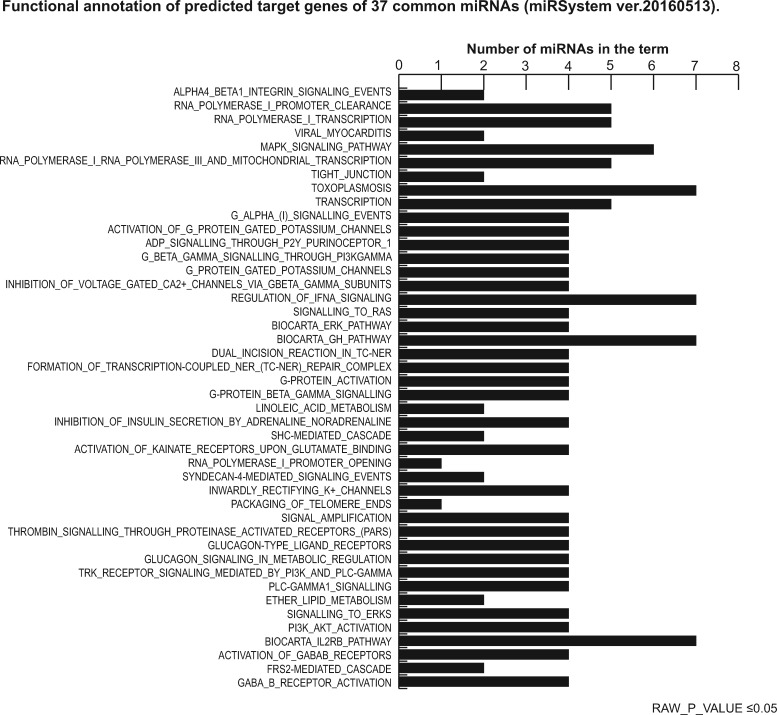
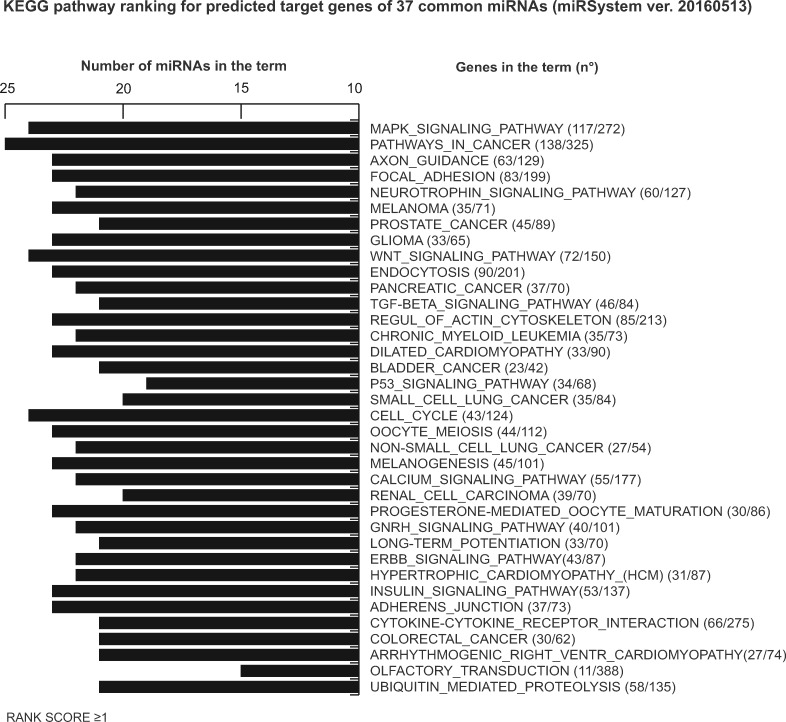
Participants/materials, setting, methods: COCs were processed for miRNA-enriched total RNA extraction and pooled in homogeneous subgroups to obtain a sufficient amount and quality of starting material to perform the analysis. Each pooled sample underwent miRNA profiling using PCR assay system to examine expression of 752 human miRNAs without pre-amplification. Data were analyzed using the delta-delta Ct method for relative quantitation and prediction of target genes (with at least four algorithms predicting the same miRNA-gene interaction pair (HIT)>4). The miRSystem database provided functional annotation enrichment (raw P-value <0.05) of co-expressed miRNAs.
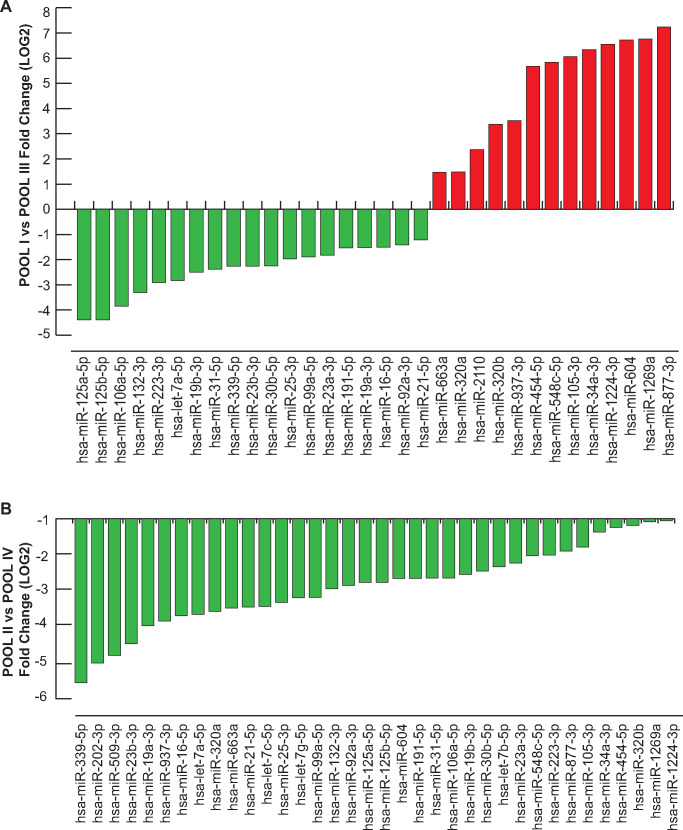
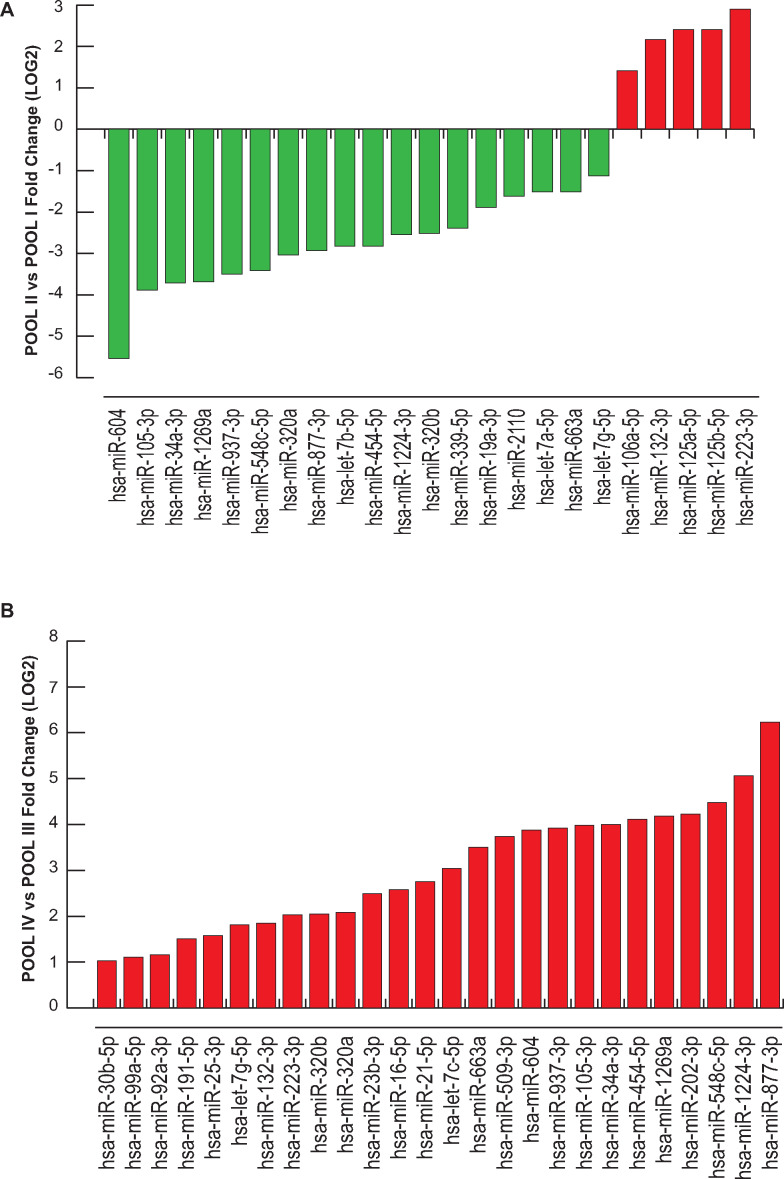
Main results and the role of chance: We found distinctive miRNA expression profiles in each subgroup correlating with age and MAR stimulation. In addition, a number of selective and co-expressed miRNAs were revealed by comparative analysis. A cluster of 37 miRNAs were commonly but differentially expressed in all four pools. Significant differences were observed in expression regulation of 37 miRNAs between age groups (≤35 or ≥36) in women receiving r-hFSH+r-hLH compared to those receiving r-hFSH alone. Higher concentrations and increased numbers of miRNAs were recorded in younger than in older patients, regardless of treatment. Functional and expression studies performed to retrieve common miRNome profiles revealed an enrichment of biological functions in oocyte growth and maturation, embryo development, steroidogenesis, ovarian hyperstimulation, apoptosis and cell survival, glucagon and lipid metabolism, and cell trafficking. The highest scored pathways of target genes of the 37 common miRNAs were associated with mitogen-activated protein kinase (MAPK) signaling pathways, G alpha signaling, transcription regulation, tight junctions, RNA polymerase I and III, and mitochondrial transcription. We identified a potential age- and MAR stimulation-dependent signature in the miRNA landscape of COCs.
Limitations, reasons for caution: We cannot rule out the possibility that other unknown individual genetic or clinical factors may have interfered with the reported results. Since miRNA profiling was conducted with a predefined array of target probes, other miRNA molecules, potentially modulated by age and hormonal stimulation, may have been missed in this study.
Wider implications of the findings: miRNA expression in COCs is modulated by gonadotropin treatment and correlates strongly with age. A better understanding of the expression patterns and functions of miRNAs may lead to the development of novel therapeutics to treat ovarian dysfunction and improve fertility in older women.
Study funding/competing interest: This study was funded by Merck KGaA, Darmstadt, Germany. All authors declared no competing interest, except SL and TD who are fully employed by Merck KGaA.
Trial registration number: N/A.
Keywords: aging; cumulus oophorus cells; epigenetics; gonadotropin stimulation; medically assisted reproduction; miRNA.
© The Author(s) 2021. Published by Oxford University Press on behalf of European Society of Human Reproduction and Embryology.
Figures
References
-
- Battaglia R, Vento ME, Ragusa M, Barbagallo D, La Ferlita A, Di Emidio G, Borzi P, Artini PG, Scollo P, Tatone C. et al. MicroRNAs are stored in human MII oocyte and their expression profile changes in reproductive aging. Biol Reprod 2016;95:131. - PubMed
-
- Belikov S, , Holmqvist P-H, , Åstrand C, , Wrange Ö. Nuclear factor 1 and octamer transcription factor 1 binding preset the chromatin structure of the mouse mammary tumor virus promoter for hormone induction. J Biol Chem 2004;279:49857–49867. - PubMed
Publication types
MeSH terms
LinkOut - more resources
Full Text Sources
Other Literature Sources
Medical
Research Materials
