. 2021 Feb;10(4):1297-1313.
doi: 10.1002/cam4.3727. Epub 2021 Jan 16.

N-glycan signature of serum immunoglobulins as a diagnostic biomarker of urothelial carcinomas

Affiliations

N-glycan signature of serum immunoglobulins as a diagnostic biomarker of urothelial carcinomas

Hirotake Kodama et al. Cancer Med. 2021 Feb.

Abstract

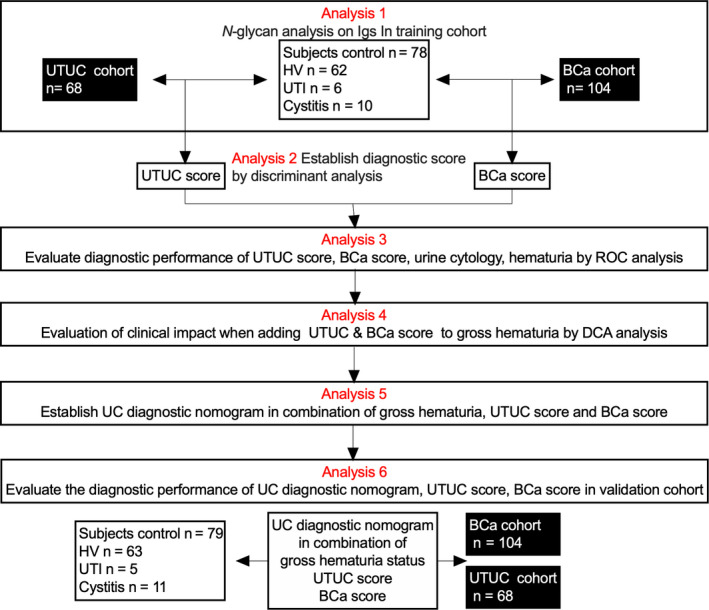
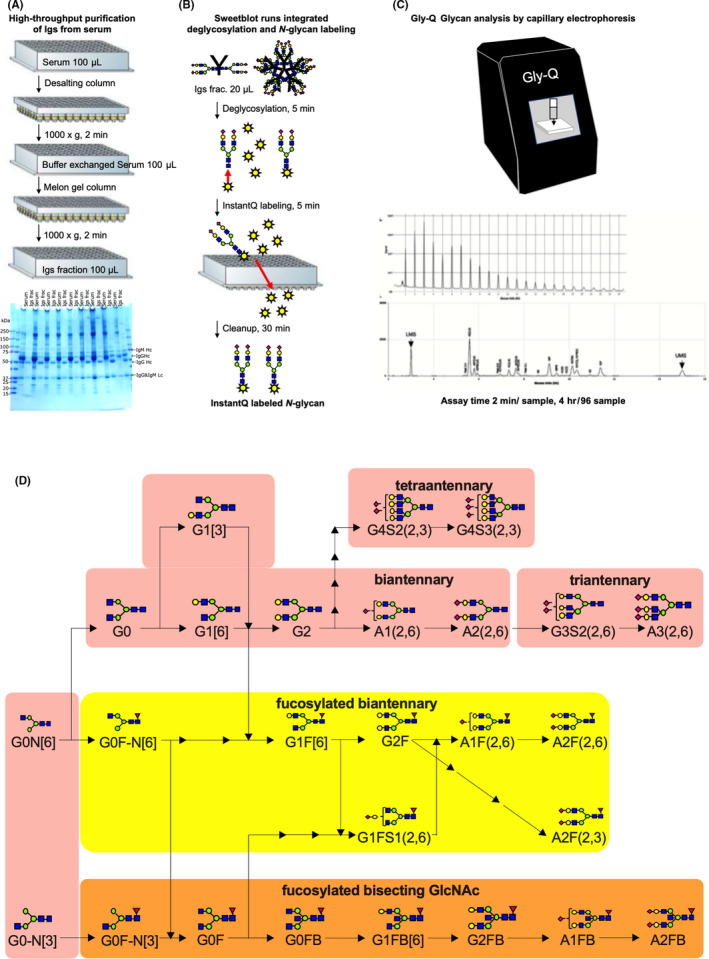
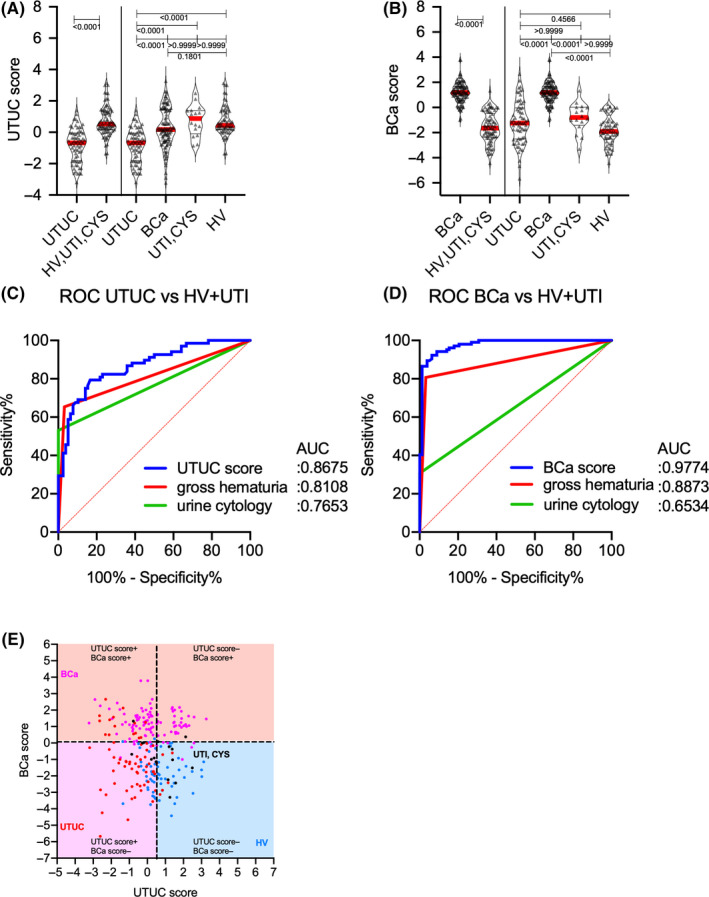
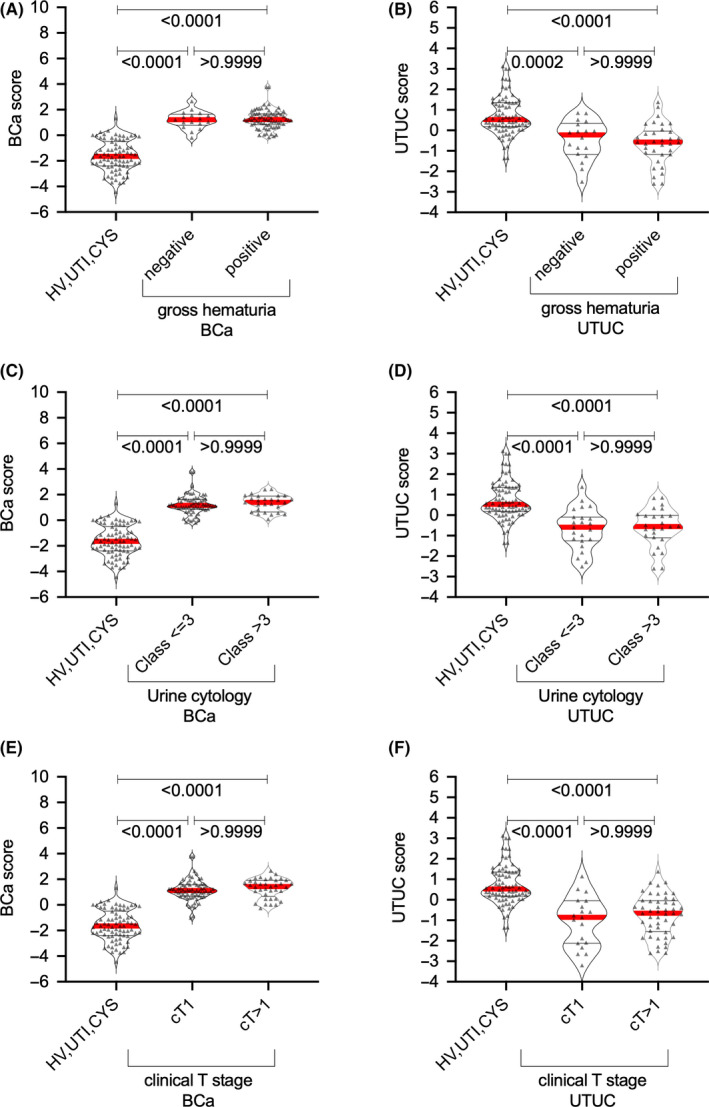
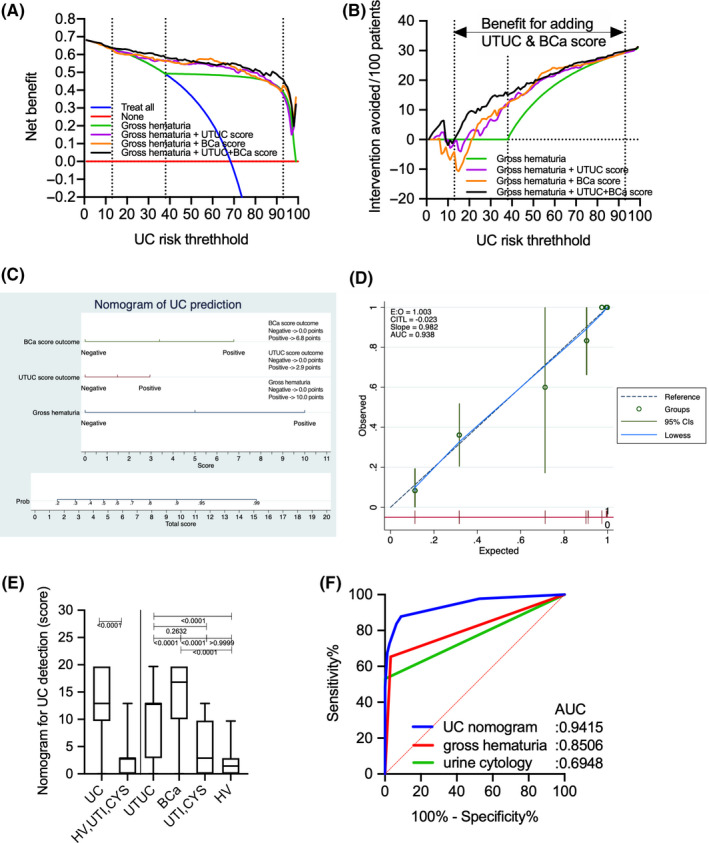
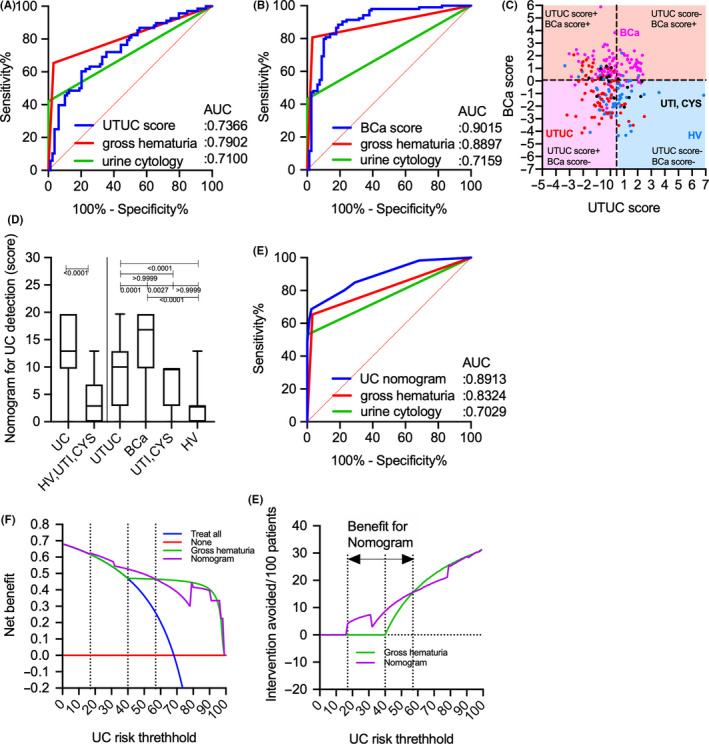
Discriminating between urothelial carcinoma (UC), including bladder cancer (BCa) and upper urinary tract UC (UTUC), is often challenging. Thus, the current study evaluated the diagnostic performance of N-glycosylation signatures of immunoglobulins (Igs) for detecting UC, including BCa and UTUC. N-glycosylation signatures of Igs from serum samples of the training cohort, including 104 BCa, 68 UTUC, 10 urinary tract infection, and 5 cystitis cases, as well as 62 healthy volunteers, were measured retrospectively using automated capillary-electrophoresis-based N-glycomics. UTUC or BCa scores were then established through discriminant analysis using N-glycan signatures of Igs. Diagnostic performance was evaluated using the area under receiver operating characteristics curve (AUC) and decision curve analyses (DCA). Our result showed that BCa and UTUC scores for discriminating BCa (AUC: 0.977) and UTUC (AUC: 0.867), respectively, provided significantly better clinical performance compared to urine cytology, gross hematuria, or clinical T1 cases. DCA revealed that adding BCa and UTUC scores to gross hematuria status was the best combination for detecting UC and avoiding the need for more intervention without overlooking UC (risk threshold: 13%-93%). The UC nomogram based on the combination of gross hematuria, UTUC score, and BCa score could detect UC with an AUC of 0.891, indicating significantly better performance compared to gross hematuria status in the validation cohort (251 patients). The limitations of this study include its small sample size and retrospective nature. The UC nomogram based on gross hematuria and N-glycosylation signatures of Igs can be a promising approach for the diagnosis of UC.

Keywords: N-glycosylation signatures; capillary-electrophoresis; diagnostic biomarker; immunogloburins; urothelial carcinoma.


Conflict of interest statement

The authors have no conflicts of interest.

Figures

FIGURE 1
FIGURE 1
Flow diagram of the study design. Training cohort serum samples collected from patients with UTUC, BCa, CYS, and UTI, as well as from healthy volunteers, were subjected to N‐glycan analysis of immunoglobulins (Analysis 1). Discriminant analysis for the detection of UTUC and BCa was conducted using serum levels of the 26 types of N‐glycans on Igs analyzed for each patient, after which UTUC and BCa scores were established (Analysis 2). The diagnostic performances of the UTUC score, BCa score, urine cytology, and gross hematuria status were compared using ROC analysis (Analysis 3). The clinical impact of adding the UTUC and BCa scores to the base diagnostic model was evaluated using DCA (Analysis 4). The urothelial carcinoma diagnostic nomogram was established based on a combination of UTUC and BCa scores (Analysis 5). The diagnostic performance of the UTUC and BCa scores and clinical impact of the UC nomogram were evaluated using ROC analysis and DCA in the validation cohort (Analysis 6). BCa, bladder cancer; DCA, decision curve analysis; HV, healthy volunteer; ROC, receiver operating characteristic; UTI, urinary tract infection; UTUC, upper urinary tract urothelial carcinoma; Igs, immunoglobulins; CYS, cystitis.
FIGURE 2
FIGURE 2
Schematic of the workflow for capillary‐electrophoresis‐based high‐throughput clinical N‐glycan analysis. (A) In total, 100‐µL aliquots of serum samples were applied to high‐throughput purification of Igs. The gel image shows representative Coomassie brilliant blue‐stained band patterns of the whole serum and purified Ig samples on sodium dodecyl sulfate‐polyacrylamide gel. (B) In total, 22‐µL aliquots of purified Ig samples were applied to the SweetBlot™ instrument (System Instruments, Hachioji, Japan) for deglycosylation of Igs and InstantQ labeling of the N‐glycans. (C) Capillary electrophoresis‐based N‐glycan analysis of InstantQ‐labeled N‐glycans from purified Ig samples. (D) A total of 26 N‐glycans were identified in the purified Ig samples and were indicated in the synthetic pathway of N‐glycans. Identified N‐glycan structures are indicated by monosaccharide symbols: yellow circles, galactose (Gal); green circles, mannose (Man); blue squares, N‐acetylglucosamine (GlcNAc); red triangle, fucose (Fuc) and purple diamonds, sialic acid. Igs, immunoglobulins.
FIGURE 3
FIGURE 3
Graphs showing the serum levels of Ig in patients with UTUC, BCa, and UTI, as well as HVs, in the training cohort. (A) Total Ig levels (IgG1–4 + IgM +IgA) in patients with UTUC, BCa, and UTI and HVs. (B) Serum levels of IgM in patients with UTUC, BCa, and UTI, as well as HVs. (C) Serum levels of IgA in patients with UTUC, BCa, and UTI, as well as HVs. (D–G) Serum levels of IgG (IgG1–4) in patients with UTUC, BCa, and UTI, as well as HVs. Data are representative of three independent experiments. Ig, immunoglobulin; UTUC, upper urinary tract urothelial carcinoma; BCa, bladder cancer; UTI, urinary tract infection; HVs, healthy volunteers;
FIGURE 4
FIGURE 4
N‐glycan signature of immunoglobulins in the training cohort. Serum N‐glycans levels in patients with upper urinary tract urothelial carcinoma, bladder cancer, and urinary tract infection, as well as healthy volunteers. BCa, bladder cancer; HV, healthy volunteer; UTI, urinary tract infection; UTUC, upper urinary tract urothelial carcinoma.
FIGURE 5
FIGURE 5
Upper urinary tract urothelial carcinoma and bladder cancer scores for the detection of the conditions in the training cohort. (A) UTUC score levels in patients with UTUC, BCa, and UTI, as well as HVs. (B) BCa score levels in patients with UTUC, BCa, and UTI, as well as HVs. (C) ROC curve analysis of UTUC score, gross hematuria, and urine cytology results for the detection of UTUC. (D) ROC curve analysis of BCa score, gross hematuria, and urine cytology for the detection of BCa. (E) Scatter diagram of UTUC score and BCa score. AUC, area under curve; BCa, bladder cancer; HV, healthy volunteer; UTI, urinary tract infection; UTUC, upper urinary tract urothelial carcinoma; ROC curve, receiver operating characteristic curve.
FIGURE 6
FIGURE 6
Association between upper urinary tract urothelial carcinoma and bladder cancer scores and gross hematuria status, urine cytology, and clinical T stage in the training cohort. Association between (A) UTUC score or (B) BCa score and gross hematuria status. Association between (C) UTUC score or (D) BCa score (D) and urine cytology status. Association between (E) UTUC score or (F) BCa score and clinical T stage. BCa, bladder cancer; HV, healthy volunteer; UTI, urinary tract infection; UTUC, upper urinary tract urothelial carcinoma.
FIGURE 7
FIGURE 7
Comparison of decision curve plots with net benefit for the relevant risk threshold between the base model (gross hematuria), base model +upper urinary tract urothelial carcinoma score, base model +bladder cancer score, and base model +upper urinary tract urothelial carcinoma +bladder cancer scores in the training cohort. (A) Decision curve plots showing the net benefit for detecting urothelial carcinoma (UC). (B) Decision curve plots showing the intervention avoided per 100 patients; plots were developed using the rmda package of R statistical software. (C) Logistic regression analysis‐based nomogram for the prediction of UC. (D) Calibration plot depicting the calibration of the UC nomogram. (E) Boxplot of UC and non‐UC (HV, UTI, and CYS) based on the UC nomogram, gross hematuria, and urine cytology. (F) Receiver operating characteristic curve analysis of the UC nomogram, gross hematuria, and urine cytology for the prediction of UC. UC, urothelial carcinoma; BCa, bladder cancer; HV, healthy volunteer; UTI, urinary tract infection.
FIGURE 8
FIGURE 8
UTUC or BCa scores for the detection of conditions and comparison of decision curve plots with net benefit for the relevant risk threshold between the base model (gross hematuria) and the UC nomogram in the validation cohort. (A) ROC curve analysis of the UTUC score, gross hematuria, and urine cytology for the detection of UTUC. (B) ROC curve analysis of the BCa score, gross hematuria, and urine cytology for the detection of BCa. (C) Scatter diagram of the UTUC and BCa scores. (D) Boxplot of UC and non‐UC (HV, UTI, and CYS) based on the UC nomogram, gross hematuria, and urine cytology. (E) ROC curve analysis of the UC nomogram, gross hematuria, and urine cytology for the prediction of UC. (F) Decision curve plots showing the net benefit for detecting UC. (G) Decision curve plots showing the intervention avoided per 100 patients; plots were developed using the rmda package of R statistical software. AUC, area under curve; BCa, bladder cancer; CI, confidence interval; CITL, calibration‐in‐the‐large; HV, healthy volunteer; PPV, positive predictive value; NPV, negative predictive value; ROC, receiver operating characteristic; UC, urothelial carcinoma. UTI, urinary tract infection; UTUC, upper urinary tract urothelial carcinoma.

References

    1. Park JC, Hahn NM. Bladder cancer: a disease ripe for major advances. Clin Adv Hematol Oncol. 2014;12:838‐845. - PubMed
    1. Munoz JJ, Ellison LM. Upper tract urothelial neoplasms: incidence and survival during the last 2 decades. J Urol. 2000;164:1523‐1525. - PubMed
    1. Siegel R, Naishadham D, Jemal A. Cancer statistics, 2012. CA Cancer J Clin. 2012;62:10‐29. - PubMed
    1. Inman BA, Tran VT, Fradet Y, Lacombe L. Carcinoma of the upper urinary tract: predictors of survival and competing causes of mortality. Cancer. 2009;115:2853‐2862. - PubMed
    1. Cowan NC. CT urography for hematuria. Nat Rev Urol. 2012;9:218‐226. - PubMed

Publication types

LinkOut - more resources