

A big-data driven approach to analyzing and modeling human mobility trend under non-pharmaceutical interventions during COVID-19 pandemic
- PMID: 33456212
- PMCID: PMC7796660
- DOI: 10.1016/j.trc.2020.102955
A big-data driven approach to analyzing and modeling human mobility trend under non-pharmaceutical interventions during COVID-19 pandemic
Abstract
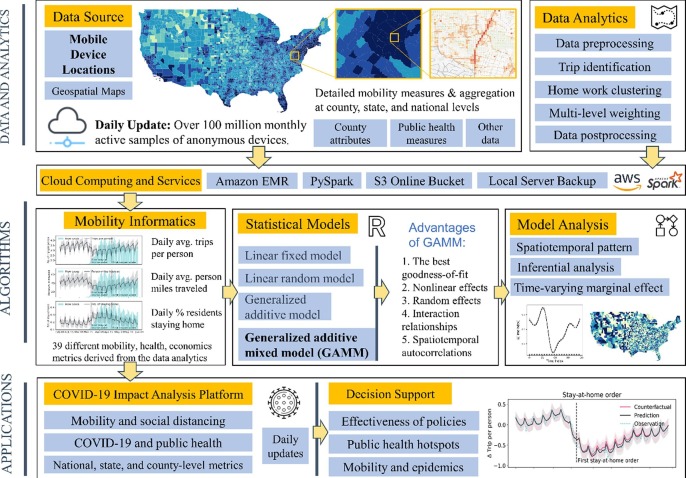
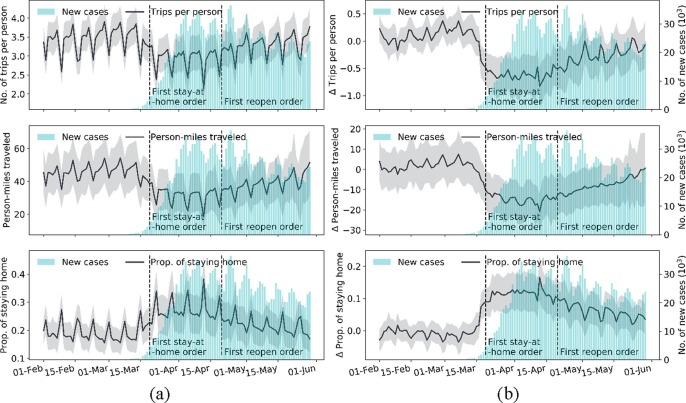
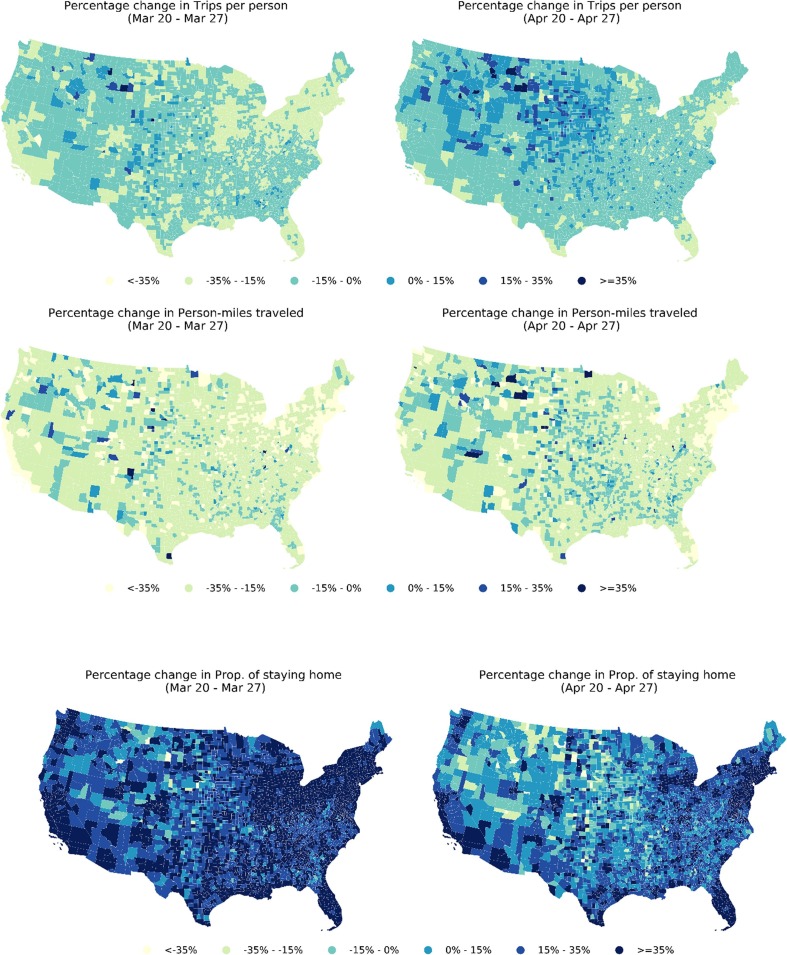
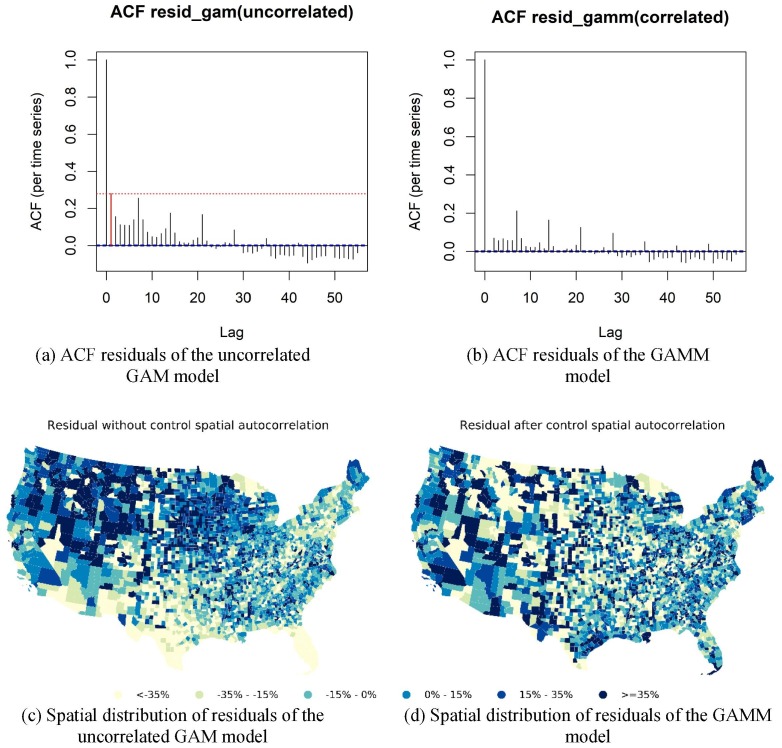
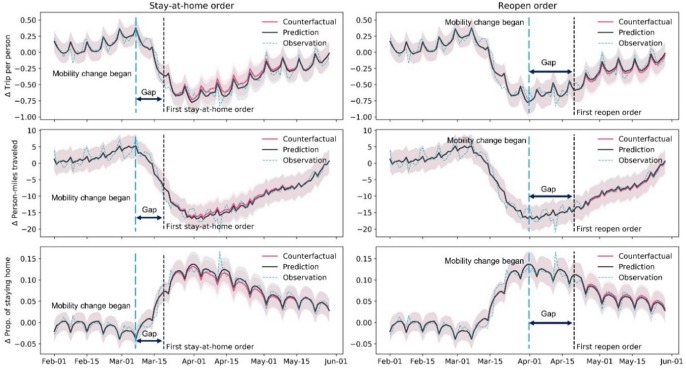
During the unprecedented coronavirus disease 2019 (COVID-19) challenge, non-pharmaceutical interventions became a widely adopted strategy to limit physical movements and interactions to mitigate virus transmissions. For situational awareness and decision-support, quickly available yet accurate big-data analytics about human mobility and social distancing is invaluable to agencies and decision-makers. This paper presents a big-data-driven analytical framework that ingests terabytes of data on a daily basis and quantitatively assesses the human mobility trend during COVID-19. Using mobile device location data of over 150 million monthly active samples in the United States (U.S.), the study successfully measures human mobility with three main metrics at the county level: daily average number of trips per person; daily average person-miles traveled; and daily percentage of residents staying home. A set of generalized additive mixed models is employed to disentangle the policy effect on human mobility from other confounding effects including virus effect, socio-demographic effect, weather effect, industry effect, and spatiotemporal autocorrelation. Results reveal the policy plays a limited, time-decreasing, and region-specific effect on human movement. The stay-at-home orders only contribute to a 3.5%-7.9% decrease in human mobility, while the reopening guidelines lead to a 1.6%-5.2% mobility increase. Results also indicate a reasonable spatial heterogeneity among the U.S. counties, wherein the number of confirmed COVID-19 cases, income levels, industry structure, age and racial distribution play important roles. The data informatics generated by the framework are made available to the public for a timely understanding of mobility trends and policy effects, as well as for time-sensitive decision support to further contain the spread of the virus.
Keywords: COVID-19; Generalized additive mixed model; Human mobility; Mobile device location data; Non-pharmaceutical interventions.
© 2021 Elsevier Ltd. All rights reserved.
Figures
Similar articles
-
Structural modeling of COVID-19 spread in relation to human mobility.Transp Res Interdiscip Perspect. 2022 Mar;13:100528. doi: 10.1016/j.trip.2021.100528. Epub 2021 Dec 29. Transp Res Interdiscip Perspect. 2022. PMID: 35128388 Free PMC article.
-
Mobile device location data reveal human mobility response to state-level stay-at-home orders during the COVID-19 pandemic in the USA.J R Soc Interface. 2020 Dec;17(173):20200344. doi: 10.1098/rsif.2020.0344. Epub 2020 Dec 16. J R Soc Interface. 2020. PMID: 33323055 Free PMC article.
-
Quantitative resilience assessment of the network-level metro rail service's responses to the COVID-19 pandemic.Sustain Cities Soc. 2023 Feb;89:104315. doi: 10.1016/j.scs.2022.104315. Epub 2022 Nov 21. Sustain Cities Soc. 2023. PMID: 36437881 Free PMC article.
-
Human mobility trends during the early stage of the COVID-19 pandemic in the United States.PLoS One. 2020 Nov 9;15(11):e0241468. doi: 10.1371/journal.pone.0241468. eCollection 2020. PLoS One. 2020. PMID: 33166301 Free PMC article.
-
Pandemic Analytics: How Countries are Leveraging Big Data Analytics and Artificial Intelligence to Fight COVID-19?SN Comput Sci. 2022;3(1):54. doi: 10.1007/s42979-021-00923-y. Epub 2021 Nov 9. SN Comput Sci. 2022. PMID: 34778841 Free PMC article. Review.
Cited by
-
COVID-19 lockdown policy and heterogeneous responses of urban mobility: Evidence from the Philippines.PLoS One. 2022 Jun 30;17(6):e0270555. doi: 10.1371/journal.pone.0270555. eCollection 2022. PLoS One. 2022. PMID: 35771739 Free PMC article.
-
On some fundamental challenges in monitoring epidemics.Philos Trans A Math Phys Eng Sci. 2022 Jan 10;380(2214):20210117. doi: 10.1098/rsta.2021.0117. Epub 2021 Nov 22. Philos Trans A Math Phys Eng Sci. 2022. PMID: 34802270 Free PMC article.
-
Modeling indoor-level non-pharmaceutical interventions during the COVID-19 pandemic: A pedestrian dynamics-based microscopic simulation approach.Transp Policy (Oxf). 2021 Aug;109:12-23. doi: 10.1016/j.tranpol.2021.05.004. Epub 2021 May 16. Transp Policy (Oxf). 2021. PMID: 34025048 Free PMC article.
-
Structural modeling of COVID-19 spread in relation to human mobility.Transp Res Interdiscip Perspect. 2022 Mar;13:100528. doi: 10.1016/j.trip.2021.100528. Epub 2021 Dec 29. Transp Res Interdiscip Perspect. 2022. PMID: 35128388 Free PMC article.
-
Phase-wise evaluation and optimization of non-pharmaceutical interventions to contain the COVID-19 pandemic in the U.S.Front Public Health. 2023 Aug 3;11:1198973. doi: 10.3389/fpubh.2023.1198973. eCollection 2023. Front Public Health. 2023. PMID: 37601210 Free PMC article.
References
-
- Alexander L., Jiang S., Murga M., González M.C. Origin–destination trips by purpose and time of day inferred from mobile phone data. Transport. Res. Part C: Emerg. Technol. 2015;58:240–250.
-
- Apple, 2020. Mobility Trends Reports, https://covid19.apple.com/mobility.
-
- C2SMART, C.S.U.T.C., 2020. C2SMART COVID-19 Data Dashboard. C2SMART University Transportation Center, http://c2smart.engineering.nyu.edu/covid-19-dashboard/.
-
- CDC, 2020. CDC COVID Data Tracker, https://covid.cdc.gov/covid-data-tracker/#mobility.
LinkOut - more resources
Full Text Sources
Other Literature Sources