Prognostic Correlation of an Autophagy-Related Gene Signature in Patients with Head and Neck Squamous Cell Carcinoma
- PMID: 33456497
- PMCID: PMC7785385
- DOI: 10.1155/2020/7397132
Prognostic Correlation of an Autophagy-Related Gene Signature in Patients with Head and Neck Squamous Cell Carcinoma
Abstract
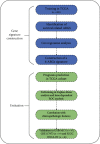
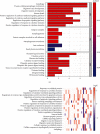
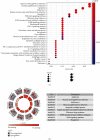
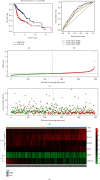
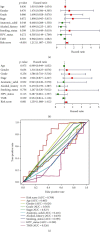
Considerable evidence indicates that autophagy plays a vital role in the biological processes of various cancers. The aim of this study is to evaluate the prognostic value of autophagy-related genes in patients with head and neck squamous cell carcinoma (HNSCC). Transcriptome expression profiles and clinical data acquired from The Cancer Genome Atlas (TCGA) database were analyzed by Cox proportional hazards model and Kaplan-Meier survival analysis to screen autophagy-related prognostic genes that were significantly correlated with HNSCC patients' overall survival. Functional enrichment analyses were performed to explore biological functions of differentially expressed autophagy-related genes (ARGs) identified in HNSCC patients. Six ARGs (EGFR, HSPB8, PRKN, CDKN2A, FADD, and ITGA3) identified with significantly prognostic values for HNSCC were used to construct a risk signature that could stratify patients into the high-risk and low-risk groups. This signature demonstrated great value in predicting prognosis for HNSCC patients and was indicated as an independent prognostic factor in terms of clinicopathological characteristics (sex, age, clinical stage, histological grade, anatomic subdivision, alcohol history, smoking status, HPV status, and mutational status of the samples). The prognostic signature was also validated by data from the Gene Expression Omnibus (GEO) database and International Cancer Genome Consortium (ICGC). In conclusion, this study provides a novel autophagy-related gene signature for predicting prognosis of HNSCC patients and gives molecular insights of autophagy in HNSCC.
Copyright © 2020 Cai Yang et al.
Conflict of interest statement
The authors declare that there is no conflict of interest regarding the publication of this paper.
Figures





Similar articles
-
Autophagy-Related Signature for Head and Neck Squamous Cell Carcinoma.Dis Markers. 2020 Oct 19;2020:8899337. doi: 10.1155/2020/8899337. eCollection 2020. Dis Markers. 2020. PMID: 33133307 Free PMC article.
-
Development of a Prognostic Signature Based on Autophagy-related Genes for Head and Neck Squamous Cell Carcinoma.Arch Med Res. 2020 Nov;51(8):860-867. doi: 10.1016/j.arcmed.2020.09.009. Epub 2020 Sep 15. Arch Med Res. 2020. PMID: 32948377
-
Development and validation of a novel survival model for head and neck squamous cell carcinoma based on autophagy-related genes.Genomics. 2021 Jan;113(1 Pt 2):1166-1175. doi: 10.1016/j.ygeno.2020.11.017. Epub 2020 Nov 20. Genomics. 2021. PMID: 33227411
-
Prognostic value of FGFR1 expression and amplification in patients with HNSCC: A systematic review and meta-analysis.PLoS One. 2021 May 14;16(5):e0251202. doi: 10.1371/journal.pone.0251202. eCollection 2021. PLoS One. 2021. PMID: 33989301 Free PMC article.
-
Expression of SESN1, UHRF1BP1, and miR-377-3p as prognostic markers in mutated TP53 squamous cell carcinoma of the head and neck.Cancer Biol Ther. 2017 Oct 3;18(10):775-782. doi: 10.1080/15384047.2017.1373212. Epub 2017 Sep 8. Cancer Biol Ther. 2017. PMID: 28886272 Free PMC article. Review.
Cited by
-
Unravelling the roles of Autophagy in OSCC: A renewed perspective from mechanisms to potential applications.Front Pharmacol. 2022 Oct 3;13:994643. doi: 10.3389/fphar.2022.994643. eCollection 2022. Front Pharmacol. 2022. PMID: 36263139 Free PMC article. Review.
-
Identification and validation of a prognostic signature of autophagy, apoptosis and pyroptosis-related genes for head and neck squamous cell carcinoma: to imply therapeutic choices of HPV negative patients.Front Immunol. 2023 Jan 10;13:1100417. doi: 10.3389/fimmu.2022.1100417. eCollection 2022. Front Immunol. 2023. PMID: 36703967 Free PMC article.
-
Inflammation-Related Gene Signature for Predicting the Prognosis of Head and Neck Squamous Cell Carcinoma.Int J Gen Med. 2022 May 9;15:4793-4805. doi: 10.2147/IJGM.S354349. eCollection 2022. Int J Gen Med. 2022. PMID: 35592543 Free PMC article.
-
Prognostic Value of a Ferroptosis-Related Gene Signature in Patients With Head and Neck Squamous Cell Carcinoma.Front Cell Dev Biol. 2021 Nov 1;9:739011. doi: 10.3389/fcell.2021.739011. eCollection 2021. Front Cell Dev Biol. 2021. PMID: 34790661 Free PMC article.
-
HSPB8 counteracts tumor activity of BRAF- and NRAS-mutant melanoma cells by modulation of RAS-prenylation and autophagy.Cell Death Dis. 2022 Nov 18;13(11):973. doi: 10.1038/s41419-022-05365-9. Cell Death Dis. 2022. PMID: 36400750 Free PMC article.
References
-
- Global Burden of Disease Cancer Collaboration, Fitzmaurice C., Abate D., et al. Global, regional, and national cancer incidence, mortality, years of life lost, years lived with disability, and disability-adjusted life-years for 29 cancer groups, 1990 to 2017: a systematic analysis for the global burden of disease study. JAMA Oncology. 2019;5(12):1749–1768. doi: 10.1001/jamaoncol.2019.2996. - DOI - PMC - PubMed
MeSH terms
Substances
LinkOut - more resources
Full Text Sources
Medical
Research Materials
Miscellaneous

